Home > Comparison > Healthcare > JNJ vs MRK
The strategic rivalry between Johnson & Johnson and Merck & Co. defines the current trajectory of the healthcare sector. Johnson & Johnson operates as a diversified healthcare giant, focusing on innovative medicines and medical devices. Merck emphasizes pharmaceuticals and animal health, leveraging specialized drug development and collaborations. This head-to-head reflects a contrast between diversified innovation and focused pharmaceutical expertise. This analysis will determine which corporate path offers superior risk-adjusted returns for a diversified portfolio.
Table of contents
Companies Overview
Johnson & Johnson and Merck & Co. dominate the US healthcare sector with distinct strategic focuses.
Johnson & Johnson: Healthcare Innovator with Diversified MedTech Focus
Johnson & Johnson stands as a healthcare giant specializing in pharmaceuticals and medical devices. It generates revenue primarily through its Innovative Medicine segment, targeting complex diseases, and its MedTech segment, offering advanced surgical and orthopaedic solutions. Since spinning off its Consumer Health business in 2023, J&J prioritizes innovation-driven growth in prescription medicines and cutting-edge medical technologies.
Merck & Co., Inc.: Pharmaceutical Powerhouse with Broad Therapeutic Reach
Merck & Co. operates as a major pharmaceutical manufacturer, focusing on human health products across oncology, immunology, and vaccines. It also maintains an Animal Health segment supplying veterinary pharmaceuticals and digital health solutions. In 2026, Merck emphasizes strategic collaborations to develop long-acting HIV treatments, underscoring its commitment to expanding therapeutic frontiers and vaccine innovation.
Strategic Collision: Similarities & Divergences
Both companies compete heavily in pharmaceutical innovation but differ in strategic scope—J&J integrates medical devices with pharma, while Merck extends into animal health and vaccine partnerships. Their battleground centers on complex disease treatment and vaccine markets. J&J’s diversified MedTech portfolio contrasts with Merck’s focused pharmaceutical collaborations, creating distinct risk-reward profiles for investors.
Income Statement Comparison
The following data dissects the core profitability and scalability of both corporate engines to reveal who dominates the bottom line:
| Metric | Johnson & Johnson (JNJ) | Merck & Co., Inc. (MRK) |
|---|---|---|
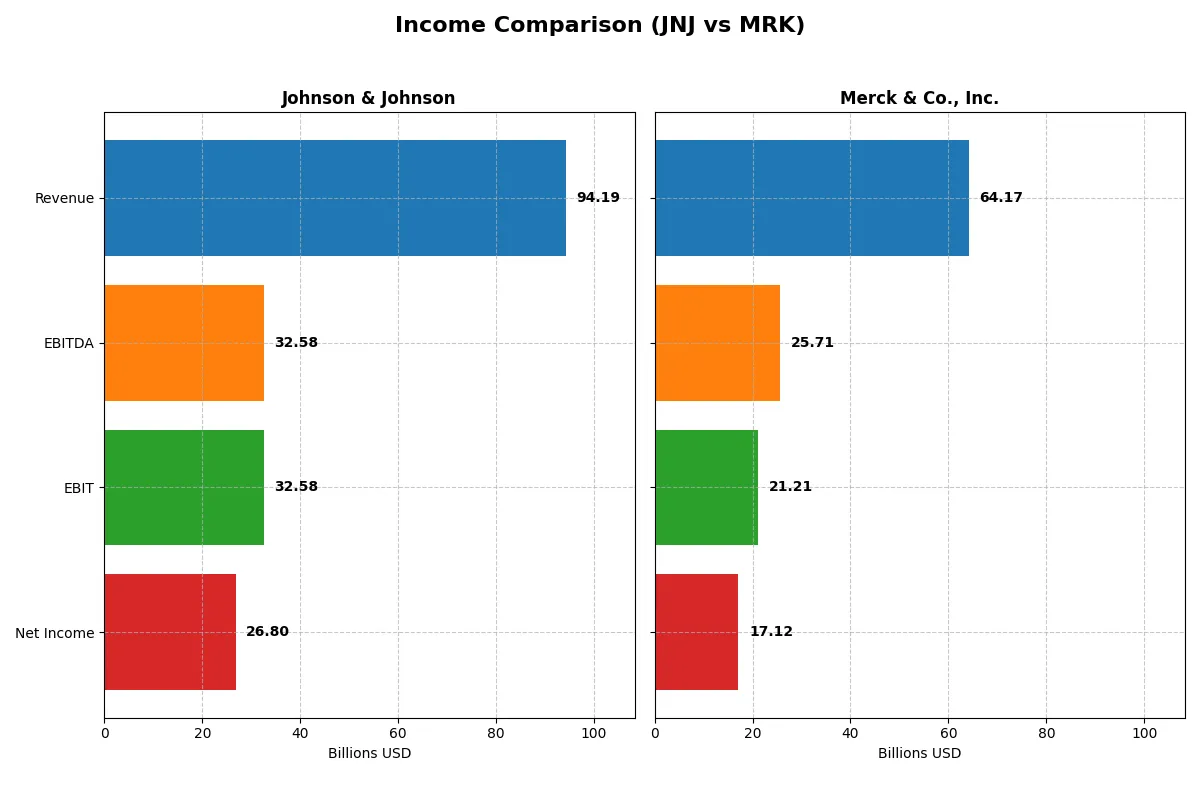
| Revenue | 94.2B | 64.2B |
| Cost of Revenue | 25.6B | 15.2B |
| Operating Expenses | 42.9B | 28.8B |
| Gross Profit | 68.6B | 49.0B |
| EBITDA | 32.6B | 25.7B |
| EBIT | 32.6B | 21.2B |
| Interest Expense | 0 | 1.3B |
| Net Income | 26.8B | 17.1B |
| EPS (Diluted) | 11.03 | 6.74 |
| Fiscal Year | 2025 | 2024 |
Income Statement Analysis: The Bottom-Line Duel
This income statement comparison reveals which company operates with superior efficiency and delivers greater shareholder value through its core business operations.
Johnson & Johnson Analysis
Johnson & Johnson’s revenue grew steadily from $78.7B in 2021 to $94.2B in 2025, with net income rising from $20.9B to $26.8B in the same period. Its gross margin stands strong at 72.8%, and net margin at 28.5%, reflecting solid profitability. In 2025, JNJ accelerated earnings growth sharply, showcasing efficient cost control despite a slight rise in operating expenses.
Merck & Co., Inc. Analysis
Merck’s revenue climbed from $48.7B in 2021 to $64.2B in 2024, with net income surging from $13.0B to $17.1B. The company boasts a higher gross margin of 76.3% but a slightly lower net margin of 26.7%. Merck’s 2024 results highlight exceptional momentum, with EBIT and net margin growth rates far exceeding typical sector performance, driven by disciplined operating expense management.
Margin Strength vs. Explosive Growth
Merck outpaces Johnson & Johnson in revenue and net income growth, delivering superior margins and remarkable earnings acceleration. JNJ maintains consistent profitability and margin stability with a slightly lower growth trajectory. Investors seeking rapid expansion might favor Merck’s dynamic profile, while those valuing steady margin resilience may find Johnson & Johnson more attractive.
Financial Ratios Comparison
These vital ratios act as a diagnostic tool to expose the underlying fiscal health, valuation premiums, and capital efficiency of the companies analyzed:
| Ratios | Johnson & Johnson (JNJ) | Merck & Co., Inc. (MRK) |
|---|---|---|
| ROE | 19.7% (2024) | 37.0% (2024) |
| ROIC | 13.8% (2024) | 18.9% (2024) |
| P/E | 24.5 (2024) | 14.7 (2024) |
| P/B | 4.83 (2024) | 5.44 (2024) |
| Current Ratio | 1.11 (2024) | 1.36 (2024) |
| Quick Ratio | 0.86 (2024) | 1.15 (2024) |
| D/E | 0.51 (2024) | 0.83 (2024) |
| Debt-to-Assets | 20.3% (2024) | 32.7% (2024) |
| Interest Coverage | 29.3 (2024) | 15.9 (2024) |
| Asset Turnover | 0.49 (2024) | 0.55 (2024) |
| Fixed Asset Turnover | 4.33 (2024) | 2.70 (2024) |
| Payout Ratio | 84.1% (2024) | 45.8% (2024) |
| Dividend yield | 3.43% (2024) | 3.11% (2024) |
| Fiscal Year | 2024 | 2024 |
Efficiency & Valuation Duel: The Vital Signs
Financial ratios serve as a company’s DNA, uncovering hidden risks and operational strengths that raw numbers alone cannot reveal.
Johnson & Johnson
JNJ posts a strong net margin of 28.46%, indicating solid profitability, but zero ROE and ROIC signal concerns on capital efficiency. Its P/E at 18.75 appears fairly priced. The 2.48% dividend yield reflects steady shareholder returns, balancing moderate growth reinvestment with consistent income.
Merck & Co., Inc.
MRK delivers robust profitability with a 36.96% ROE and 26.68% net margin, showcasing operational efficiency. Trading at a P/E of 14.72, the stock looks attractively valued. Merck supports shareholders with a 3.11% dividend yield, complemented by strong reinvestment in R&D fueling future growth.
Operational Strength vs. Valuation Appeal
Merck’s superior return metrics and favorable valuation offer a better risk-reward balance compared to Johnson & Johnson’s mixed efficiency signals. Investors favoring growth with income might prefer Merck’s more dynamic profile. Those seeking stability and dividends may consider JNJ’s steady payout despite weaker capital returns.
Which one offers the Superior Shareholder Reward?
I observe Johnson & Johnson (JNJ) delivers a 3.4% dividend yield with a 84% payout ratio, signaling robust free cash flow coverage and a conservative distribution. Merck (MRK) yields slightly less at 3.1% with a 46% payout, balancing dividends with growth reinvestment. Both execute buybacks, but JNJ’s steady payout and buyback cadence offer more sustainable, predictable returns. MRK’s higher leverage and variable margins add risk despite growth potential. I conclude JNJ provides a superior total shareholder reward profile for 2026 investors seeking durable income and capital appreciation.
Comparative Score Analysis: The Strategic Profile
The radar chart reveals the fundamental DNA and strategic trade-offs of Johnson & Johnson and Merck & Co., Inc.:
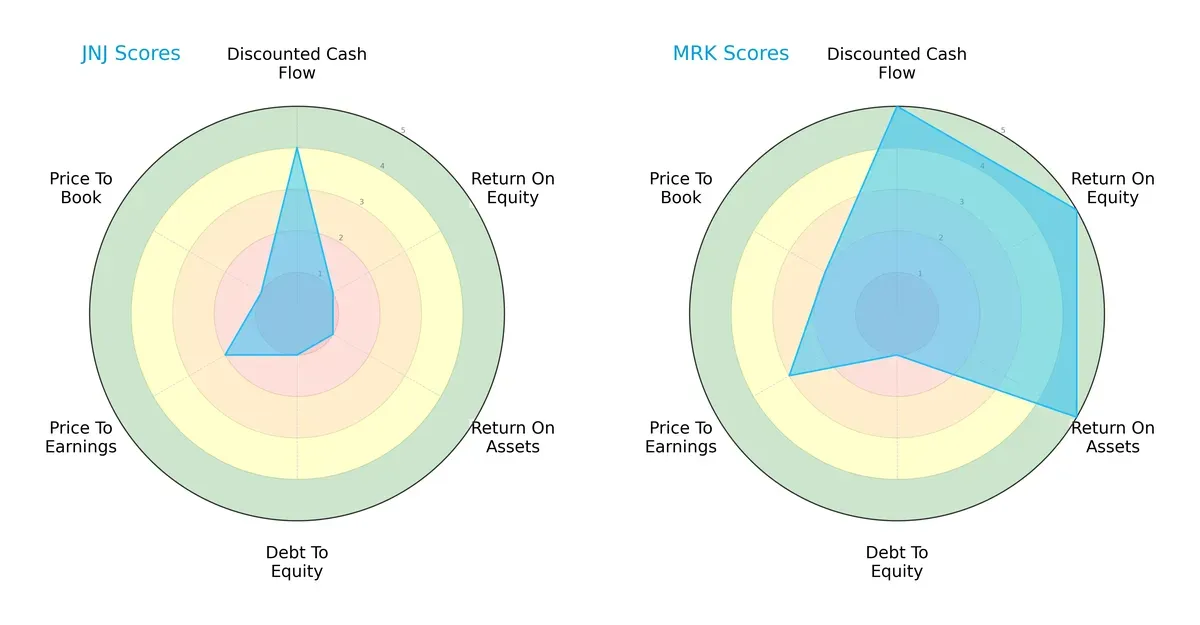
Merck outperforms Johnson & Johnson in DCF, ROE, and ROA, showing superior profitability and cash flow generation. Both face high debt-to-equity risks, but Merck maintains a better valuation balance (PE/PB). Johnson & Johnson’s profile is less balanced, relying mainly on moderate DCF strength.
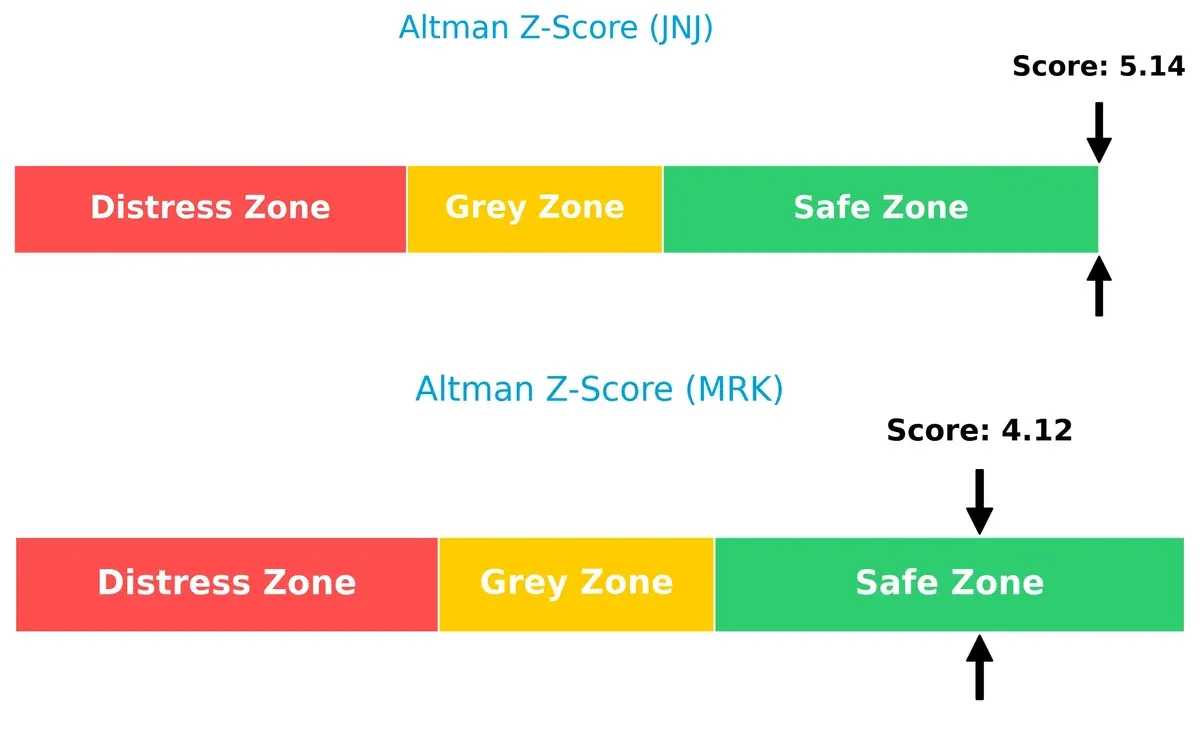
Bankruptcy Risk: Solvency Showdown
Merck’s Altman Z-Score of 4.12 versus Johnson & Johnson’s 5.14 signals both firms are in the safe zone, with J&J showing stronger insolvency resilience in this cycle:
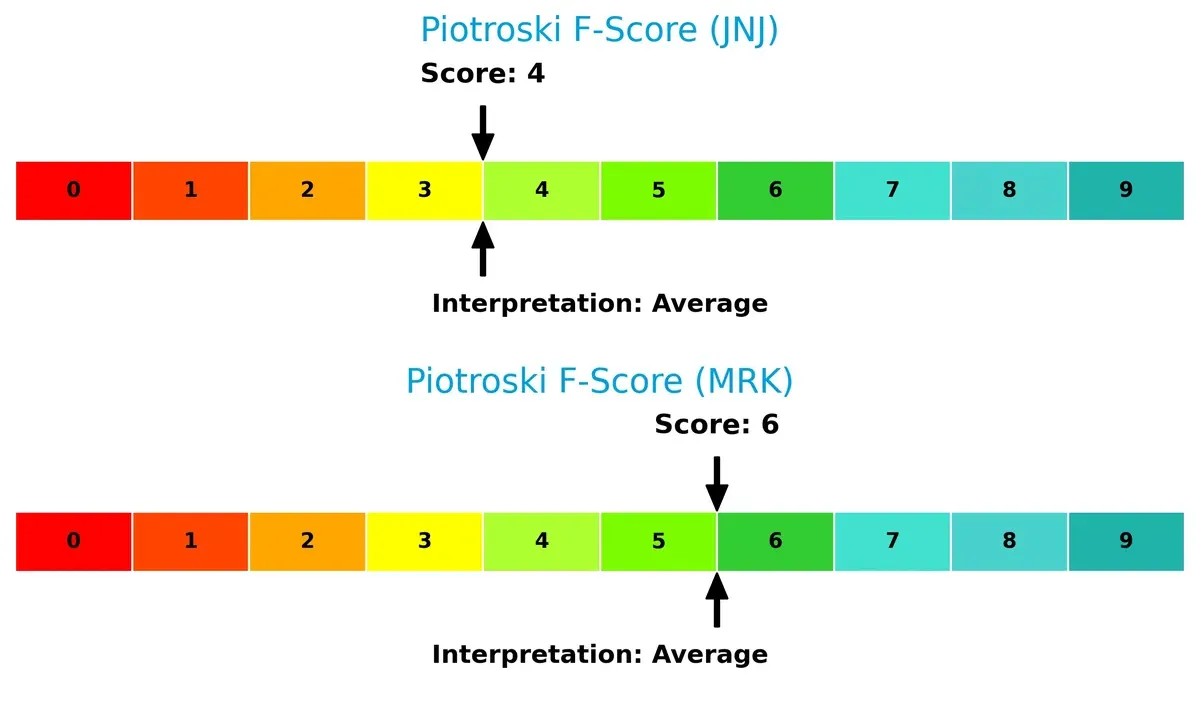
Financial Health: Quality of Operations
Merck’s Piotroski F-Score of 6 surpasses Johnson & Johnson’s 4, indicating Merck operates with stronger internal financial health. Johnson & Johnson’s lower score raises caution on operational efficiency and profitability:
How are the two companies positioned?
This section dissects JNJ and MRK’s operational DNA by comparing their revenue distribution and internal strengths and weaknesses. The goal is to confront their economic moats and identify which offers the most resilient, sustainable advantage today.
Revenue Segmentation: The Strategic Mix
This visual comparison dissects how Johnson & Johnson and Merck & Co., Inc. diversify income streams and reveals their primary sector bets:
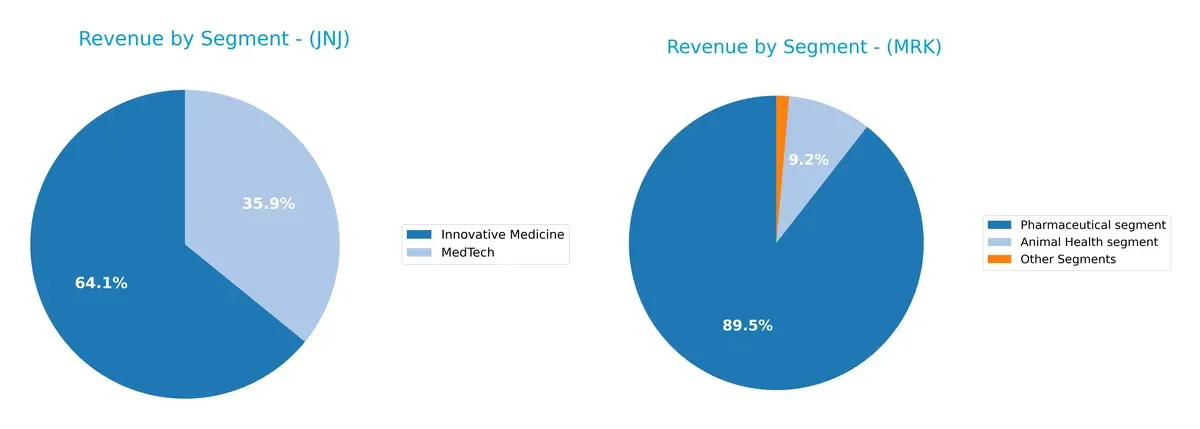
Johnson & Johnson shows a more balanced revenue mix, with Innovative Medicine at $57B and MedTech near $32B in 2024, plus a smaller Consumer segment. Merck relies heavily on its Pharmaceutical segment at $57.4B, dwarfing its $5.9B Animal Health business. J&J’s diversification reduces concentration risk, leveraging ecosystem lock-in across healthcare sectors. Merck’s focus pivots on pharmaceutical dominance, exposing it to industry-specific cycles but benefiting from scale and R&D depth.
Strengths and Weaknesses Comparison
This table compares the Strengths and Weaknesses of Johnson & Johnson and Merck based on diversification, profitability, financials, innovation, global presence, and market share:
JNJ Strengths
- Broad product segments including Innovative Medicine, MedTech, and Consumer
- Strong net margin at 28.46%
- Favorable debt management and interest coverage
- Significant US and European market presence with diversified geography
MRK Strengths
- High profitability metrics with 36.96% ROE and 18.97% ROIC
- Favorable WACC at 4.92% supports capital efficiency
- Solid dividend yield at 3.11%
- Balanced geographic footprint including US, EMEA, Asia Pacific
JNJ Weaknesses
- Zero or unavailable ROE and ROIC indicate weak capital returns
- Unfavorable liquidity ratios, including current and quick ratios at 0
- Neutral P/E despite strong margin suggests valuation uncertainty
- Asset turnover ratios unfavorable, indicating potential operational inefficiency
MRK Weaknesses
- High price-to-book ratio at 5.44 signals potential overvaluation
- Moderate debt-to-assets at 32.68% with neutral debt/equity
- Neutral current ratio at 1.36 shows less liquidity cushion
- Asset turnover neutral, implying average efficiency
Johnson & Johnson demonstrates strong diversification and stable profitability but faces challenges in capital returns and liquidity. Merck excels in profitability and capital efficiency but shows risks in valuation and moderate leverage. Both companies maintain substantial global presence, shaping their strategic positioning.
The Moat Duel: Analyzing Competitive Defensibility
A structural moat is the only thing protecting long-term profits from the erosion of competition. Let’s dissect the moats of two healthcare giants:
Johnson & Johnson: Diversified Innovation Moat
JNJ’s moat stems from its broad portfolio and cutting-edge MedTech and Innovative Medicine segments. Its stable 28.5% net margin and 34.6% EBIT margin reflect this strength. However, a declining ROIC trend signals caution; innovation must accelerate in 2026 to sustain its edge.
Merck & Co., Inc.: Focused Pharmaceutical Moat
MRK relies on a focused pharmaceutical moat with blockbuster drugs and vaccines. Its ROIC outpaces WACC by 14%, showing efficient capital use and value creation. With a 214% ROIC growth trend and strong 26.7% net margin, MRK’s moat deepens, fueled by promising pipeline collaborations in 2026.
Innovation Breadth vs. Pharmaceutical Precision
MRK’s focused pharmaceutical moat is deeper and more durable, supported by rising ROIC and robust profitability. JNJ’s diversified moat is broad but weakened by declining capital returns. Merck is better positioned to defend its market share in the evolving healthcare landscape.
Which stock offers better returns?
Over the past 12 months, Johnson & Johnson’s stock surged 42.46%, showing strong acceleration and reaching a high of 227.25. Merck’s shares declined 10.71%, despite recent recovery signs.
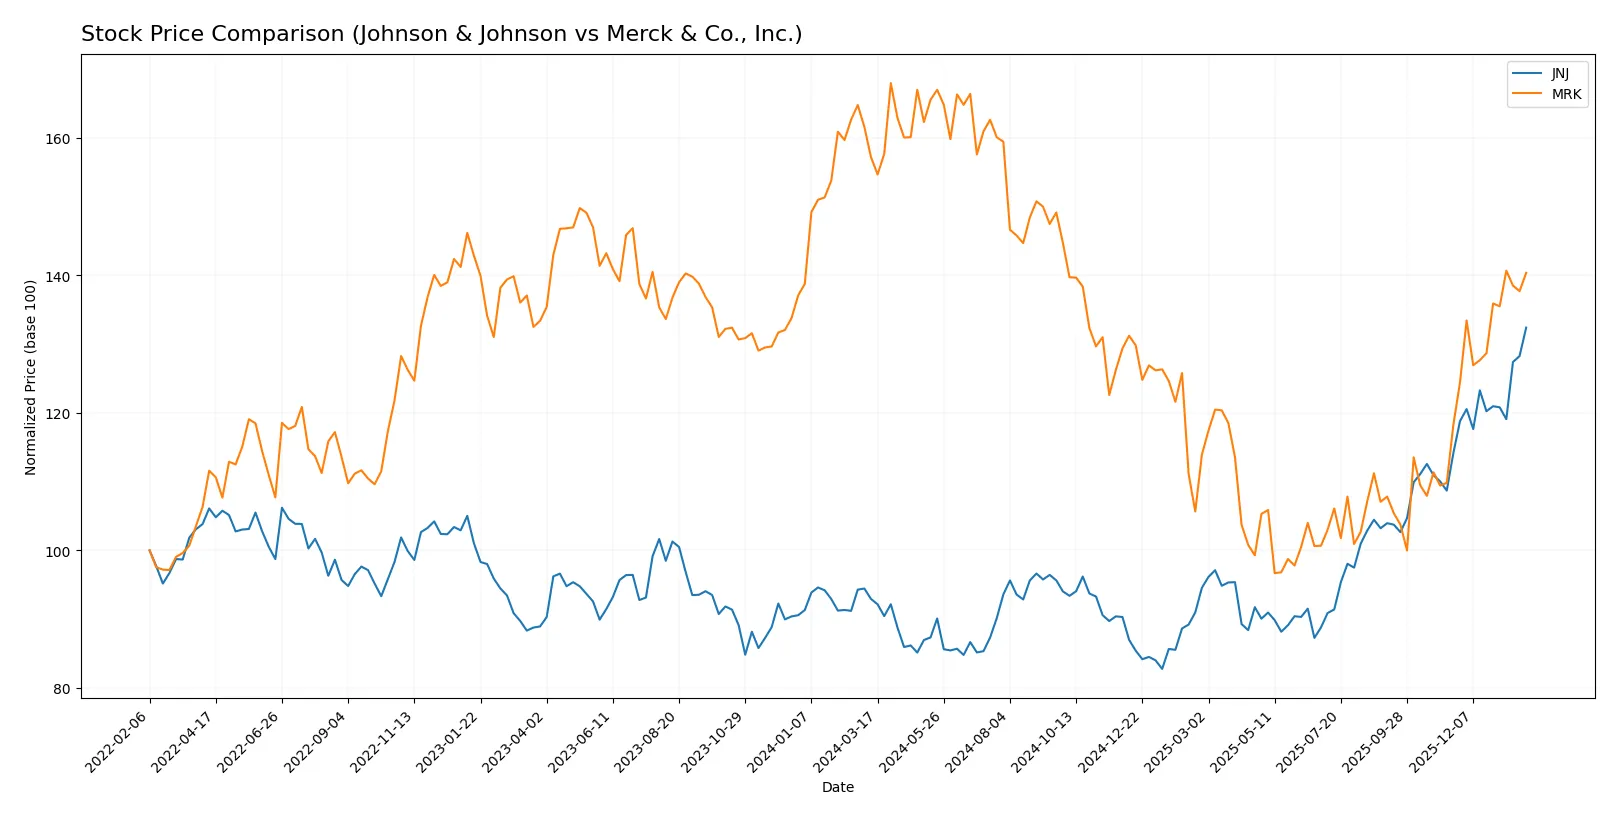
Trend Comparison
Johnson & Johnson’s stock posted a 42.46% gain over the past year, confirming a bullish trend with accelerating momentum and a high volatility level (19.93 std dev). The price peaked at 227.25 and bottomed at 142.06.
Merck’s stock declined 10.71% over the same period, signaling a bearish trend despite acceleration. The stock’s volatility is slightly lower at 17.49 std dev, with a high of 131.95 and a low of 75.97.
Comparing these trends, Johnson & Johnson delivered the highest market performance with a strong bullish advance, while Merck experienced a significant downturn.
Target Prices
Analysts present a balanced target price consensus for Johnson & Johnson and Merck & Co., reflecting steady confidence in their healthcare franchises.
| Company | Target Low | Target High | Consensus |
|---|---|---|---|
| Johnson & Johnson | 190 | 265 | 228.33 |
| Merck & Co., Inc. | 90 | 135 | 118.5 |
The target consensus for Johnson & Johnson at 228.33 slightly exceeds its current price of 227.25, signaling modest upside potential. Merck’s consensus target of 118.5 stands above its current price of 110.27, indicating room for appreciation amid stable fundamentals.

Don’t Let Luck Decide Your Entry Point
Optimize your entry points with our advanced ProRealTime indicators. You’ll get efficient buy signals with precise price targets for maximum performance. Start outperforming now!
How do institutions grade them?
Here is a summary of recent institutional grading updates for Johnson & Johnson and Merck & Co., Inc.:
Johnson & Johnson Grades
The following table shows recent grade changes and maintenances by reputable institutions for Johnson & Johnson:
| Grading Company | Action | New Grade | Date |
|---|---|---|---|
| Morgan Stanley | Upgrade | Overweight | 2026-01-28 |
| Freedom Capital Markets | Maintain | Hold | 2026-01-27 |
| Guggenheim | Maintain | Buy | 2026-01-23 |
| Stifel | Maintain | Hold | 2026-01-22 |
| Citigroup | Maintain | Buy | 2026-01-22 |
| Scotiabank | Maintain | Sector Outperform | 2026-01-22 |
| Morgan Stanley | Maintain | Equal Weight | 2026-01-22 |
| B of A Securities | Maintain | Neutral | 2026-01-22 |
| TD Cowen | Maintain | Buy | 2026-01-22 |
| Wells Fargo | Maintain | Overweight | 2026-01-22 |
Merck & Co., Inc. Grades
Below is the table presenting recent reliable institutional grades for Merck & Co., Inc.:
| Grading Company | Action | New Grade | Date |
|---|---|---|---|
| Citigroup | Maintain | Neutral | 2026-01-27 |
| TD Cowen | Maintain | Hold | 2026-01-20 |
| Wolfe Research | Upgrade | Outperform | 2026-01-08 |
| UBS | Maintain | Buy | 2026-01-07 |
| Citigroup | Maintain | Neutral | 2026-01-07 |
| BMO Capital | Upgrade | Outperform | 2025-12-18 |
| B of A Securities | Maintain | Buy | 2025-12-15 |
| Morgan Stanley | Maintain | Equal Weight | 2025-12-12 |
| Scotiabank | Maintain | Sector Outperform | 2025-12-04 |
| Goldman Sachs | Maintain | Buy | 2025-12-02 |
Which company has the best grades?
Johnson & Johnson generally holds stronger and more consistent buy and overweight ratings. Merck sees more variability, with neutral and hold ratings alongside some outperform upgrades. Investors might interpret Johnson & Johnson’s steadier positive grades as a signal of greater institutional confidence.
Risks specific to each company
The following categories identify the critical pressure points and systemic threats facing Johnson & Johnson and Merck & Co., Inc. in the 2026 market environment:
1. Market & Competition
Johnson & Johnson
- Faces intense competition in MedTech and Innovative Medicine segments amid rapid healthcare innovation.
Merck & Co., Inc.
- Strong pharmaceutical pipeline with collaborations, yet faces competition in oncology and vaccines.
2. Capital Structure & Debt
Johnson & Johnson
- Exhibits a very strong balance sheet with favorable debt-to-equity and interest coverage ratios.
Merck & Co., Inc.
- Moderate leverage with debt-to-equity at 0.83; interest coverage remains healthy but debt risk is notable.
3. Stock Volatility
Johnson & Johnson
- Low beta (0.33) indicates defensive stock with limited volatility relative to the market.
Merck & Co., Inc.
- Even lower beta (0.30) suggests a stable stock with minimal downside during market swings.
4. Regulatory & Legal
Johnson & Johnson
- Legacy legal challenges persist in consumer health legacy issues despite strategic divestitures.
Merck & Co., Inc.
- Regulatory scrutiny on new drug approvals and vaccine safety remains a constant challenge.
5. Supply Chain & Operations
Johnson & Johnson
- Complex global supply chain for medical devices and pharmaceuticals vulnerable to disruptions.
Merck & Co., Inc.
- Strong operational focus but dependent on raw materials and biologics supply continuity.
6. ESG & Climate Transition
Johnson & Johnson
- Committed to sustainability but faces pressure to improve ESG scores amid industry benchmarks.
Merck & Co., Inc.
- Proactively advancing ESG initiatives with emphasis on climate impact reduction and governance.
7. Geopolitical Exposure
Johnson & Johnson
- Global footprint exposes it to US-China tensions and emerging market instability risks.
Merck & Co., Inc.
- Similar global exposure with additional risks from supply chain geopolitical constraints.
Which company shows a better risk-adjusted profile?
Merck’s strongest risk is its moderate leverage, which raises financial risk despite solid profitability and liquidity. Johnson & Johnson’s critical risk lies in legacy legal and operational challenges affecting its innovation focus. Merck’s favorable ROE, ROIC, and Altman Z-Score indicate a superior risk-adjusted profile. Notably, Merck’s robust return metrics and stable debt servicing justify confidence despite debt concerns.
Final Verdict: Which stock to choose?
Johnson & Johnson’s superpower lies in its resilient cash generation and diversified healthcare portfolio. Its point of vigilance is a declining ROIC trend, which might pressure long-term value creation. It fits well into portfolios seeking steady income with moderate growth exposure, such as Dividend Growth.
Merck & Co. demonstrates a robust strategic moat through consistently improving ROIC well above its WACC, signaling durable competitive advantage. Its stronger profitability metrics and safety scores suggest a more stable financial profile than Johnson & Johnson. It suits investors favoring Growth at a Reasonable Price (GARP) strategies.
If you prioritize consistent income with defensive qualities, Johnson & Johnson is the compelling choice due to its cash flow strength and dividend yield. However, if you seek growth backed by efficient capital allocation and durable moats, Merck offers better stability and superior value creation potential. Both present analytical scenarios that reflect distinct investor profiles and risk appetites.
Disclaimer: Investment carries a risk of loss of initial capital. The past performance is not a reliable indicator of future results. Be sure to understand risks before making an investment decision.
Go Further
I encourage you to read the complete analyses of Johnson & Johnson and Merck & Co., Inc. to enhance your investment decisions: