Home > Comparison > Industrials > TT vs JCI
The strategic rivalry between Trane Technologies plc and Johnson Controls International plc shapes the Industrials sector’s evolution. Trane operates as a focused HVAC and transport refrigeration manufacturer, while Johnson Controls leads with integrated building solutions and smart control systems. This analysis pits Trane’s product-centric model against Johnson’s diversified service approach to identify which offers superior risk-adjusted returns for a balanced portfolio in a dynamic industrial landscape.

Table of contents
Companies Overview
Trane Technologies and Johnson Controls dominate the global building solutions market with distinct product and service offerings.
Trane Technologies: Climate Control Innovator
Trane Technologies commands a strong position in heating, ventilation, air conditioning, and transport refrigeration. It generates revenue by designing, manufacturing, and servicing a wide range of HVAC products and systems. In 2026, its strategic focus lies in expanding energy-efficient solutions under its Trane and Thermo King brands worldwide.
Johnson Controls: Building Systems Powerhouse
Johnson Controls leads in building products and integrated systems engineering, serving commercial and industrial clients globally. It earns revenue from sales, installation, and maintenance of HVAC, fire safety, and security systems. The company prioritizes innovation in smart building technologies and energy efficiency to strengthen its global footprint this year.
Strategic Collision: Similarities & Divergences
Both companies emphasize HVAC and building management but diverge in approach. Trane Technologies leans on product innovation and refrigeration expertise, while Johnson Controls invests heavily in integrated smart systems and services. Their battleground is energy-efficient infrastructure for commercial buildings. Each presents a unique investment profile shaped by distinct market strategies and operational scale.
Income Statement Comparison
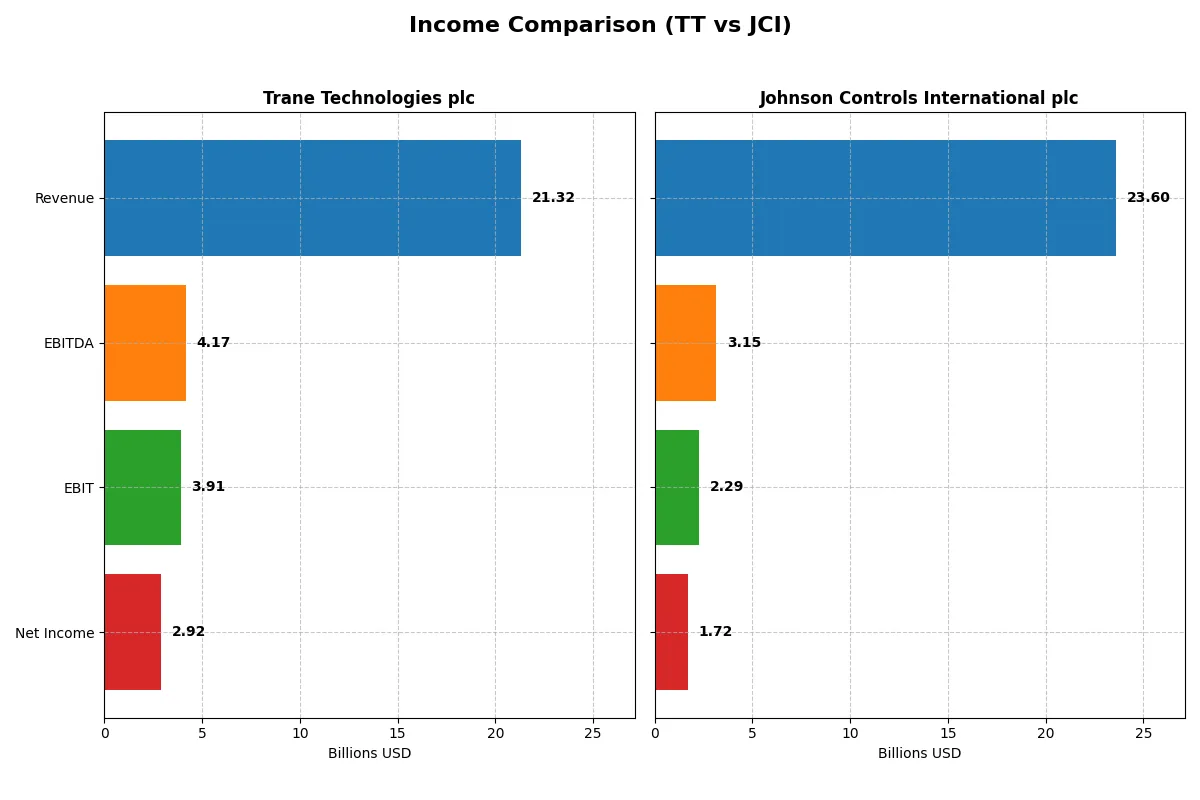
This data dissects the core profitability and scalability of both corporate engines to reveal who dominates the bottom line for the most recent fiscal year:
| Metric | Trane Technologies plc (TT) | Johnson Controls International plc (JCI) |
|---|---|---|
| Revenue | 21.3B | 23.6B |
| Cost of Revenue | 13.6B | 15.0B |
| Operating Expenses | 3.74B | 5.76B |
| Gross Profit | 7.71B | 8.59B |
| EBITDA | 4.17B | 3.15B |
| EBIT | 3.91B | 2.29B |
| Interest Expense | 228M | 319M |
| Net Income | 2.92B | 1.72B |
| EPS | 13.09 | 2.64 |
| Fiscal Year | 2025 | 2025 |
Income Statement Analysis: The Bottom-Line Duel
This income statement comparison reveals which company runs a more efficient and profitable corporate engine over recent years.
Trane Technologies plc Analysis
Trane Technologies grew revenue from $14.1B in 2021 to $21.3B in 2025, with net income doubling from $1.4B to $2.9B. Gross margin holds steady around 36%, while net margin improves to 13.7%, reflecting strong operational discipline and margin expansion. The 2025 results show accelerating EBIT growth (+12%) and a robust EPS increase (+15%), signaling growing profitability momentum.
Johnson Controls International plc Analysis
Johnson Controls’ revenue fluctuated near $23B-$25B from 2021 to 2025, with a slight decline over the period (-0.3%). Net income grew modestly by 5%, reaching $1.7B in 2025. Gross margin stays favorable at 36.4%, but EBIT margin lags at 9.7%, indicating cost pressures. Despite a 15% EBIT rise last year, net margin contracted slightly (-1.8%), suggesting mixed efficiency and profitability signals.
Margin Strength vs. Revenue Expansion
Trane Technologies clearly outperforms Johnson Controls on both margin quality and net income growth, doubling earnings with consistent revenue expansion. Johnson Controls delivers stable but slower net income growth and weaker EBIT margins. For investors, Trane’s profile of accelerating profitability and margin improvement offers a more compelling earnings engine.
Financial Ratios Comparison
These vital ratios act as a diagnostic tool to expose the underlying fiscal health, valuation premiums, and capital efficiency of the companies compared below:
| Ratios | Trane Technologies (TT) | Johnson Controls (JCI) |
|---|---|---|
| ROE | 33.9% | 13.3% |
| ROIC | 20.3% | 8.8% |
| P/E | 29.8 | 41.6 |
| P/B | 10.1 | 5.5 |
| Current Ratio | 1.25 | 0.93 |
| Quick Ratio | 0.92 | 0.76 |
| D/E | 0.54 | 0.76 |
| Debt-to-Assets | 21.5% | 26.0% |
| Interest Coverage | 17.4x | 8.9x |
| Asset Turnover | 1.00 | 0.62 |
| Fixed Asset Turnover | 9.5 | 10.8 |
| Payout ratio | 28.7% | 56.7% |
| Dividend yield | 0.96% | 1.36% |
| Fiscal Year | 2025 | 2025 |
Efficiency & Valuation Duel: The Vital Signs
Ratios serve as a company’s DNA, exposing hidden risks and operational efficiency that raw numbers alone cannot reveal.
Trane Technologies plc
Trane Technologies delivers robust profitability with a 33.93% ROE and 13.69% net margin, signaling strong operational efficiency. The stock appears stretched, trading at a high P/E of 29.82 and P/B of 10.12. Shareholders receive a modest 0.96% dividend yield, reflecting a cautious payout amid reinvestment priorities.
Johnson Controls International plc
Johnson Controls shows moderate profitability, with a 13.31% ROE and 7.29% net margin, indicating average operational performance. Its valuation seems stretched, marked by a 41.64 P/E and 5.54 P/B ratio. The company offers a 1.36% dividend yield but faces liquidity concerns with weaker current and quick ratios.
Premium Valuation vs. Operational Safety
Trane Technologies combines high profitability with a stretched valuation, while Johnson Controls trades at a premium with weaker margins and liquidity. The former offers a better balance of risk and reward for growth-focused investors. The latter suits those prioritizing a higher dividend yield despite financial constraints.
Which one offers the Superior Shareholder Reward?
I compare Trane Technologies (TT) and Johnson Controls (JCI) based on dividends, payout ratios, and buybacks. TT offers a modest 0.96% yield with a sustainable 29% payout ratio and robust free cash flow coverage above 2.6x. JCI yields 1.36% but pays out 57% of earnings, straining cash coverage near 1x. TT’s buyback intensity is higher, supporting shareholder returns through capital allocation. JCI’s weaker operating cash flow and lower coverage ratios signal risk. I conclude TT offers a more attractive, sustainable total return profile in 2026.
Comparative Score Analysis: The Strategic Profile
The radar chart reveals the fundamental DNA and trade-offs of Trane Technologies and Johnson Controls International:
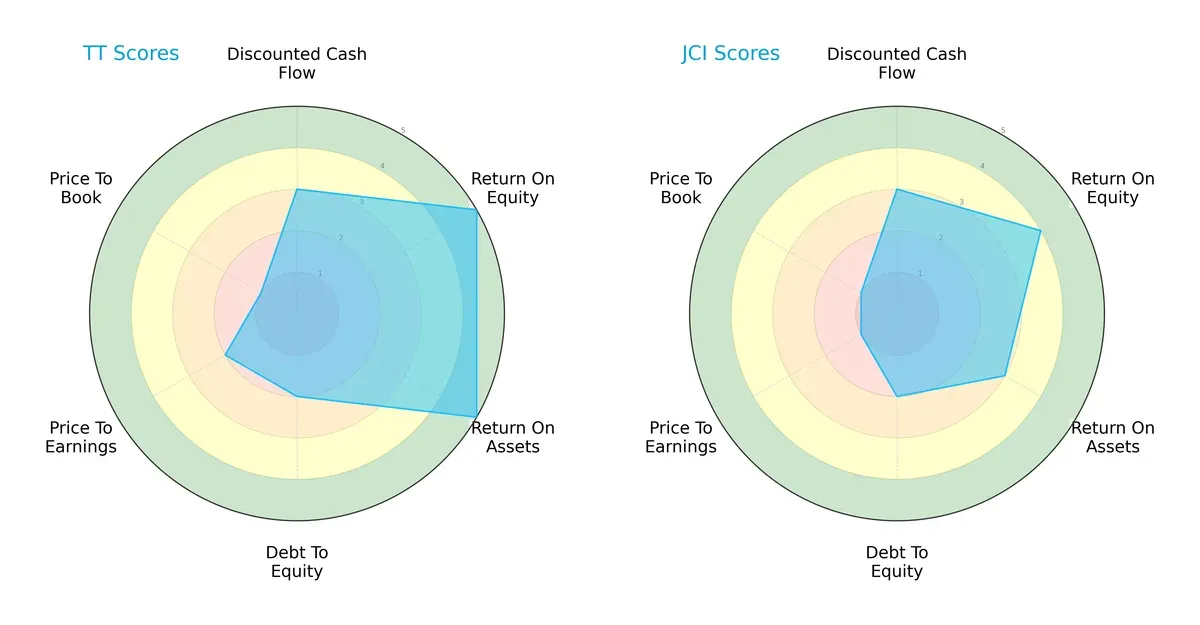
Trane Technologies exhibits a more balanced profile with strong ROE and ROA scores (5 each), highlighting efficient capital and asset use. Johnson Controls shows moderate returns (ROE 4, ROA 3) but shares similar debt-to-equity discipline (2). Both struggle with valuation metrics, yet Trane’s slightly better DCF score (3) and overall rating (3 vs. 2) give it a strategic edge.
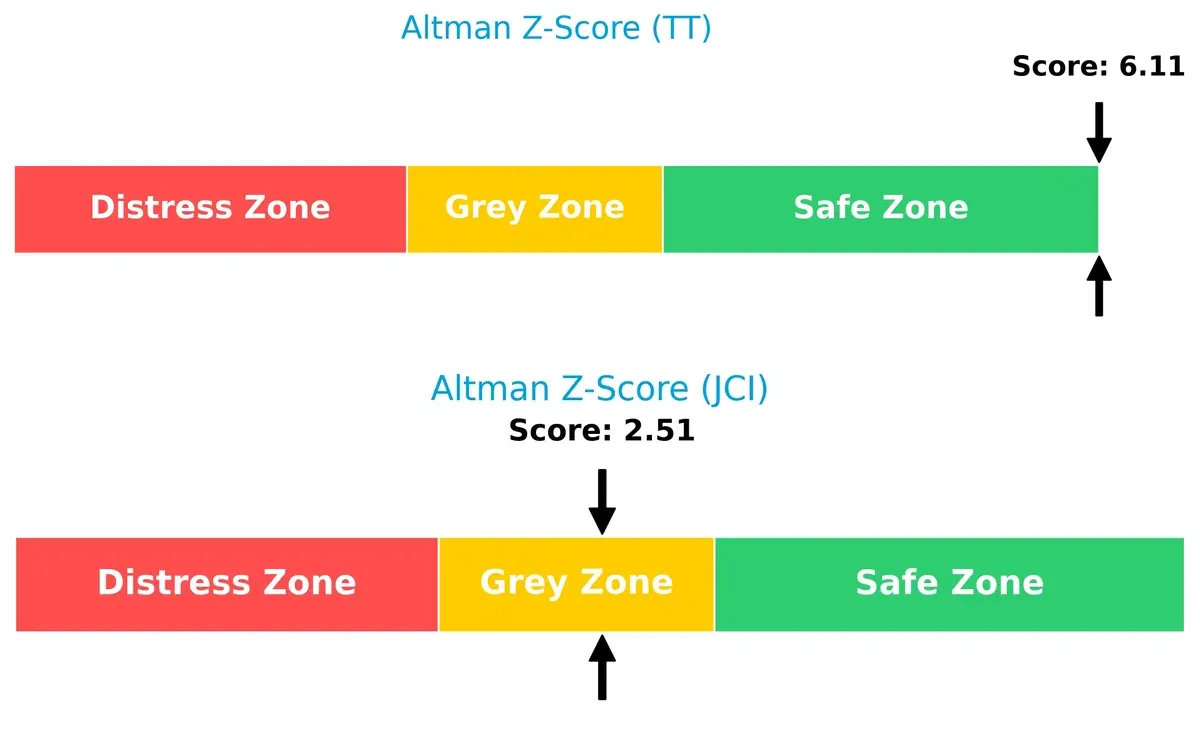
Bankruptcy Risk: Solvency Showdown
Trane Technologies’ Altman Z-Score of 6.11 places it comfortably in the safe zone, signaling robust financial stability. Johnson Controls’ 2.51 score falls in the grey zone, indicating moderate bankruptcy risk in this cycle:
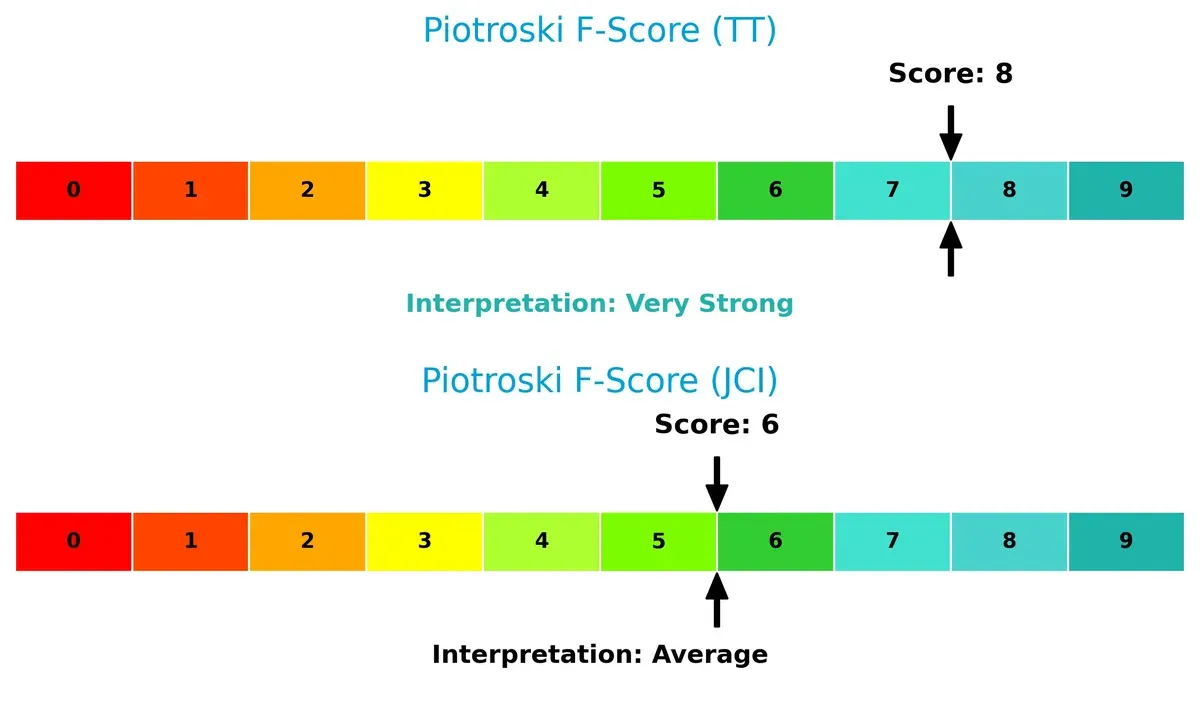
Financial Health: Quality of Operations
Trane Technologies scores an impressive 8 on the Piotroski F-Score, reflecting very strong internal financial health and operational efficiency. Johnson Controls, with a 6, shows average strength but potential red flags in internal metrics compared to its peer:
How are the two companies positioned?
This section dissects TT and JCI’s operational DNA by comparing their revenue distribution and internal dynamics. The goal is to confront their economic moats to reveal which model delivers the most resilient, sustainable competitive advantage today.
Revenue Segmentation: The Strategic Mix
This visual comparison dissects how Trane Technologies and Johnson Controls diversify their income streams and where their primary sector bets lie:
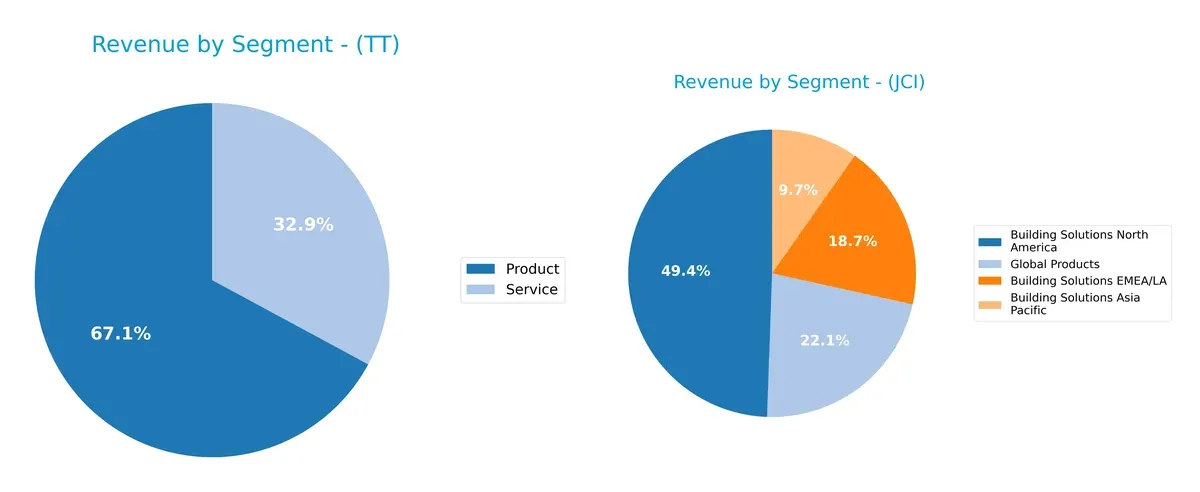
Trane Technologies anchors revenue in two clear segments: Products at $13.3B and Services at $6.5B, showing moderate diversification. Johnson Controls exhibits a broader regional and product mix, with Building Solutions North America dominating at $11.3B but supported by strong contributions from EMEA/LA ($4.3B), Asia Pacific ($2.2B), and Global Products ($5.1B). Johnson Controls’ diversified geographic footprint mitigates concentration risk, unlike Trane’s tighter product-service focus.
Strengths and Weaknesses Comparison
This table compares the strengths and weaknesses of Trane Technologies plc (TT) and Johnson Controls International plc (JCI):
TT Strengths
- Strong profitability with 13.7% net margin and 33.9% ROE
- Favorable ROIC at 20.3%, well above WACC
- Low debt-to-assets at 21.6% and high interest coverage at 17.2x
- Diversified revenue from Products and Services segments
- Growing Americas revenue dominance with solid EMEA and Asia Pacific presence
JCI Strengths
- Favorable interest coverage at 7.2x supports debt servicing
- Diverse geographic footprint with strong US and Asia Pacific sales
- Balanced product mix across Building Solutions and Global Products
- High fixed asset turnover at 10.8 indicates efficient asset use
- Moderate dividend yield at 1.36% supports income investors
TT Weaknesses
- High valuation multiples with PE at 29.8 and PB at 10.1
- Dividend yield is low at 0.96%, limiting income appeal
- Neutral liquidity metrics with current ratio 1.25 and quick ratio 0.92
- Asset turnover at 1.0 is only average, limiting revenue efficiency
JCI Weaknesses
- Lower profitability with 7.3% net margin and 13.3% ROE
- PE ratio is elevated at 41.6, potentially overvalued
- Weak liquidity with current ratio 0.93 and quick ratio 0.76, raising short-term risk
- Debt-to-assets higher at 26.0%, increasing leverage concerns
Both companies show diversified revenue streams and global reach. TT’s superior profitability and capital efficiency contrast with JCI’s weaker margins and liquidity. TT faces valuation and income yield challenges, while JCI’s financial structure and profitability metrics warrant caution in capital allocation.
The Moat Duel: Analyzing Competitive Defensibility
A structural moat protects long-term profits from the relentless erosion of competition. For Trane Technologies and Johnson Controls, the moat story is:
Trane Technologies plc: Durable Value Creator with Operational Excellence
Trane Technologies’ moat stems from cost advantage and strong brand power, reflected in a 10.99% ROIC premium over WACC and 18.3% EBIT margin. Its expanding product line in HVAC and refrigeration deepens this moat in 2026.
Johnson Controls International plc: Innovation-Driven but Value-Challenged
Johnson Controls relies on intangible assets and integrated smart building solutions, showing steady ROIC growth but a negative spread versus WACC, signaling value destruction. Growth in software-driven energy efficiency offers upside if profitability stabilizes.
Operational Cost Leadership vs. Innovation Ambition
Trane Technologies boasts a wider and deeper moat with sustained value creation and margin stability. Johnson Controls shows promise but currently lacks the financial robustness to defend market share as effectively.
Which stock offers better returns?
The past year shows strong price gains for both stocks, with Trane Technologies decelerating after a robust rise, while Johnson Controls also slows despite higher overall growth.
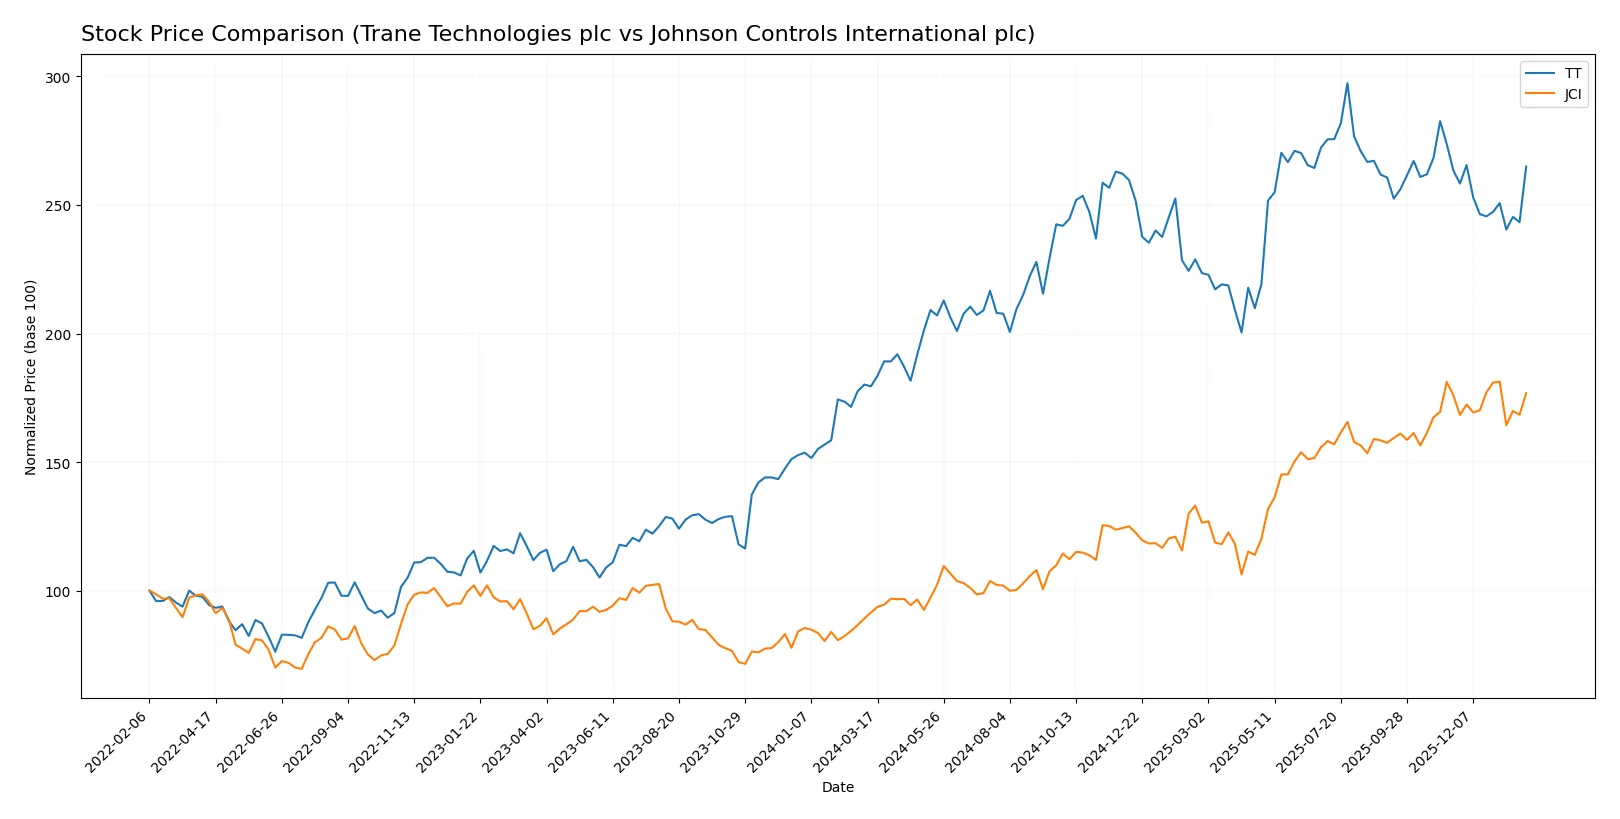
Trend Comparison
Trane Technologies rose 47.65% over 12 months, marking a bullish trend with decelerating momentum. It hit a high of 472.07 and a low of 284.85 during this period.
Johnson Controls gained 93.2% over the same span, also bullish with deceleration. Its volatility was lower, ranging between 61.73 and 122.31 in price.
Johnson Controls outperformed Trane Technologies, delivering nearly double the market returns while maintaining steadier recent price stability.
Target Prices
Analysts present a balanced target consensus for Trane Technologies plc and Johnson Controls International plc.
| Company | Target Low | Target High | Consensus |
|---|---|---|---|
| Trane Technologies plc | 370 | 520 | 475 |
| Johnson Controls International plc | 124 | 148 | 134 |
The target consensus for Trane Technologies at 475 exceeds its current price of 421, signaling upside potential. Johnson Controls’ consensus target of 134 also surpasses its current 119 price, suggesting room for growth.

Don’t Let Luck Decide Your Entry Point
Optimize your entry points with our advanced ProRealTime indicators. You’ll get efficient buy signals with precise price targets for maximum performance. Start outperforming now!
How do institutions grade them?
Trane Technologies plc Grades
The table below summarizes recent grades by major financial institutions for Trane Technologies plc.
| Grading Company | Action | New Grade | Date |
|---|---|---|---|
| JP Morgan | Maintain | Neutral | 2026-01-30 |
| Wells Fargo | Maintain | Underweight | 2026-01-30 |
| Oppenheimer | Maintain | Outperform | 2026-01-30 |
| RBC Capital | Maintain | Sector Perform | 2026-01-30 |
| Citigroup | Maintain | Buy | 2026-01-30 |
| Barclays | Maintain | Overweight | 2026-01-30 |
| Oppenheimer | Upgrade | Outperform | 2026-01-20 |
| Morgan Stanley | Maintain | Overweight | 2026-01-13 |
| Barclays | Maintain | Overweight | 2026-01-07 |
| UBS | Maintain | Buy | 2026-01-05 |
Johnson Controls International plc Grades
The following table presents recent grading data for Johnson Controls International plc from reputable firms.
| Grading Company | Action | New Grade | Date |
|---|---|---|---|
| Morgan Stanley | Maintain | Overweight | 2026-01-13 |
| Barclays | Maintain | Equal Weight | 2026-01-07 |
| Goldman Sachs | Maintain | Buy | 2025-11-07 |
| Argus Research | Maintain | Buy | 2025-11-07 |
| Wells Fargo | Maintain | Overweight | 2025-11-06 |
| Barclays | Maintain | Equal Weight | 2025-11-06 |
| RBC Capital | Maintain | Sector Perform | 2025-11-06 |
| Mizuho | Maintain | Neutral | 2025-11-06 |
| JP Morgan | Maintain | Overweight | 2025-10-15 |
| Citigroup | Maintain | Neutral | 2025-10-09 |
Which company has the best grades?
Trane Technologies holds a stronger consensus with multiple Buy and Outperform ratings, while Johnson Controls leans toward Overweight and Equal Weight. This suggests investors might perceive Trane as having slightly higher growth potential or market confidence.
Risks specific to each company
The following categories identify critical pressure points and systemic threats facing Trane Technologies plc and Johnson Controls International plc in the 2026 market environment:
1. Market & Competition
Trane Technologies plc
- Strong net margin (13.69%) supports competitive positioning. Faces pressure from innovation demands.
Johnson Controls International plc
- Lower net margin (7.29%) indicates weaker profitability; intense competition in building solutions market.
2. Capital Structure & Debt
Trane Technologies plc
- Moderate debt-to-equity (0.54) with strong interest coverage (17.17). Solid balance sheet.
Johnson Controls International plc
- Slightly higher leverage (0.76 debt-to-equity) but interest coverage remains adequate (7.17).
3. Stock Volatility
Trane Technologies plc
- Beta at 1.216 suggests moderate volatility relative to market.
Johnson Controls International plc
- Higher beta of 1.424 signals greater stock price swings and investor risk.
4. Regulatory & Legal
Trane Technologies plc
- Exposure to environmental regulations on refrigerants and emissions.
Johnson Controls International plc
- Faces regulatory scrutiny on energy efficiency and fire safety standards globally.
5. Supply Chain & Operations
Trane Technologies plc
- Global supply chain complexity may cause disruptions amid geopolitical tensions.
Johnson Controls International plc
- Larger employee base (94K vs. 45K) adds operational complexity and risk of inefficiencies.
6. ESG & Climate Transition
Trane Technologies plc
- Strong product focus on energy-efficient HVAC and refrigeration solutions supports ESG credentials.
Johnson Controls International plc
- Investing in smart building technologies but slower margin improvement may impact ESG investment returns.
7. Geopolitical Exposure
Trane Technologies plc
- Moderate exposure due to diversified global operations, especially in Europe and Americas.
Johnson Controls International plc
- Higher geopolitical risk from broader international footprint, including Asia Pacific markets.
Which company shows a better risk-adjusted profile?
Trane Technologies confronts competitive and supply chain risks but benefits from stronger profitability, balance sheet strength, and lower stock volatility. Johnson Controls faces higher market volatility and weaker liquidity ratios. Trane’s Altman Z-Score (6.11) signals robust financial health versus Johnson Controls’ moderate 2.51 score. Trane’s solid interest coverage and favorable margins justify confidence despite market pressures. Johnson Controls’ weaker liquidity ratios (current ratio 0.93) raise caution amid operational scale. Overall, Trane Technologies offers a better risk-adjusted profile given superior financial stability and moderate leverage.
Final Verdict: Which stock to choose?
Trane Technologies (TT) stands out as a cash-generating powerhouse with a durable competitive advantage. Its strong ROIC well above WACC signals efficient capital use and value creation. A point of vigilance remains its lofty valuation multiples. TT suits aggressive growth portfolios seeking robust profitability and resilience.
Johnson Controls (JCI) offers a strategic moat rooted in steady operational cash flow and recurring revenue streams. While it displays less financial strength than TT, JCI provides comparatively better dividend yield and a more moderate valuation profile. It fits well within growth-at-a-reasonable-price (GARP) portfolios seeking stability with upside potential.
If you prioritize sustained value creation and high returns on invested capital, Trane Technologies outshines as the compelling choice due to its superior profitability and moat durability. However, if you seek more conservative growth with enhanced income and valuation discipline, Johnson Controls offers better stability as a balanced investment scenario.
Disclaimer: Investment carries a risk of loss of initial capital. The past performance is not a reliable indicator of future results. Be sure to understand risks before making an investment decision.
Go Further
I encourage you to read the complete analyses of Trane Technologies plc and Johnson Controls International plc to enhance your investment decisions: