Johnson Controls International plc (JCI) and Masco Corporation (MAS) are two prominent players in the construction industry, each with a distinct focus on building products and solutions. JCI specializes in building management systems and energy efficiency, while MAS leads in home improvement and decorative architectural products. This comparison explores their market strategies and innovation approaches to help you identify which company aligns best with your investment goals.
Table of contents
Companies Overview
I will begin the comparison between Johnson Controls International plc and Masco Corporation by providing an overview of these two companies and their main differences.
Johnson Controls International plc Overview
Johnson Controls International plc operates globally in the construction industry, focusing on engineering, manufacturing, and servicing building products and systems. Its offerings include HVAC, fire and security systems, energy efficiency solutions, and smart building technologies. Headquartered in Cork, Ireland, JCI serves commercial, industrial, retail, and government clients with a workforce of 94,000 employees.
Masco Corporation Overview
Masco Corporation, based in Livonia, Michigan, designs and manufactures home improvement and building products primarily for North America and Europe. Its product range covers plumbing fixtures, decorative architectural products, and lighting solutions sold under various well-known brands. With 18,000 employees, MAS targets wholesalers, retailers, and distributors in the plumbing, hardware, and building supply sectors.
Key similarities and differences
Both JCI and MAS operate in the construction sector with a focus on building products but serve different niches. JCI emphasizes integrated building management systems and energy efficiency, while MAS specializes in plumbing, decorative hardware, and lighting products. JCI has a significantly larger workforce and global presence, whereas MAS concentrates on product manufacturing and distribution mainly in North America and Europe.
Income Statement Comparison
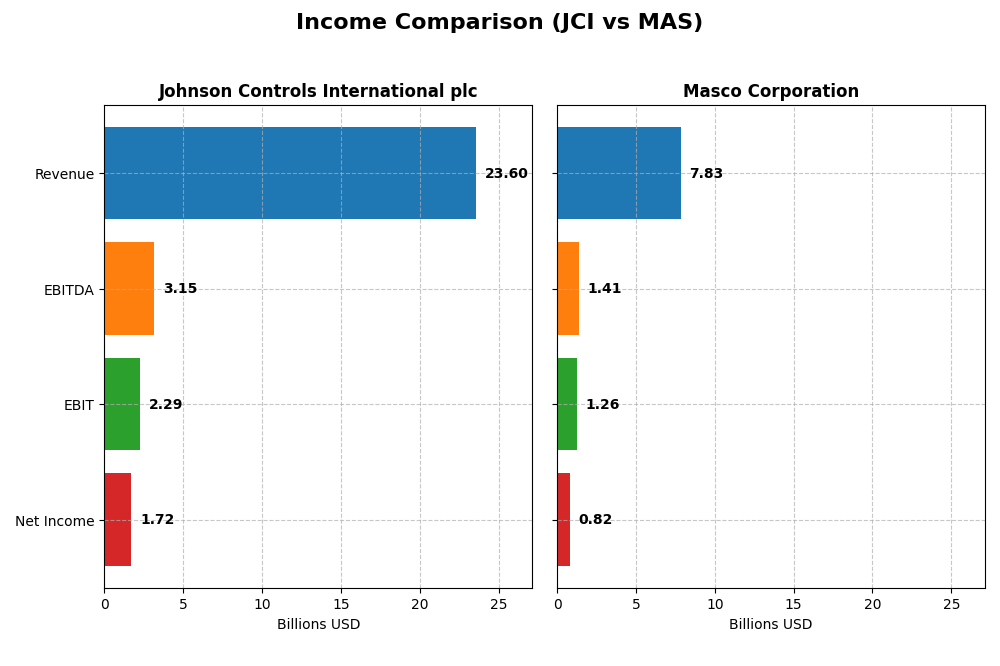
The table below compares the latest full fiscal year income statement metrics for Johnson Controls International plc and Masco Corporation, providing key financial figures to assess their recent performance.
| Metric | Johnson Controls International plc (JCI) | Masco Corporation (MAS) |
|---|---|---|
| Market Cap | 72.8B | 13.9B |
| Revenue | 23.6B | 7.8B |
| EBITDA | 3.15B | 1.41B |
| EBIT | 2.29B | 1.26B |
| Net Income | 1.72B | 822M |
| EPS | 2.64 | 3.77 |
| Fiscal Year | 2025 | 2024 |
Income Statement Interpretations
Johnson Controls International plc
Johnson Controls showed a mixed revenue trend from 2021 to 2025, with a slight overall decline of 0.3%, while net income grew by 5.13%. Gross margin remained favorable at 36.41%, and net margin was strong at 7.29%. In 2025, revenue growth slowed to 2.81%, but gross profit and EBIT margins improved, indicating efficient cost management despite a slight net margin contraction.
Masco Corporation
Masco experienced an overall revenue growth of 8.9% during 2020-2024 but faced a net income decline of 32.84%. Margins were generally favorable, with a gross margin of 36.17% and a strong EBIT margin of 16.1%. However, in 2024, all growth metrics turned unfavorable, including a 1.74% revenue drop and a 7.86% net margin decrease, signaling recent operational challenges.
Which one has the stronger fundamentals?
Johnson Controls demonstrates stronger fundamentals, supported by a favorable global income statement opinion and consistent net income growth, despite flat revenue. Masco’s unfavorable global evaluation and sharp net income decline over the period contrast with its margin strengths. Johnson Controls’ improved profitability and margin stability position it more favorably on these financial metrics.
Financial Ratios Comparison
The table below presents a side-by-side comparison of key financial ratios for Johnson Controls International plc (JCI) and Masco Corporation (MAS) based on the most recent fiscal year data available.
| Ratios | Johnson Controls International plc (JCI) FY 2025 | Masco Corporation (MAS) FY 2024 |
|---|---|---|
| ROE | 13.3% | -2.94% |
| ROIC | 8.75% | 29.3% |
| P/E | 41.6 | 19.2 |
| P/B | 5.54 | -56.5 |
| Current Ratio | 0.93 | 1.75 |
| Quick Ratio | 0.76 | 1.15 |
| D/E (Debt-to-Equity) | 0.76 | -11.5 |
| Debt-to-Assets | 26.0% | 64.1% |
| Interest Coverage | 8.87 | 13.8 |
| Asset Turnover | 0.62 | 1.56 |
| Fixed Asset Turnover | 10.76 | 5.81 |
| Payout Ratio | 56.7% | 30.9% |
| Dividend Yield | 1.36% | 1.61% |
Interpretation of the Ratios
Johnson Controls International plc
Johnson Controls International plc presents a mix of ratio strengths and weaknesses. Key concerns include an unfavorable price-to-earnings (PE) ratio of 41.64, price-to-book (PB) of 5.54, and liquidity ratios below 1, signaling potential short-term solvency issues. However, debt-to-assets at 26.04% and interest coverage of 7.17 are favorable, showing manageable leverage and debt service ability. The dividend yield is moderate at 1.36%, reflecting stable shareholder returns without evident payout risks.
Masco Corporation
Masco Corporation shows mostly favorable ratios with a strong net margin of 10.5% and return on invested capital (ROIC) of 29.3%, indicating efficient capital use. Liquidity ratios are robust, with a current ratio of 1.75 and quick ratio of 1.15. However, a highly negative return on equity (-293.57%) raises concerns about profitability relative to equity. The dividend yield stands at 1.61%, with no apparent risks noted in payout sustainability or buybacks.
Which one has the best ratios?
Masco Corporation exhibits a more favorable overall ratio profile with 64.29% favorable metrics, especially strong profitability and liquidity, despite the negative ROE. Johnson Controls shows a balanced but slightly unfavorable profile, with significant concerns over valuation and liquidity ratios. The contrast highlights Masco’s stronger operational efficiency against Johnson Controls’ cautionary valuation and solvency signals.
Strategic Positioning
This section compares the strategic positioning of Johnson Controls International plc and Masco Corporation in terms of market position, key segments, and exposure to technological disruption:
Johnson Controls International plc
- Large market cap of 73B with global presence in building systems; faces competitive pressure in construction industry.
- Diversified segments include Building Solutions and Global Products, driving revenue from HVAC, controls, fire protection, and smart building solutions.
- Exposure to technological disruption through integration of controls software and smart building solutions in industrial and commercial applications.
Masco Corporation
- Smaller market cap of 14B focused on North America and international home improvement markets; competes in plumbing and decorative products.
- Key business drivers are Plumbing Products and Decorative Architectural Products, emphasizing faucets, coatings, hardware, and lighting.
- Limited explicit exposure to technological disruption; focus remains on traditional manufacturing and distribution of home improvement products.
Johnson Controls International plc vs Masco Corporation Positioning
Johnson Controls shows a diversified global approach with multiple building solutions segments, while Masco concentrates on plumbing and decorative products primarily in North America. Johnson Controls leverages technology integration, whereas Masco emphasizes product brands and distribution channels.
Which has the best competitive advantage?
Masco demonstrates a very favorable moat with ROIC exceeding WACC by over 20%, indicating durable competitive advantage and increasing profitability. Johnson Controls shows a slightly unfavorable moat, shedding value though with a growing ROIC trend.
Stock Comparison
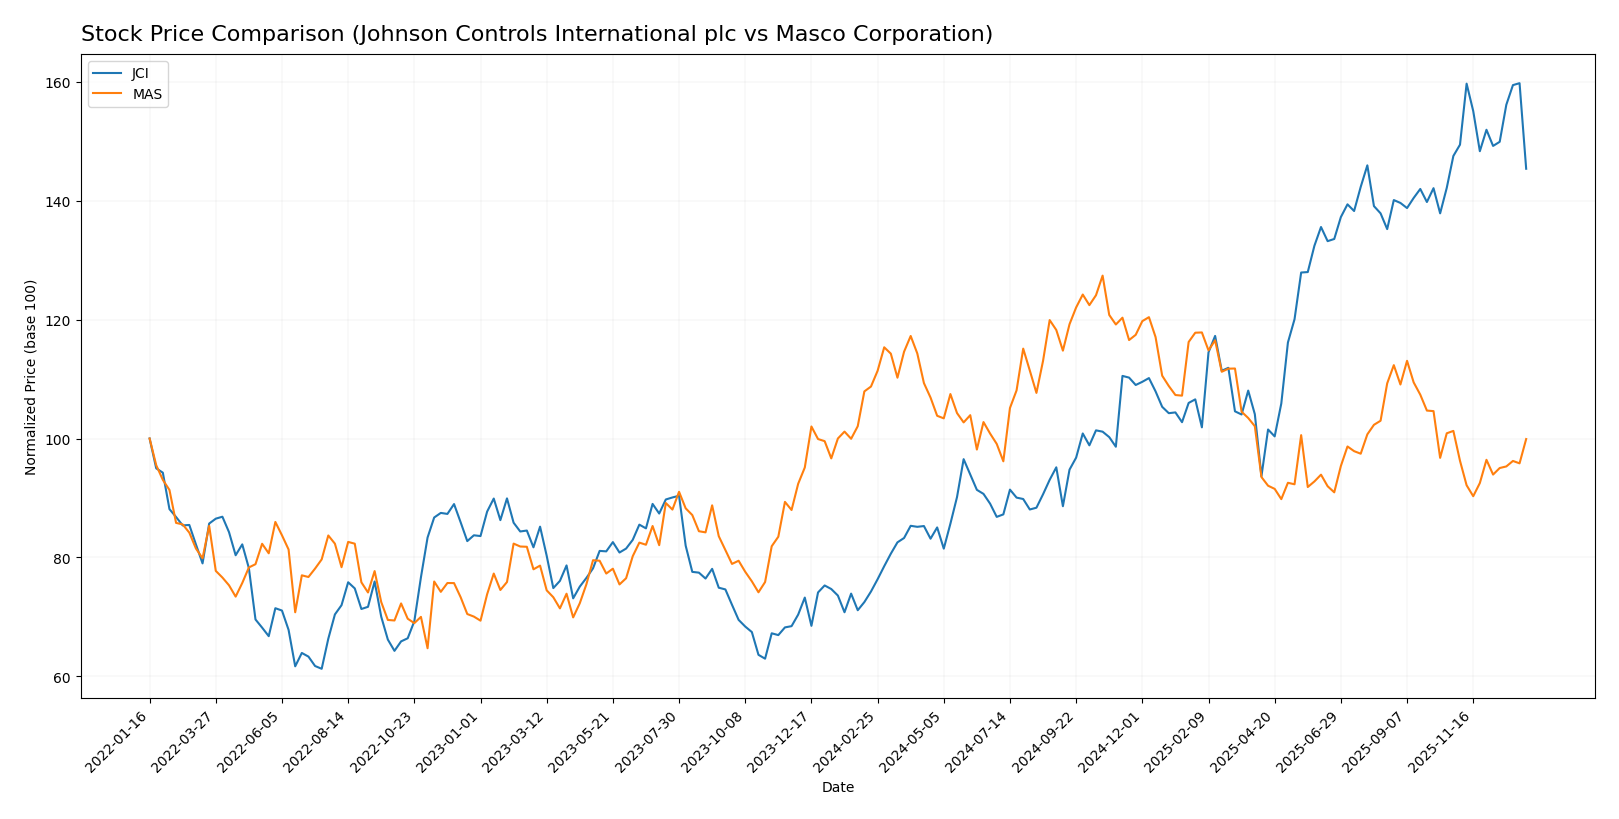
The past year showed significant price movements for Johnson Controls International plc and Masco Corporation, with JCI experiencing a strong bullish run while MAS faced a bearish decline, reflecting contrasting trading dynamics.
Trend Analysis
Johnson Controls International plc (JCI) exhibited a bullish trend over the past 12 months with a 95.73% price increase, though this growth showed deceleration. The stock fluctuated between a low of 56.86 and a high of 122.31, with notable volatility at 18.47 std deviation.
Masco Corporation (MAS) experienced a bearish trend over the same period, with an 8.12% price decrease and accelerating decline. The stock ranged from 60.42 to 85.71, showing moderate volatility with a 6.54 std deviation.
Comparing both stocks, JCI delivered the highest market performance with a substantial positive price change, while MAS trended downward, reflecting weaker investor sentiment.
Target Prices
Analysts present a clear consensus on the target prices for Johnson Controls International plc and Masco Corporation.
| Company | Target High | Target Low | Consensus |
|---|---|---|---|
| Johnson Controls International plc | 148 | 124 | 134.75 |
| Masco Corporation | 84 | 73 | 77.83 |
The target consensus for Johnson Controls International plc is significantly above its current price of 111.29 USD, suggesting potential upside. Masco Corporation’s consensus target at 77.83 USD also indicates room for growth compared to its current price of 67.22 USD.
Analyst Opinions Comparison
This section compares analysts’ ratings and grades for Johnson Controls International plc (JCI) and Masco Corporation (MAS):
Rating Comparison
JCI Rating
- Rating: B-, considered very favorable by analysts.
- Discounted Cash Flow Score: 3, moderate valuation signal.
- Return on Equity Score: 4, favorable efficiency in profit generation.
- Return on Assets Score: 3, moderate asset utilization.
- Debt To Equity Score: 2, moderate financial risk.
- Overall Score: 2, moderate overall financial standing.
MAS Rating
- Rating: B-, also considered very favorable.
- Discounted Cash Flow Score: 3, moderate valuation signal.
- Return on Equity Score: 1, very unfavorable profit efficiency.
- Return on Assets Score: 5, very favorable asset utilization.
- Debt To Equity Score: 1, very unfavorable financial risk.
- Overall Score: 2, moderate overall financial standing.
Which one is the best rated?
Both JCI and MAS share the same overall rating of B- and overall score of 2, indicating a moderate financial standing. JCI shows stronger return on equity and better debt management, while MAS excels in return on assets but has weaker debt and equity metrics.
Scores Comparison
Here is a comparison of the Altman Z-Score and Piotroski Score for Johnson Controls International plc (JCI) and Masco Corporation (MAS):
JCI Scores
- Altman Z-Score: 2.71, in the grey zone, indicating moderate bankruptcy risk.
- Piotroski Score: 6, categorized as average financial strength.
MAS Scores
- Altman Z-Score: 3.91, in the safe zone, indicating low bankruptcy risk.
- Piotroski Score: 6, categorized as average financial strength.
Which company has the best scores?
MAS has a higher Altman Z-Score (3.91) in the safe zone compared to JCI’s 2.71 in the grey zone. Both have the same Piotroski Score of 6, indicating average financial strength. MAS shows stronger bankruptcy safety.
Grades Comparison
Here is a comparison of the recent grades assigned to Johnson Controls International plc and Masco Corporation by various reputable grading companies:
Johnson Controls International plc Grades
The following table summarizes recent grades from verified financial institutions for Johnson Controls International plc:
| Grading Company | Action | New Grade | Date |
|---|---|---|---|
| Barclays | Maintain | Equal Weight | 2026-01-07 |
| Goldman Sachs | Maintain | Buy | 2025-11-07 |
| Argus Research | Maintain | Buy | 2025-11-07 |
| RBC Capital | Maintain | Sector Perform | 2025-11-06 |
| Wells Fargo | Maintain | Overweight | 2025-11-06 |
| Mizuho | Maintain | Neutral | 2025-11-06 |
| Barclays | Maintain | Equal Weight | 2025-11-06 |
| JP Morgan | Maintain | Overweight | 2025-10-15 |
| Citigroup | Maintain | Neutral | 2025-10-09 |
| Morgan Stanley | Maintain | Overweight | 2025-08-21 |
Overall, Johnson Controls International plc has consistently received a mix of Buy, Overweight, and Neutral ratings, indicating a generally positive but cautious outlook from analysts.
Masco Corporation Grades
Below are the recent grades from recognized analysts for Masco Corporation:
| Grading Company | Action | New Grade | Date |
|---|---|---|---|
| Wells Fargo | Upgrade | Overweight | 2025-12-15 |
| Barclays | Downgrade | Equal Weight | 2025-12-08 |
| Argus Research | Maintain | Buy | 2025-11-05 |
| Barclays | Maintain | Overweight | 2025-10-30 |
| Wells Fargo | Maintain | Equal Weight | 2025-10-30 |
| RBC Capital | Maintain | Sector Perform | 2025-10-30 |
| Evercore ISI Group | Maintain | In Line | 2025-10-30 |
| UBS | Maintain | Buy | 2025-10-30 |
| Wells Fargo | Maintain | Equal Weight | 2025-09-11 |
| Oppenheimer | Maintain | Outperform | 2025-08-04 |
Masco Corporation’s grades show a mix of Buy, Overweight, and Equal Weight ratings, with some recent upgrades and downgrades reflecting a somewhat mixed but generally favorable analyst sentiment.
Which company has the best grades?
Both Johnson Controls International plc and Masco Corporation hold a consensus “Buy” rating among analysts, but Johnson Controls has a larger number of Buy ratings (28 vs. 21) and fewer Sell ratings than Masco, which has 2 Sell ratings. This suggests Johnson Controls may be viewed with slightly more confidence, which could influence investor perception and trading decisions regarding risk and potential returns.
Strengths and Weaknesses
Below is a comparison table of key strengths and weaknesses for Johnson Controls International plc (JCI) and Masco Corporation (MAS) based on the latest financial and strategic data.
| Criterion | Johnson Controls International plc (JCI) | Masco Corporation (MAS) |
|---|---|---|
| Diversification | Broad product range including building solutions and global products, but regional revenue varies significantly. | Focused mainly on decorative architectural and plumbing products with less geographic diversification. |
| Profitability | Neutral net margin at 7.29%, moderate ROIC at 8.75%, but slightly unfavorable valuation multiples and liquidity ratios. | Higher net margin at 10.5%, strong ROIC at 29.3%, favorable valuation and liquidity ratios, despite negative ROE. |
| Innovation | Moderate innovation implied by steady ROIC growth and product turnover, but no strong moat advantage. | Strong innovation and competitive edge reflected by very favorable moat status and growing ROIC trend. |
| Global presence | Significant presence in North America, EMEA/Latin America, and Asia Pacific with over $22B revenue in 2024. | Primarily US-focused with revenue around $7.8B, less global reach but solid market penetration. |
| Market Share | Large market share in building solutions and global products sectors, but value destruction indicates challenges. | Durable competitive advantage with value creation and growing profitability, indicating strong market position. |
Key takeaways: Masco Corporation shows a stronger competitive moat, higher profitability, and better financial health compared to Johnson Controls. JCI’s diversification and global reach are strengths, but its current value destruction and liquidity concerns warrant caution. Investors prioritizing durable value creation may favor MAS.
Risk Analysis
Below is a comparative overview of key risk factors for Johnson Controls International plc (JCI) and Masco Corporation (MAS) based on the most recent data available.
| Metric | Johnson Controls International plc (JCI) | Masco Corporation (MAS) |
|---|---|---|
| Market Risk | Beta 1.424, indicating higher volatility relative to the market | Beta 1.277, moderately volatile |
| Debt Level | Debt-to-assets 26.04% (favorable), Debt-to-equity moderate risk | Debt-to-assets 64.07% (unfavorable), negative debt-to-equity suggesting complex capital structure |
| Regulatory Risk | Moderate, operating globally with exposure to building and energy regulations | Moderate, exposure to home improvement and manufacturing regulations |
| Operational Risk | Large global footprint (94K employees) with diverse product segments | Smaller scale (18K employees), focused on plumbing and decorative products |
| Environmental Risk | Exposure to energy efficiency trends and sustainability pressures | Exposure to material sourcing and manufacturing emissions |
| Geopolitical Risk | Operations across US, Europe, Asia Pacific; sensitive to international trade policies | Primarily North America-focused, less exposed internationally |
The most impactful risks for JCI stem from its higher market volatility and operational complexity across global markets, while MAS faces significant financial risk due to its high debt levels. Both companies operate in regulated industries with moderate exposure to environmental and geopolitical challenges. Recent financials suggest MAS’s leverage is a critical consideration for risk-averse investors.
Which Stock to Choose?
Johnson Controls International plc (JCI) shows a generally favorable income statement with good gross and net margins, moderate profitability metrics, and manageable debt levels. Its financial ratios present a slightly unfavorable picture due to high valuation multiples and weak liquidity, while its rating remains very favorable overall.
Masco Corporation (MAS) displays favorable financial ratios and strong returns on invested capital, despite negative return on equity and elevated debt-to-assets ratio. Its income statement is globally unfavorable, reflecting declining margins and earnings, yet the company benefits from a very favorable rating and solid liquidity.
Investors with a growth orientation might find MAS attractive for its high ROIC and favorable financial ratios, despite income challenges, whereas those prioritizing stability and consistent income quality may lean toward JCI, given its favorable income trends and moderate profitability despite valuation concerns.
Disclaimer: Investment carries a risk of loss of initial capital. The past performance is not a reliable indicator of future results. Be sure to understand risks before making an investment decision.
Go Further
I encourage you to read the complete analyses of Johnson Controls International plc and Masco Corporation to enhance your investment decisions: