Home > Comparison > Industrials > JCI vs LII
The strategic rivalry between Johnson Controls International plc and Lennox International Inc. shapes the Industrials sector’s competitive landscape. Johnson Controls operates as a diversified engineering and building solutions powerhouse with global reach. Lennox International specializes in high-margin heating, ventilation, and refrigeration equipment primarily across North America. This analysis explores their contrasting operational models and capital allocation to identify which company offers superior risk-adjusted returns for a diversified portfolio in 2026.
Table of contents
Companies Overview
Johnson Controls International and Lennox International both shape the global heating and cooling markets with robust industrial footprints.
Johnson Controls International plc: Global Building Solutions Leader
Johnson Controls International dominates with its comprehensive building systems spanning HVAC, controls, fire safety, and energy efficiency. Its revenue stems from engineering, manufacturing, and servicing integrated building technologies worldwide. In 2026, Johnson Controls sharpens its focus on smart building solutions and energy efficiency, targeting sustainable growth across commercial and industrial sectors.
Lennox International Inc.: Specialized HVAC Innovator
Lennox International carves its niche in residential and commercial heating and cooling systems. It generates revenue by designing, manufacturing, and marketing HVAC and refrigeration products mainly in North America. The company’s 2026 strategy emphasizes expanding its commercial heating and cooling segment alongside refrigeration solutions to capture light commercial markets and enhance product innovation.
Strategic Collision: Similarities & Divergences
Both firms compete in heating and cooling but differ sharply in scale and scope. Johnson Controls pursues a broad integrated systems approach, while Lennox focuses on specialized HVAC and refrigeration units. Their primary battleground is commercial building climate control. Investors face a choice between Johnson Controls’ diversified portfolio and Lennox’s focused market specialization—each carries distinct risk and growth profiles.
Income Statement Comparison
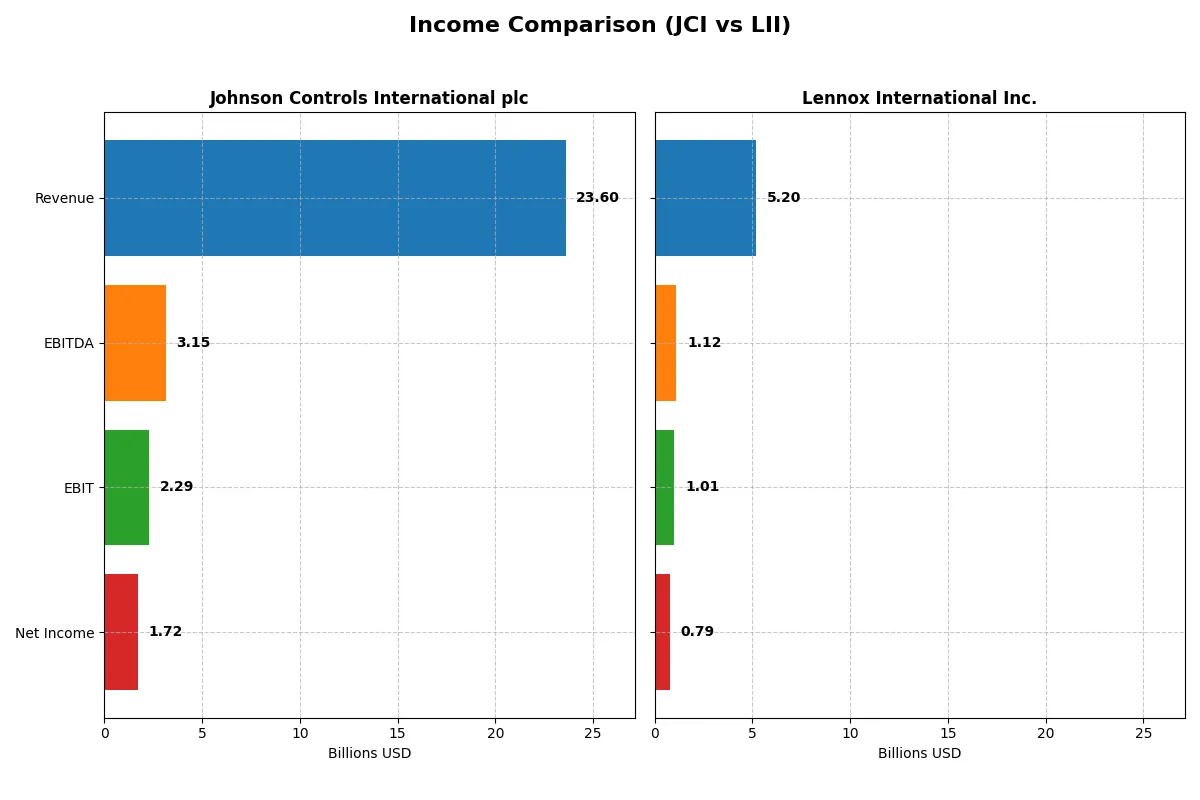
This data dissects the core profitability and scalability of both corporate engines to reveal who dominates the bottom line:
| Metric | Johnson Controls International plc (JCI) | Lennox International Inc. (LII) |
|---|---|---|
| Revenue | 23.6B | 5.2B |
| Cost of Revenue | 15.0B | 3.5B |
| Operating Expenses | 5.8B | 700M |
| Gross Profit | 8.6B | 1.7B |
| EBITDA | 3.2B | 1.1B |
| EBIT | 2.3B | 1.0B |
| Interest Expense | 319M | 41M |
| Net Income | 1.7B | 786M |
| EPS | 2.64 | 22.31 |
| Fiscal Year | 2025 | 2025 |
Income Statement Analysis: The Bottom-Line Duel
This comparison reveals which company converts revenue into profit more efficiently, highlighting operational strengths and margin dynamics.
Johnson Controls International plc Analysis
Johnson Controls shows a mostly stable revenue trajectory, peaking at $25.3B in 2022 and slightly declining afterward. Its gross margin remains healthy around 36%, reflecting solid cost control. The 2025 net income of $1.72B signals steady profitability despite a modest revenue growth of 2.8% last year. Operating expenses scale proportionally, supporting a consistent EBIT margin near 9.7%.
Lennox International Inc. Analysis
Lennox International posts a smaller revenue base, $5.2B in 2025, with a 2.7% decline from the prior year. It maintains a robust gross margin above 33% and an impressive EBIT margin of 19.5%, indicating superior operational efficiency. Net income grew substantially over five years to $786M in 2025, with a net margin of 15.1%, showcasing strong bottom-line momentum despite recent revenue headwinds.
Margin Strength vs. Scale and Stability
Johnson Controls leverages scale with steady revenue and consistent margins but shows limited growth last year. Lennox International offers higher profitability margins and stronger net income growth over five years, despite a smaller size and recent revenue softness. For investors, Lennox’s margin profile suggests higher efficiency, while Johnson Controls emphasizes scale and stability.
Financial Ratios Comparison
These vital ratios act as a diagnostic tool to expose the underlying fiscal health, valuation premiums, and capital efficiency of the companies compared:
| Ratios | Johnson Controls International plc (JCI) | Lennox International Inc. (LII) |
|---|---|---|
| ROE | 13.3% | 67.6% |
| ROIC | 8.8% | 25.5% |
| P/E | 41.6 | 21.6 |
| P/B | 5.54 | 14.57 |
| Current Ratio | 0.93 | 1.60 |
| Quick Ratio | 0.76 | 0.63 |
| D/E (Debt-to-Equity) | 0.76 | 1.77 |
| Debt-to-Assets | 26.0% | 50.6% |
| Interest Coverage | 8.87 | 24.8 |
| Asset Turnover | 0.62 | 1.27 |
| Fixed Asset Turnover | 10.76 | 4.18 |
| Payout ratio | 56.7% | 22.0% |
| Dividend yield | 1.36% | 1.02% |
| Fiscal Year | 2025 | 2025 |
Efficiency & Valuation Duel: The Vital Signs
Financial ratios form a company’s DNA, exposing hidden risks and operational strengths that shape investment decisions.
Johnson Controls International plc
Johnson Controls shows moderate profitability with a 13.3% ROE and neutral net margins at 7.3%. Its valuation appears stretched with a high P/E of 41.6 and P/B of 5.54. The company distributes a modest 1.36% dividend yield, balancing shareholder returns with reinvestment for steady operations.
Lennox International Inc.
Lennox delivers strong profitability, boasting a 67.6% ROE and 15.1% net margin, reflecting operational efficiency. Its P/E at 21.6 is reasonable, though the P/B stands high at 14.6. The firm maintains a 1.02% dividend yield, complementing robust cash flow and growth-focused capital allocation.
Premium Valuation vs. Operational Strength
Lennox offers superior profitability and a more balanced valuation, while Johnson Controls faces valuation premiums and moderate returns. Investors prioritizing operational excellence may lean toward Lennox. Those accepting valuation stretch for steady income might consider Johnson Controls.
Which one offers the Superior Shareholder Reward?
I see Johnson Controls International plc (JCI) delivers a 1.36% dividend yield with a 57% payout ratio, balancing dividends with steady buybacks. Lennox International Inc. (LII) posts a lower 1.02% yield and just 22% payout but drives superior buybacks, boosting total returns. JCI’s distribution is more traditional and sustainable, covering dividends almost fully by free cash flow. LII reinvests aggressively in buybacks and growth, riskier but with higher return potential. I judge JCI offers superior shareholder reward in 2026 due to a balanced, reliable payout and consistent buyback support.
Comparative Score Analysis: The Strategic Profile
The radar chart reveals the core financial DNA and strategic trade-offs of Johnson Controls International plc and Lennox International Inc.:
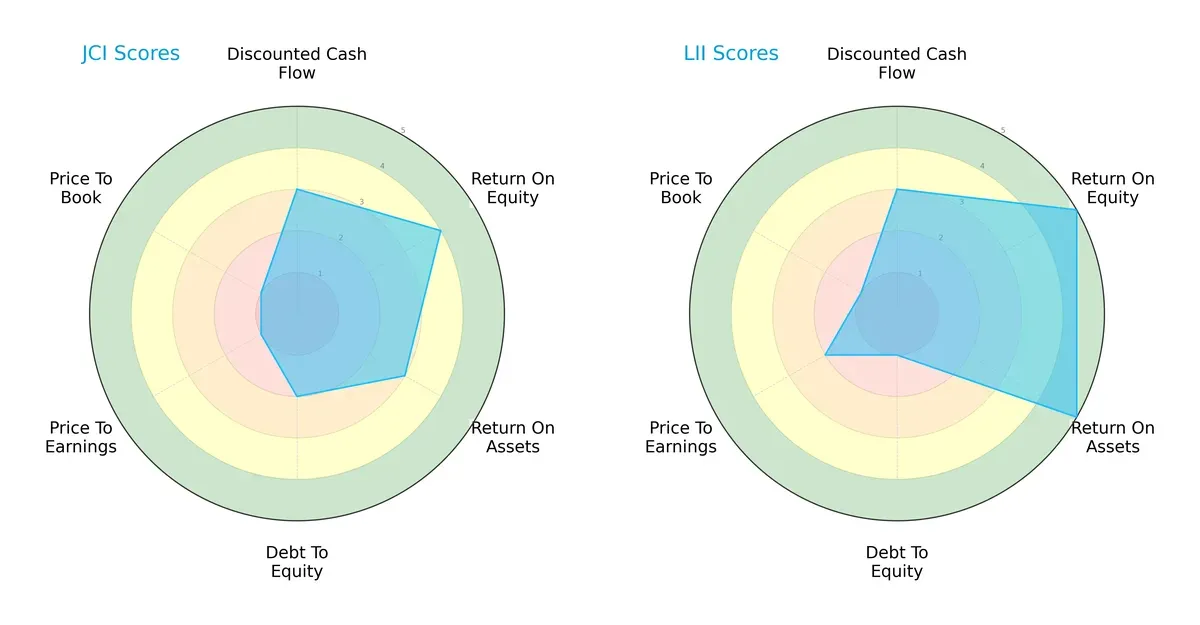
Lennox International excels with superior profitability, scoring 5 in ROE and ROA, compared to Johnson Controls’ moderate 4 and 3. Johnson Controls maintains a more conservative debt profile (Debt/Equity score 2 vs. 1), but Lennox’s edge in operational efficiency and valuation (PE score 2 vs. 1) suggests stronger growth potential. Johnson Controls shows weakness in valuation metrics, indicating potential overvaluation. Overall, Lennox presents a more balanced and robust financial profile, while Johnson Controls leans on debt discipline.
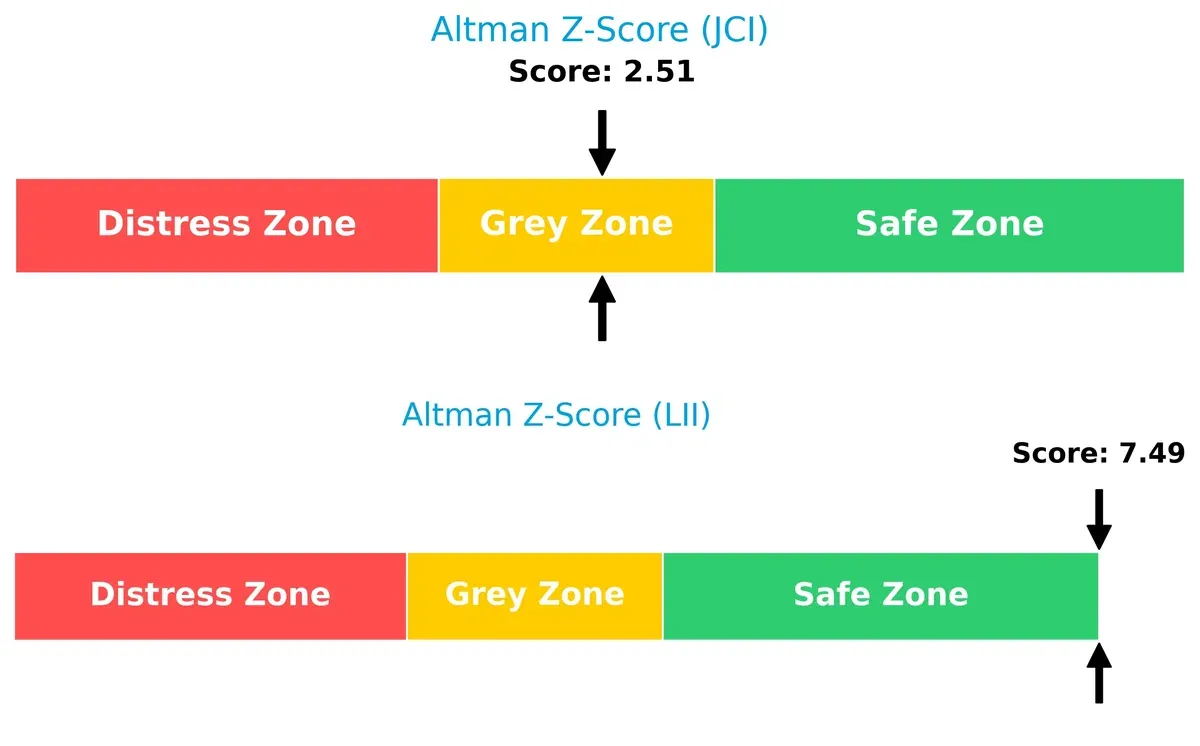
Bankruptcy Risk: Solvency Showdown
Lennox’s Altman Z-Score of 7.49 firmly places it in the safe zone, signaling strong resilience against bankruptcy. Johnson Controls, at 2.51, sits in the grey zone, indicating moderate risk and caution for long-term survival in this cycle:
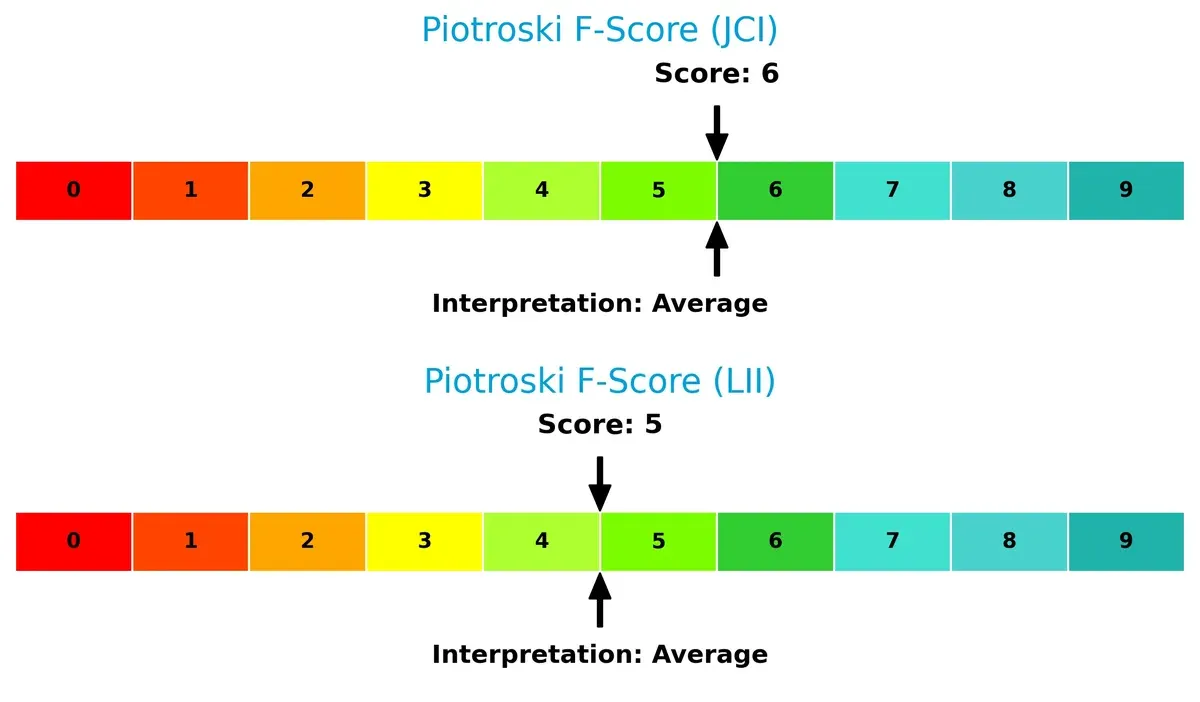
Financial Health: Quality of Operations
Johnson Controls scores 6, slightly ahead of Lennox’s 5 on the Piotroski F-Score scale. Both firms demonstrate average financial health, but Johnson Controls shows marginally stronger internal operational quality without glaring red flags:
How are the two companies positioned?
This section dissects the operational DNA of JCI and LII by comparing their revenue distribution by segment and internal dynamics. The final goal confronts their economic moats to identify the most resilient competitive advantage today.
Revenue Segmentation: The Strategic Mix
This visual comparison dissects how Johnson Controls International plc and Lennox International Inc. diversify their income streams and reveals their primary sector bets:
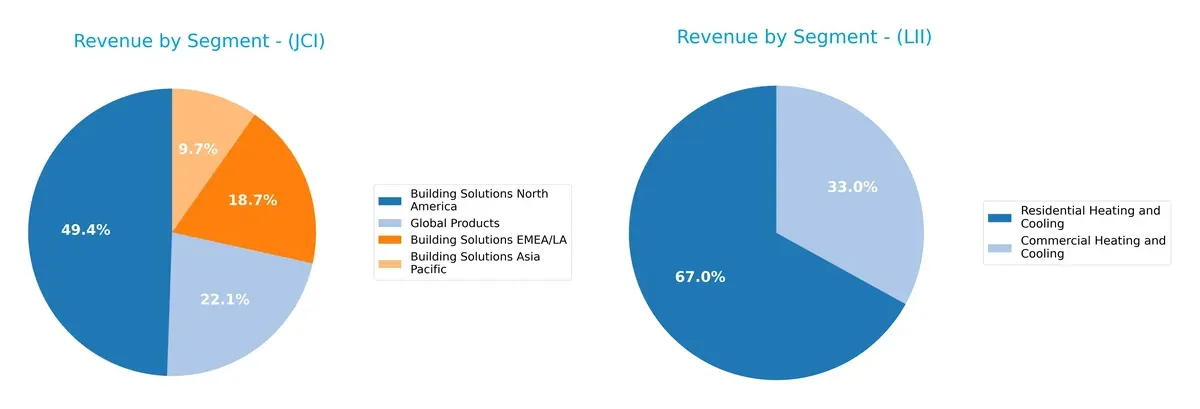
Johnson Controls anchors revenue in Building Solutions North America with $11.35B, dwarfing its Asia Pacific and EMEA/LA segments. Lennox pivots heavily on Residential Heating and Cooling at $3.58B, with Commercial Heating and Cooling trailing at $1.76B. Johnson Controls shows broader geographic diversification, reducing concentration risk. Lennox’s focus on residential HVAC creates potential vulnerability but also a strong market niche. This contrast highlights Johnson Controls’ ecosystem lock-in versus Lennox’s product specialization.
Strengths and Weaknesses Comparison
This table compares the Strengths and Weaknesses of Johnson Controls International plc (JCI) and Lennox International Inc. (LII):
JCI Strengths
- Diversified revenue streams across multiple global regions
- Favorable debt-to-assets ratio at 26%
- Strong interest coverage ratio of 7.17x
- High fixed asset turnover at 10.76 times
LII Strengths
- Superior profitability with net margin of 15.13% and ROE of 67.6%
- Favorable ROIC of 25.51% exceeding WACC
- Strong current ratio at 1.6 indicating liquidity
- High interest coverage at 24.74x
- Solid asset turnover of 1.27 times
JCI Weaknesses
- Unfavorable P/E of 41.64 and P/B of 5.54 indicating premium valuation
- Current and quick ratios below 1, signaling liquidity risk
- ROIC below WACC (8.75% vs 9.7%) suggesting value destruction
- Neutral profitability metrics with net margin at 7.29%
- Moderate leverage with D/E at 0.76
LII Weaknesses
- Unfavorable debt-to-assets at 50.57% with high leverage (D/E 1.77)
- Quick ratio of 0.63 below 1 indicating some liquidity concerns
- Elevated P/B of 14.57 suggesting possible overvaluation
- Net margin and ROE favorable but valuation may pressure returns in downturn
Overall, JCI presents a more diversified global footprint with solid asset efficiency and manageable leverage but faces valuation and liquidity challenges. LII delivers higher profitability and liquidity but carries heavier leverage and valuation risks that may constrain financial flexibility. Both companies’ strategic priorities will likely focus on balancing growth, profitability, and prudent capital structure management.
The Moat Duel: Analyzing Competitive Defensibility
A structural moat is the only reliable shield that protects long-term profits from relentless competitive pressure. Here’s how these two industrial giants compare:
Johnson Controls International plc: Integrated Building Solutions Moat
Johnson Controls leverages intangible assets and scale in building controls, reflected in stable gross margins near 36%. Its growing ROIC signals improving profitability, but value destruction warns of rising competition in 2026.
Lennox International Inc.: Premium HVAC Brand and Cost Advantage
Lennox’s moat rests on brand reputation and efficient capital use, delivering a robust 19.5% EBIT margin and ROIC well above WACC. Despite a recent ROIC decline, it sustains value creation, facing risks in expanding international markets.
Integrated Systems vs. Brand Power: Who Defends Better?
Johnson Controls shows improving profitability but fails to cover its cost of capital, indicating a shallower moat. Lennox creates clear value with superior ROIC, despite margin pressure. Lennox is better positioned to defend market share long term.
Which stock offers better returns?
The past year reveals contrasting price dynamics: Johnson Controls International’s stock surged sharply but slowed recently, while Lennox International’s price gained modestly with accelerating momentum.
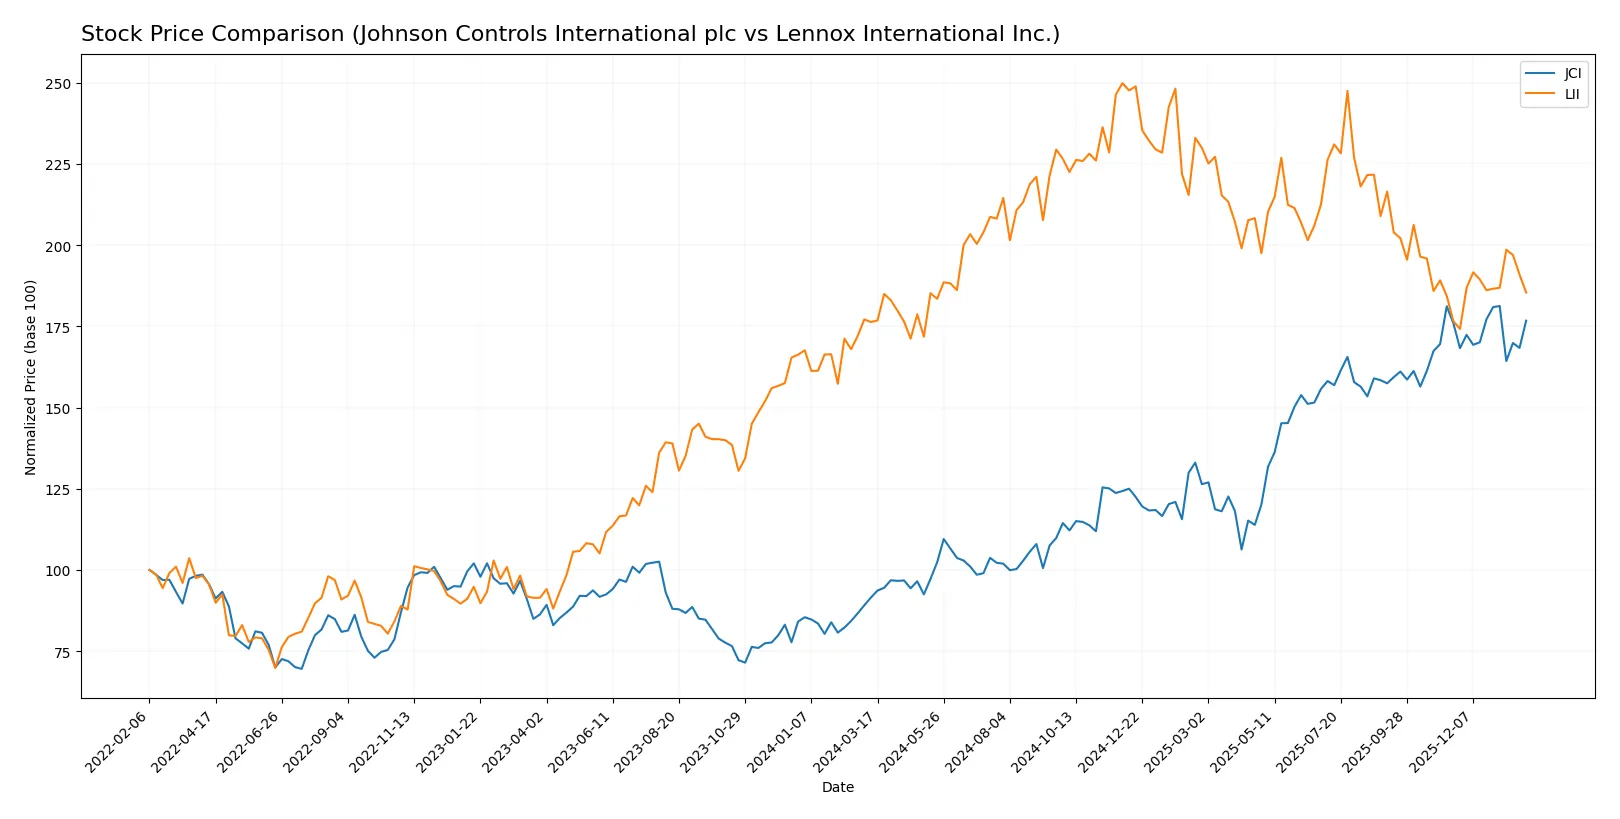
Trend Comparison
Johnson Controls International’s stock rose 93.2% over 12 months, marking a strong bullish trend with decelerating momentum and a volatility of 18.44. It peaked at 122.31 and troughed at 61.73.
Lennox International’s shares increased 5.17% over the same period, reflecting a mild bullish trend with accelerating gains and high volatility at 53.8. Its highest price reached 667.13, lowest 457.15.
Johnson Controls International’s trend outpaces Lennox International’s by a wide margin, delivering substantially higher returns despite decelerating momentum in recent months.
Target Prices
Analysts present a bullish consensus for Johnson Controls International plc and Lennox International Inc.
| Company | Target Low | Target High | Consensus |
|---|---|---|---|
| Johnson Controls International plc | 124 | 148 | 134 |
| Lennox International Inc. | 450 | 667 | 555 |
The consensus target for Johnson Controls is about 12% above its current 119 price, signaling moderate upside potential. Lennox’s consensus target exceeds its 495 price by roughly 12%, reflecting optimism despite recent market volatility.

Don’t Let Luck Decide Your Entry Point
Optimize your entry points with our advanced ProRealTime indicators. You’ll get efficient buy signals with precise price targets for maximum performance. Start outperforming now!
How do institutions grade them?
Johnson Controls International plc Grades
The following table summarizes recent institutional grades for Johnson Controls International plc:
| Grading Company | Action | New Grade | Date |
|---|---|---|---|
| Morgan Stanley | Maintain | Overweight | 2026-01-13 |
| Barclays | Maintain | Equal Weight | 2026-01-07 |
| Goldman Sachs | Maintain | Buy | 2025-11-07 |
| Argus Research | Maintain | Buy | 2025-11-07 |
| Wells Fargo | Maintain | Overweight | 2025-11-06 |
| Barclays | Maintain | Equal Weight | 2025-11-06 |
| RBC Capital | Maintain | Sector Perform | 2025-11-06 |
| Mizuho | Maintain | Neutral | 2025-11-06 |
| JP Morgan | Maintain | Overweight | 2025-10-15 |
| Citigroup | Maintain | Neutral | 2025-10-09 |
Lennox International Inc. Grades
The following table summarizes recent institutional grades for Lennox International Inc.:
| Grading Company | Action | New Grade | Date |
|---|---|---|---|
| Wells Fargo | Maintain | Equal Weight | 2026-01-29 |
| RBC Capital | Maintain | Sector Perform | 2026-01-29 |
| JP Morgan | Maintain | Underweight | 2026-01-16 |
| Barclays | Maintain | Overweight | 2026-01-07 |
| Barclays | Maintain | Overweight | 2025-12-11 |
| Wells Fargo | Maintain | Equal Weight | 2025-12-04 |
| Wolfe Research | Upgrade | Peer Perform | 2025-11-13 |
| UBS | Maintain | Neutral | 2025-10-27 |
| Morgan Stanley | Maintain | Underweight | 2025-10-23 |
| RBC Capital | Maintain | Sector Perform | 2025-10-23 |
Which company has the best grades?
Johnson Controls International plc consistently receives stronger ratings, including multiple “Buy” and “Overweight” grades. Lennox International Inc. shows more mixed ratings, with several “Underweight” and “Sector Perform” grades. This difference may influence investor perception of growth potential and risk.
Risks specific to each company
The following categories identify critical pressure points and systemic threats facing Johnson Controls International plc and Lennox International Inc. in the 2026 market environment:
1. Market & Competition
Johnson Controls International plc
- Operates globally with broad product lines, facing intense competition in building solutions and smart building tech.
Lennox International Inc.
- Focuses on HVAC and refrigeration in North America with strong niche positioning but limited geographic diversification.
2. Capital Structure & Debt
Johnson Controls International plc
- Moderate leverage (D/E 0.76), manageable debt-to-assets ratio (26%), and strong interest coverage (7.17x) indicate stable capital structure.
Lennox International Inc.
- High leverage (D/E 1.77), elevated debt-to-assets (50.6%), though strong interest coverage (24.7x) shows capacity to service debt but higher financial risk.
3. Stock Volatility
Johnson Controls International plc
- Beta 1.42 implies above-market volatility, exposing shareholders to higher risk in market downturns.
Lennox International Inc.
- Beta 1.18 reflects moderate volatility, slightly less sensitive to market swings than Johnson Controls.
4. Regulatory & Legal
Johnson Controls International plc
- Global operations expose it to diverse regulatory regimes, increasing compliance complexity and legal risk.
Lennox International Inc.
- Primarily US-focused, faces concentrated regulatory risks but benefits from clearer, consistent domestic policy environment.
5. Supply Chain & Operations
Johnson Controls International plc
- Global supply chain susceptible to disruptions; diverse segments require complex operational coordination.
Lennox International Inc.
- More concentrated supply chain in North America, potentially less exposed to geopolitical supply shocks but vulnerable to regional disruptions.
6. ESG & Climate Transition
Johnson Controls International plc
- Engages in energy efficiency and smart building solutions, aligning with climate trends but must manage broad ESG compliance globally.
Lennox International Inc.
- Focus on HVAC efficiency supports climate transition, yet less diversified ESG initiatives may limit resilience to evolving standards.
7. Geopolitical Exposure
Johnson Controls International plc
- High geopolitical risk due to multinational footprint, especially in volatile markets across Asia Pacific and Europe.
Lennox International Inc.
- Limited geopolitical exposure with US-centric operations, reducing risk from international tensions and trade disputes.
Which company shows a better risk-adjusted profile?
Lennox International’s most impactful risk lies in its elevated leverage and debt burden, increasing financial vulnerability despite strong profitability. Johnson Controls faces significant geopolitical and operational risks due to its global scale and supply chain complexity. Overall, Lennox International offers a better risk-adjusted profile, backed by superior ROIC (25.5% vs. 8.75%) and a safer Altman Z-Score (7.49 vs. 2.51), despite higher financial leverage. This contrast highlights Lennox’s efficient capital allocation and robust operational focus as a buffer against market volatility.
Final Verdict: Which stock to choose?
Johnson Controls International’s superpower lies in its steady improvement in profitability amid a challenging capital efficiency backdrop. It operates with a disciplined approach to cash flow, though its tight liquidity remains a point of vigilance. This stock suits investors targeting consistent value creation within a balanced, income-oriented portfolio.
Lennox International commands a strategic moat through its robust returns on invested capital and impressive operational efficiency. Its growth profile benefits from strong asset turnover and a solid interest coverage ratio, offering better financial safety than Johnson Controls. It fits well in Growth at a Reasonable Price (GARP) strategies for investors seeking premium stability with upside potential.
If you prioritize resilient value creation and improving profitability, Johnson Controls presents a compelling scenario despite liquidity concerns. However, if you seek higher returns with operational excellence and can tolerate a pricier valuation, Lennox International outshines with stronger capital efficiency and growth metrics. Both require careful consideration of their distinct risk profiles.
Disclaimer: Investment carries a risk of loss of initial capital. The past performance is not a reliable indicator of future results. Be sure to understand risks before making an investment decision.
Go Further
I encourage you to read the complete analyses of Johnson Controls International plc and Lennox International Inc. to enhance your investment decisions: