Home > Comparison > Industrials > ROP vs JBTM
The strategic rivalry between Roper Technologies, Inc. and JBT Marel Corporation shapes the trajectory of the industrial machinery sector. Roper operates as a diversified technology-driven industrial conglomerate, while JBT Marel focuses on specialized food and beverage processing solutions. This head-to-head contrasts broad industrial innovation against targeted market specialization. This analysis aims to identify which business model delivers the superior risk-adjusted return for a well-diversified portfolio in 2026.
Table of contents
Companies Overview
Roper Technologies and JBT Marel lead distinct yet overlapping niches in the industrial machinery sector.
Roper Technologies, Inc.: Diverse Industrial Software and Equipment Leader
Roper Technologies dominates with a broad portfolio of software and engineered products across sectors like healthcare, insurance, and utilities. Its core revenue stems from cloud-based software and precision instruments that enhance operational efficiency. In 2026, Roper emphasizes innovation in data analytics and automation to deepen vertical integration and capture technology-driven growth.
JBT Marel Corporation: Specialized Food and Beverage Processing Innovator
JBT Marel focuses on technology solutions for the food and beverage industry, offering equipment from cooking to packaging. Its revenue base relies on advanced processing and automation systems tailored for diverse markets globally. The company’s 2026 strategy centers on expanding end-to-end processing capabilities and strengthening its footprint in health-related food segments.
Strategic Collision: Similarities & Divergences
Roper and JBT Marel both leverage industrial machinery but diverge in market scope—Roper opts for a diversified, software-driven model, while JBT Marel pursues specialized food processing automation. Their primary battleground is operational efficiency through technology, yet Roper’s broad tech ecosystem contrasts with JBT’s focused vertical integration. These differences define distinct risk and growth profiles for investors evaluating industrial innovation exposure.
Income Statement Comparison
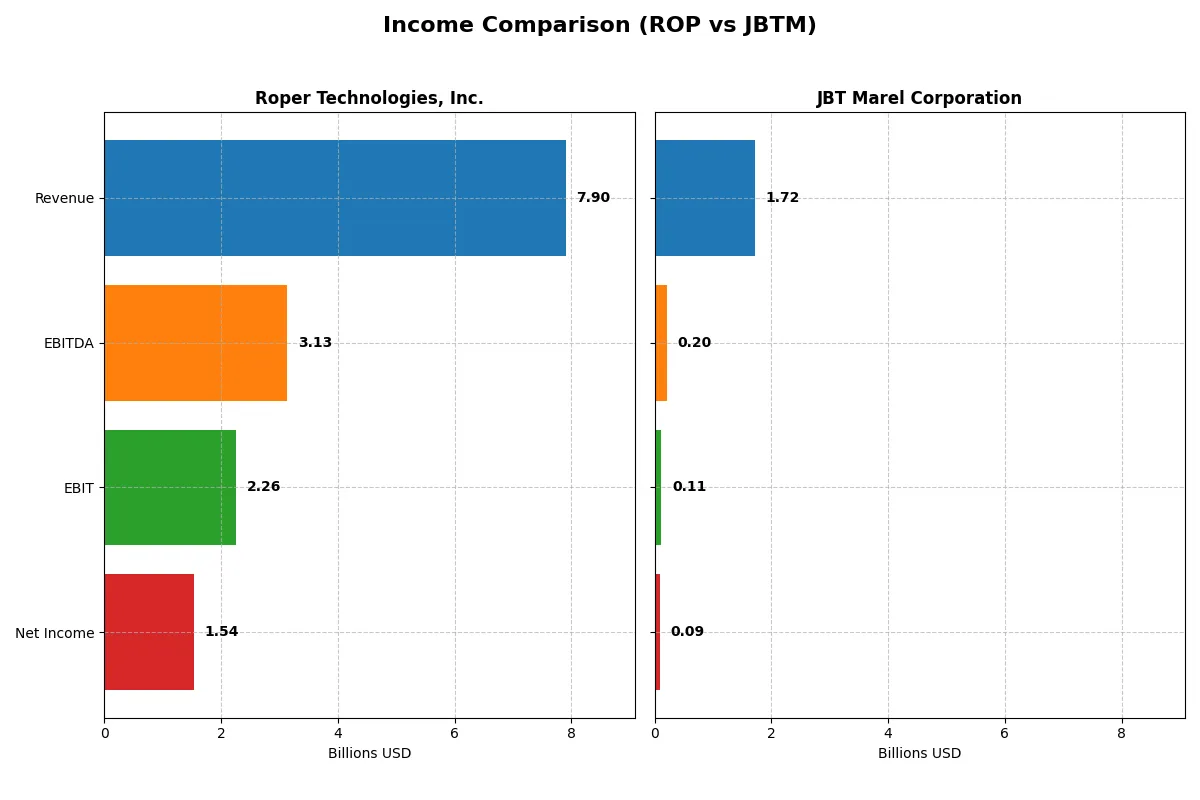
This data dissects the core profitability and scalability of both corporate engines to reveal who dominates the bottom line:
| Metric | Roper Technologies, Inc. (ROP) | JBT Marel Corporation (JBTM) |
|---|---|---|
| Revenue | 7.90B | 1.72B |
| Cost of Revenue | 2.43B | 1.09B |
| Operating Expenses | 3.24B | 508M |
| Gross Profit | 5.47B | 627M |
| EBITDA | 3.13B | 204M |
| EBIT | 2.26B | 115M |
| Interest Expense | 325M | 19.4M |
| Net Income | 1.54B | 85.4M |
| EPS | 14.31 | 2.67 |
| Fiscal Year | 2025 | 2024 |
Income Statement Analysis: The Bottom-Line Duel
This income statement comparison reveals which company runs a more efficient and profitable business engine, highlighting financial health and growth dynamics.
Roper Technologies, Inc. Analysis
Roper Technologies shows a strong revenue climb from $4.8B in 2021 to $7.9B in 2025, with net income rising from $1.1B to $1.5B. Its gross margin stays robust around 69%, while net margin hovers near 19%, indicating solid cost control. Despite a slight net margin dip last year, Roper maintains healthy momentum and efficiency.
JBT Marel Corporation Analysis
JBT Marel’s revenue remains relatively flat, around $1.7B in 2024, with net income sliding from $137M in 2022 to $85M in 2024. Its gross margin is modest at 36.5%, and net margin drops below 5%, reflecting rising costs and declining profitability. The company faces headwinds, marked by a sharp net margin and EPS contraction last year.
Margin Strength vs. Growth Trajectory
Roper Technologies clearly leads with superior margins and consistent revenue growth, delivering better profitability and operational leverage. JBT Marel’s stagnant revenue and deteriorating margins weigh on its fundamental appeal. For investors prioritizing margin resilience and growth, Roper’s profile stands as the more compelling choice.
Financial Ratios Comparison
These vital ratios act as a diagnostic tool to expose the underlying fiscal health, valuation premiums, and capital efficiency of the companies compared below:
| Ratios | Roper Technologies, Inc. (ROP) | JBT Marel Corporation (JBTM) |
|---|---|---|
| ROE | N/A | 5.53% |
| ROIC | N/A | 3.65% |
| P/E | 31.1 | 47.6 |
| P/B | 2.95 | 2.63 |
| Current Ratio | 0.40 | 3.48 |
| Quick Ratio | 0.37 | 3.04 |
| D/E | 0.41 | 0.81 |
| Debt-to-Assets | 24.5% | 36.7% |
| Interest Coverage | 7.70 | 6.10 |
| Asset Turnover | 0.22 | 0.50 |
| Fixed Asset Turnover | 47.0 | 7.34 |
| Payout ratio | 20.8% | 15.3% |
| Dividend yield | 0.58% | 0.32% |
| Fiscal Year | 2024 | 2024 |
Efficiency & Valuation Duel: The Vital Signs
Financial ratios act as a company’s DNA, unveiling hidden risks and operational strengths that often escape headline figures.
Roper Technologies, Inc.
Roper shows a solid net margin of 19.44%, signaling efficient core profitability despite an unfavorable ROE and ROIC. Its P/E ratio of 31.06 suggests a stretched valuation. Dividend yield stands at 0.74%, indicating modest shareholder returns alongside reinvestments in R&D, reflecting a growth-focused strategy.
JBT Marel Corporation
JBT Marel posts a weaker net margin of 4.98% and a modest ROE of 5.53%, highlighting operational challenges. The stock appears expensive with a P/E of 47.63. Its dividend yield is low at 0.32%, with reinvestment likely aimed at improving asset turnover and operational efficiency, as seen in its favorable fixed asset turnover.
Valuation Stretch vs. Profitability Efficiency
Roper balances strong profitability with a stretched valuation, while JBT Marel faces operational headwinds amid an even higher valuation multiple. Investors seeking operational efficiency may lean toward Roper’s profile, whereas those betting on turnaround potential might consider JBT Marel’s growth attempts.
Which one offers the Superior Shareholder Reward?
I observe that Roper Technologies, Inc. (ROP) delivers a more balanced shareholder reward than JBT Marel Corporation (JBTM). ROP offers a 0.74% dividend yield with a sustainable 23% payout ratio, backed by strong free cash flow coverage (nearly 1:1). Its buyback program, while less explicit, complements dividends in returning capital. JBTM’s yield is lower at 0.32%, with a modest 15% payout ratio and weaker free cash flow conversion (~84%), but it maintains steady buybacks. ROP’s higher margins and robust cash flow underpin a more durable distribution model, favoring long-term total return. I conclude ROP presents the superior total return profile for investors in 2026.
Comparative Score Analysis: The Strategic Profile
The radar chart reveals the fundamental DNA and trade-offs of Roper Technologies, Inc. and JBT Marel Corporation, highlighting their financial strengths and weaknesses:
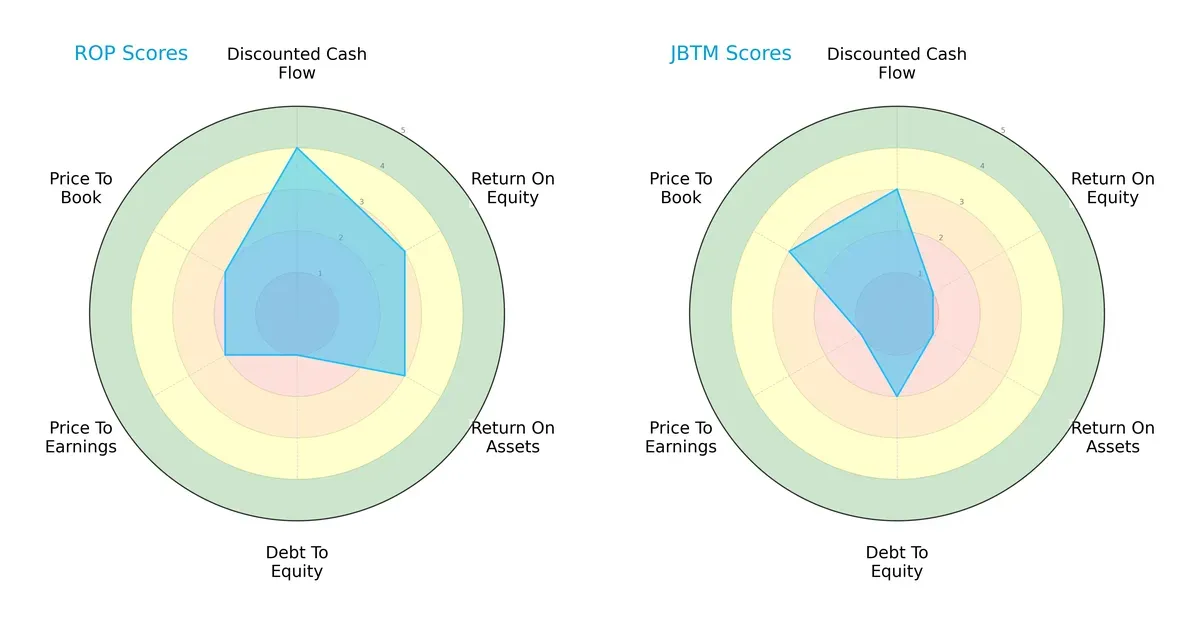
Roper shows a more balanced profile with solid DCF (4) and moderate ROE (3) and ROA (3) scores, though it carries high financial risk with a very unfavorable debt-to-equity score (1). JBT relies on a specific edge in price-to-book (3) but struggles with very unfavorable ROE (1), ROA (1), and price-to-earnings (1) metrics. Roper’s diversified strength contrasts with JBT’s uneven performance.
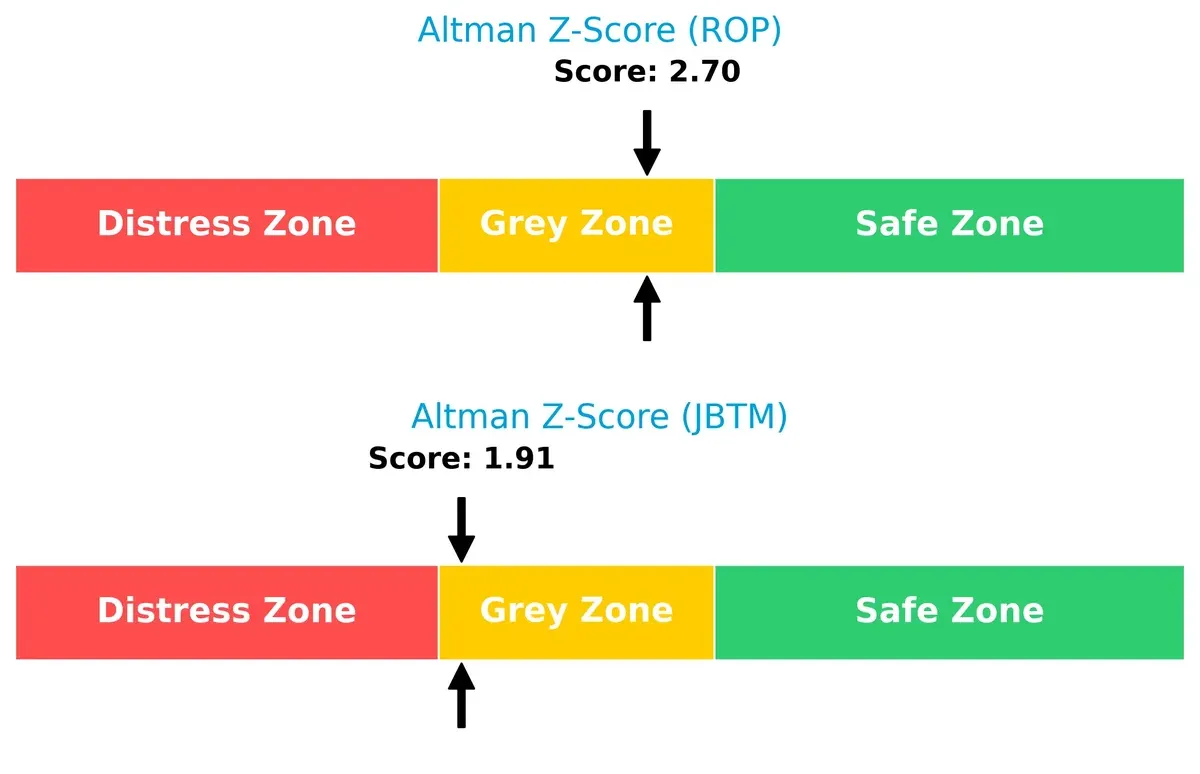
Bankruptcy Risk: Solvency Showdown
Roper’s Altman Z-Score of 2.70 surpasses JBT’s 1.91, placing both in the grey zone but signaling Roper’s relatively stronger solvency and lower bankruptcy risk in the current economic cycle:
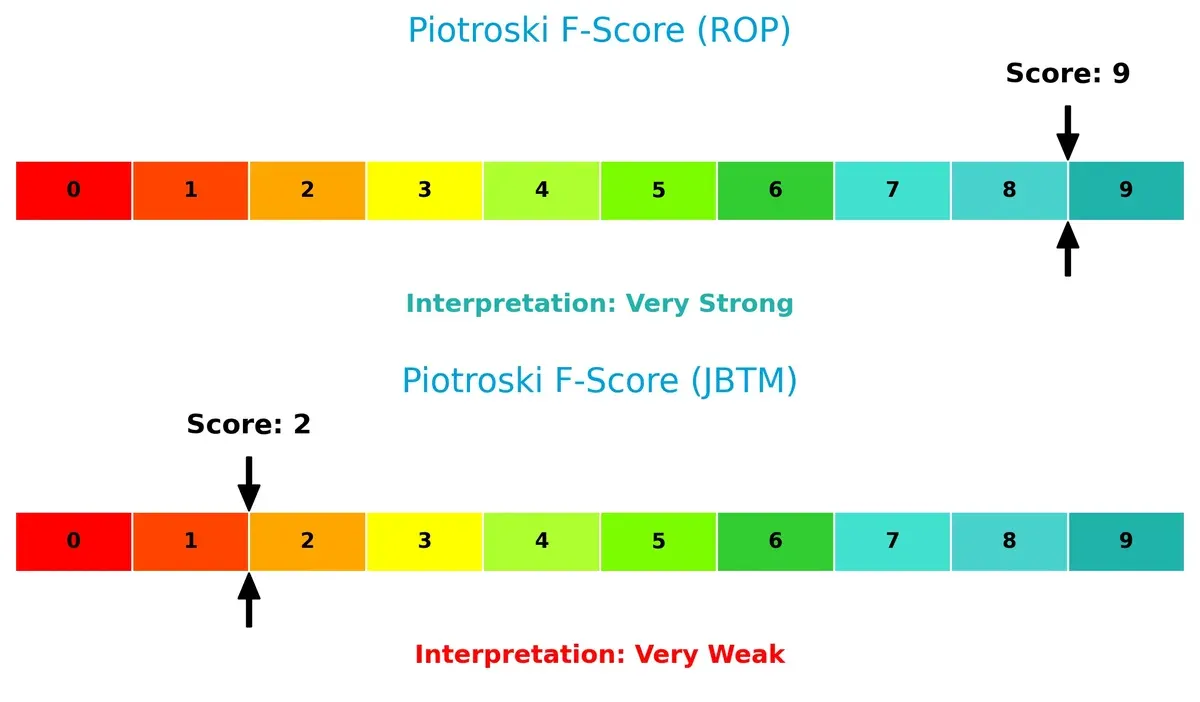
Financial Health: Quality of Operations
Roper’s Piotroski F-Score of 9 signals peak financial health and robust internal operations. JBT’s score of 2 raises red flags, indicating weak fundamentals and caution for investors:
How are the two companies positioned?
This section dissects the operational DNA of ROP and JBTM by comparing their revenue distribution and internal strengths and weaknesses. The goal is to confront their economic moats to reveal which model sustains the most durable competitive edge today.
Revenue Segmentation: The Strategic Mix
This comparison dissects how Roper Technologies, Inc. and JBT Marel Corporation diversify their income streams and highlights their primary sector bets:
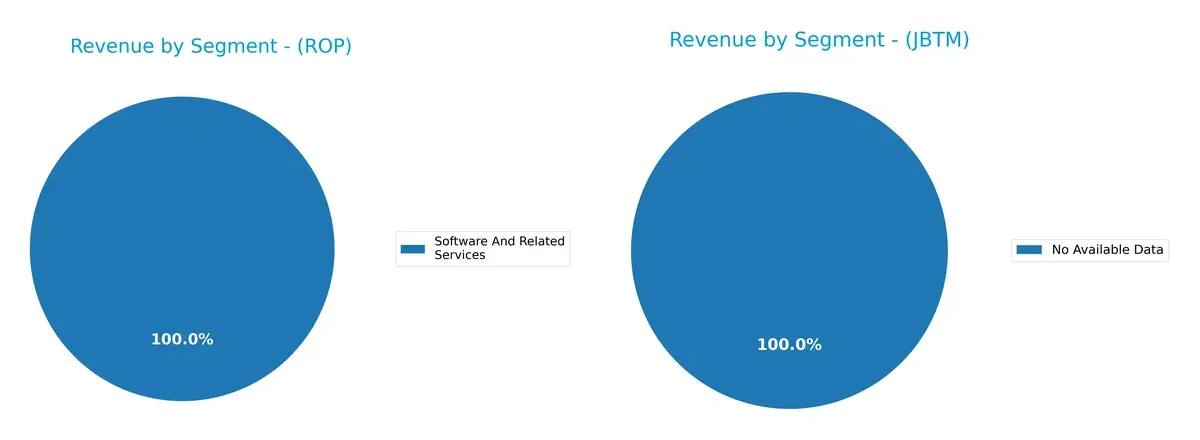
Roper Technologies leans heavily on its Software And Related Services, generating $10.7B in 2024, dwarfing its smaller segments. In contrast, JBT Marel lacks available segment data, preventing a direct comparison. Roper’s concentrated software revenue anchors its strategy, emphasizing ecosystem lock-in but exposing it to tech cyclicality. This focus contrasts with firms that diversify broadly, which typically mitigate sector-specific risks more effectively.
Strengths and Weaknesses Comparison
This table compares the Strengths and Weaknesses of Roper Technologies and JBT Marel Corporation:
Roper Technologies Strengths
- High net margin at 19.44%
- Favorable debt-to-assets and interest coverage ratios
- Strong software and related services revenue at $10.7B in 2024
JBT Marel Corporation Strengths
- Favorable WACC at 7.53%
- Strong quick ratio of 3.04
- High fixed asset turnover of 7.34 indicating efficient asset use
Roper Technologies Weaknesses
- Unfavorable ROE and ROIC at 0%
- Low liquidity ratios (current and quick ratio)
- Unfavorable P/E at 31.06
- Asset turnover unfavorable
JBT Marel Corporation Weaknesses
- Low net margin at 4.98%
- ROE and ROIC below WACC indicating weak profitability
- Elevated P/E at 47.63
- Moderate debt levels with neutral debt to assets ratio
Roper Technologies shows strong profitability and debt management but struggles with operational efficiency and liquidity. JBT Marel has efficient asset use and cost of capital control but weaker profitability and higher valuation multiples. Both companies face distinct challenges impacting their financial health and strategic positioning.
The Moat Duel: Analyzing Competitive Defensibility
A structural moat is the only barrier protecting long-term profits from relentless competition erosion. Let’s dissect the unique moats of two industrial machinery companies:
Roper Technologies, Inc.: Intangible Assets Powerhouse
Roper’s moat stems from its diverse software and engineered solutions portfolio. This manifests in robust gross margins (69%) and stable EBIT margins (29%), signaling pricing power. Expansion into cloud-based analytics and niche industrial systems in 2026 may deepen its intangible asset moat.
JBT Marel Corporation: Specialized Process Innovation
JBTM relies on specialized food and beverage processing technology. Unlike Roper’s broad software moat, JBTM’s competitive edge shows weaker margins (gross margin 37%, EBIT 7%) and declining profitability. Its future hinges on innovating automation and expanding global food tech markets.
Intangible Assets vs. Specialized Technology: Who Holds the Deeper Moat?
Roper’s broader intangible asset base delivers higher margins and growth, indicating a wider moat than JBTM’s narrowing profitability. I see Roper better positioned to sustain and defend its market share through diversified innovation and premium pricing.
Which stock offers better returns?
The past year shows stark contrast between Roper Technologies and JBT Marel, with Roper’s price sharply declining and JBT Marel gaining steadily, reflecting divergent trading dynamics.
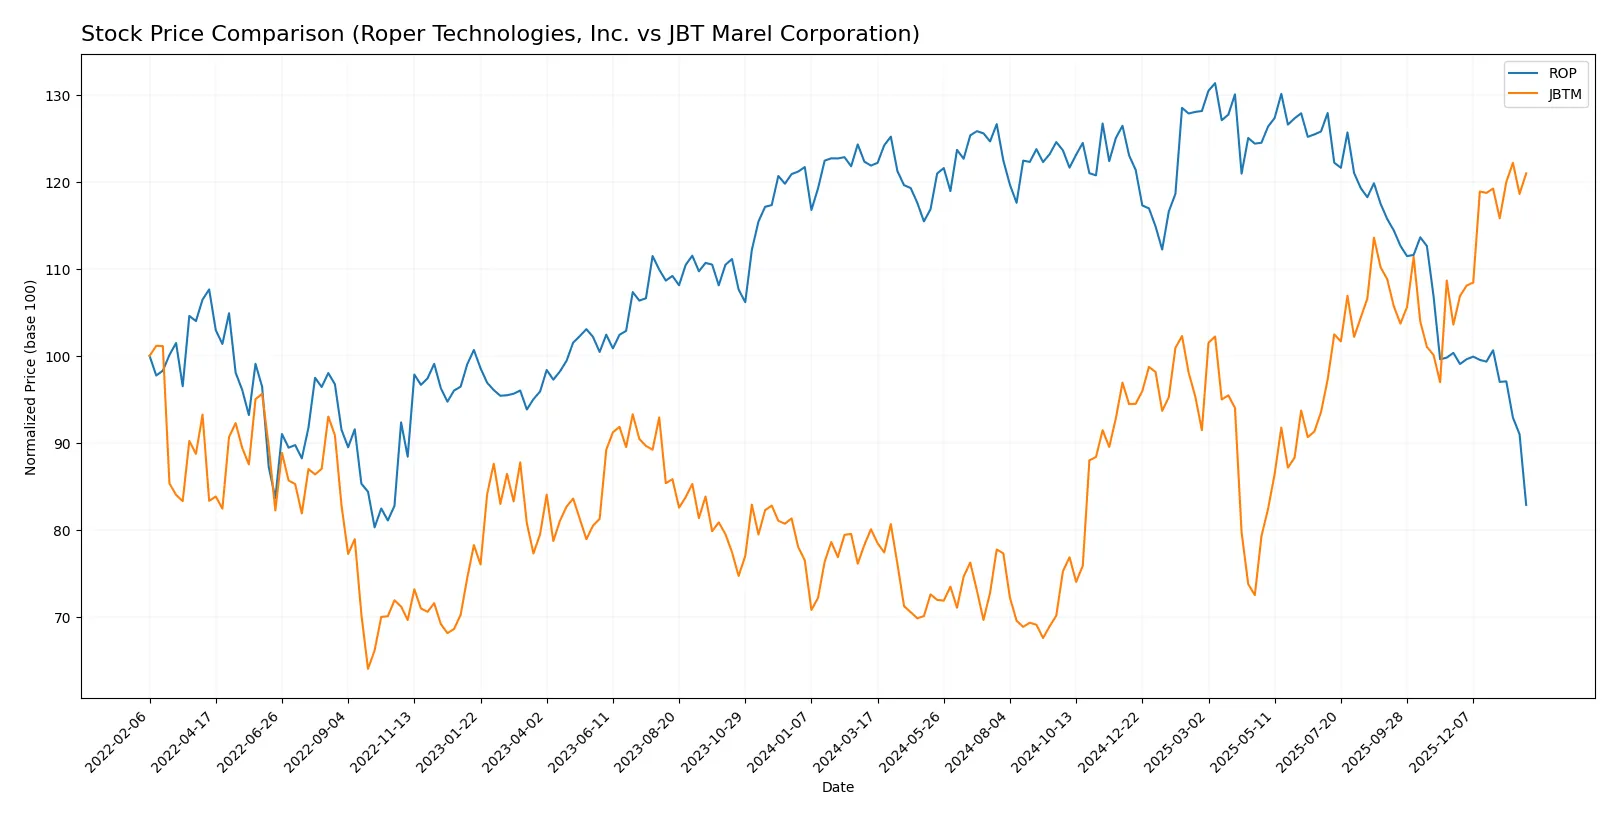
Trend Comparison
Roper Technologies, Inc. exhibits a bearish trend over the past 12 months with a -32.0% price change and decelerating decline. High volatility is evident from a 44.8 standard deviation and a peak at 588.38 before falling to 371.23.
JBT Marel Corporation shows a bullish trend with a 51.1% price increase and accelerating momentum. Its price fluctuated less, evidenced by a 20.23 standard deviation, rising from 87.85 to a high at 158.88.
Comparing both, JBT Marel outperforms Roper Technologies with a strong bullish trend and higher overall returns over the past year.
Target Prices
Analysts present a moderately bullish consensus for both Roper Technologies, Inc. and JBT Marel Corporation.
| Company | Target Low | Target High | Consensus |
|---|---|---|---|
| Roper Technologies, Inc. | 365 | 575 | 475.5 |
| JBT Marel Corporation | 169 | 180 | 174.5 |
Roper’s consensus target sits about 28% above its current 371 price, signaling strong upside potential. JBT Marel’s target consensus is roughly 11% above the current 157 price, reflecting modest growth expectations.

Don’t Let Luck Decide Your Entry Point
Optimize your entry points with our advanced ProRealTime indicators. You’ll get efficient buy signals with precise price targets for maximum performance. Start outperforming now!
How do institutions grade them?
Roper Technologies, Inc. Grades
Here are the latest institutional grades for Roper Technologies, Inc.:
| Grading Company | Action | New Grade | Date |
|---|---|---|---|
| Goldman Sachs | Maintain | Neutral | 2026-01-29 |
| Argus Research | Downgrade | Hold | 2026-01-28 |
| Truist Securities | Maintain | Buy | 2026-01-28 |
| Mizuho | Maintain | Underperform | 2026-01-28 |
| Oppenheimer | Downgrade | Perform | 2026-01-28 |
| RBC Capital | Maintain | Sector Perform | 2026-01-28 |
| Barclays | Maintain | Underweight | 2026-01-28 |
| Stifel | Downgrade | Hold | 2026-01-28 |
| Citigroup | Maintain | Buy | 2026-01-28 |
| JP Morgan | Maintain | Underweight | 2026-01-28 |
JBT Marel Corporation Grades
Below are the recent institutional grades for JBT Marel Corporation:
| Grading Company | Action | New Grade | Date |
|---|---|---|---|
| Jefferies | Upgrade | Buy | 2025-12-10 |
| William Blair | Upgrade | Outperform | 2025-08-06 |
Which company has the best grades?
JBT Marel Corporation holds stronger recent grades, including upgrades to Buy and Outperform. Roper Technologies shows mixed ratings with several downgrades and Hold or Neutral grades. This difference may influence investors seeking momentum in analyst sentiment.
Risks specific to each company
The following categories identify the critical pressure points and systemic threats facing both firms in the 2026 market environment:
1. Market & Competition
Roper Technologies, Inc. (ROP)
- Strong industrial machinery presence with diversified software and engineered products; faces pressure from technology innovation.
JBT Marel Corporation (JBTM)
- Focused on food and beverage processing technology; competitive pressures from automation and regional players.
2. Capital Structure & Debt
Roper Technologies, Inc. (ROP)
- Favorable debt-to-assets and interest coverage; concerns over unfavorable debt-to-equity score signal leverage risk.
JBT Marel Corporation (JBTM)
- Moderate debt levels with reasonable interest coverage; balanced capital structure but slightly higher leverage.
3. Stock Volatility
Roper Technologies, Inc. (ROP)
- Beta of 0.942 indicates low volatility, reflecting stable investor sentiment.
JBT Marel Corporation (JBTM)
- Beta near 1.0 shows average market volatility, exposing stock to market swings.
4. Regulatory & Legal
Roper Technologies, Inc. (ROP)
- Operating in multiple regulated sectors including healthcare and utilities; potential compliance risks.
JBT Marel Corporation (JBTM)
- Exposure to food safety and health regulations; global operations increase legal complexity.
5. Supply Chain & Operations
Roper Technologies, Inc. (ROP)
- Complex supply chains for diverse product lines; vulnerable to component shortages.
JBT Marel Corporation (JBTM)
- Reliance on global manufacturing and automation supply chains; risks from geopolitical disruptions.
6. ESG & Climate Transition
Roper Technologies, Inc. (ROP)
- Growing pressure to enhance sustainability across machinery and software solutions.
JBT Marel Corporation (JBTM)
- Increasing demand for sustainable food processing technologies; must manage carbon footprint.
7. Geopolitical Exposure
Roper Technologies, Inc. (ROP)
- Predominantly US-based with some international exposure; moderate geopolitical risk.
JBT Marel Corporation (JBTM)
- Broad international footprint across multiple continents, increasing geopolitical sensitivity.
Which company shows a better risk-adjusted profile?
Roper Technologies faces its greatest risk in capital structure due to leverage concerns despite strong operational diversity. JBT Marel’s primary risk lies in weak profitability and financial stability amid competitive and geopolitical pressures. Given Roper’s superior Altman Z-Score (2.7 vs. 1.9) and stronger Piotroski Score (9 vs. 2), Roper offers a better risk-adjusted profile. Its stable beta and favorable interest coverage reinforce resilience. Conversely, JBT’s weak profitability metrics and elevated P/E ratio raise caution. Recent data shows Roper’s stronger financial health despite industry challenges, justifying my prudence.
Final Verdict: Which stock to choose?
Roper Technologies, Inc. (ROP) shines with unmatched operational efficiency and robust cash flow generation. Its high intangible asset base signals a sophisticated product mix but also warrants vigilance on balance sheet leverage. ROP suits portfolios seeking steady, long-term growth with moderate risk tolerance.
JBT Marel Corporation (JBTM) offers a strategic moat through its strong liquidity and accelerating price momentum. Its lower leverage and favorable interest coverage provide comparatively better financial safety. JBTM fits investors inclined toward dynamic growth with a balanced risk profile, blending growth at a reasonable price.
If you prioritize operational resilience and cash generation, ROP is the compelling choice due to its efficient capital use despite some leverage concerns. However, if you seek growth with enhanced financial stability and momentum, JBTM offers better stability and upside potential, albeit with a more modest profitability track record.
Disclaimer: Investment carries a risk of loss of initial capital. The past performance is not a reliable indicator of future results. Be sure to understand risks before making an investment decision.
Go Further
I encourage you to read the complete analyses of Roper Technologies, Inc. and JBT Marel Corporation to enhance your investment decisions: