In today’s fast-evolving industrial machinery sector, JBT Marel Corporation and Parsons Corporation stand out as innovative leaders with overlapping markets yet distinct focuses. JBT Marel excels in advanced food processing technologies, while Parsons leads in defense, cybersecurity, and critical infrastructure solutions. This comparison explores their strategic strengths and growth prospects to help you identify which company offers the most compelling investment opportunity in 2026.
Table of contents
Companies Overview
I will begin the comparison between JBT Marel Corporation and Parsons Corporation by providing an overview of these two companies and their main differences.
JBT Marel Corporation Overview
JBT Marel Corporation specializes in technology solutions for the food and beverage industry across multiple regions including North America, Europe, and Asia Pacific. The company delivers value-added processing and automated material handling systems to diverse sectors such as baby food, pharmaceuticals, meat, and packaging. Headquartered in Chicago, it operates with around 11,700 employees and is positioned as a key player in industrial machinery for food processing markets.
Parsons Corporation Overview
Parsons Corporation offers integrated solutions and services primarily in defense, intelligence, and critical infrastructure markets worldwide. Its business segments include Federal Solutions and Critical Infrastructure, providing cybersecurity, geospatial intelligence, missile defense, and smart city technologies. Based in Centreville, Virginia, Parsons employs about 20,000 people and serves government agencies along with private-sector clients in transportation, energy, and environmental systems.
Key similarities and differences
Both JBT Marel and Parsons operate in the industrial machinery sector with a focus on technology-driven solutions, yet their markets diverge significantly. JBT Marel targets food and beverage processing while Parsons concentrates on defense, intelligence, and critical infrastructure. They share a presence in North America and international markets, but Parsons has a broader governmental and infrastructure client base compared to JBT Marel’s specialty in manufacturing and food industries.
Income Statement Comparison
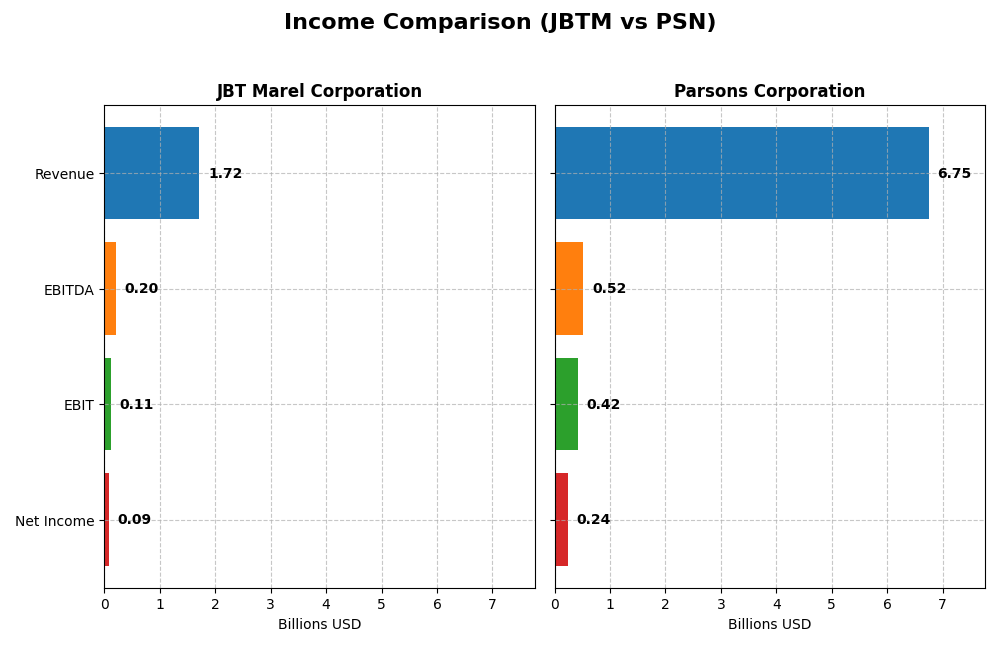
The table below presents a side-by-side comparison of the key income statement metrics for JBT Marel Corporation and Parsons Corporation for the fiscal year 2024.
| Metric | JBT Marel Corporation | Parsons Corporation |
|---|---|---|
| Market Cap | 8.11B | 7.47B |
| Revenue | 1.72B | 6.75B |
| EBITDA | 204.2M | 518.5M |
| EBIT | 114.8M | 419.2M |
| Net Income | 85.4M | 237.99M |
| EPS | 2.67 | 2.21 |
| Fiscal Year | 2024 | 2024 |
Income Statement Interpretations
JBT Marel Corporation
JBT Marel’s revenue showed a slight decrease over the 2020-2024 period, ending at $1.72B in 2024. Net income declined significantly, dropping to $85.4M in 2024 from a peak of $582.6M in 2023. Gross margin remained stable at 36.5%, but EBIT and net margins weakened. The latest year saw slowed revenue growth and deteriorated profitability margins, indicating operational challenges.
Parsons Corporation
Parsons Corporation displayed strong growth with revenue rising from $3.92B in 2020 to $6.75B in 2024. Net income more than doubled, reaching $237.9M in 2024. Margins remained consistent, with gross margin at 20.8% and neutral EBIT margin. The recent year experienced robust revenue and net income growth, supported by improved operational efficiency and expanding profit margins.
Which one has the stronger fundamentals?
Parsons Corporation exhibits stronger fundamentals with broad favorable growth in revenue, net income, and margins over the period, reflecting solid operational performance. Conversely, JBT Marel shows a mixed picture, with declining net income and unfavorable margin trends despite stable gross margin. Parsons’ consistent growth and margin improvements suggest more robust income statement health.
Financial Ratios Comparison
The table below presents a side-by-side comparison of key financial ratios for JBT Marel Corporation (JBTM) and Parsons Corporation (PSN) for the fiscal year 2024.
| Ratios | JBT Marel Corporation (JBTM) | Parsons Corporation (PSN) |
|---|---|---|
| ROE | 5.53% | 9.73% |
| ROIC | 3.65% | 8.28% |
| P/E | 47.63 | 41.72 |
| P/B | 2.63 | 4.06 |
| Current Ratio | 3.48 | 1.29 |
| Quick Ratio | 3.04 | 1.29 |
| D/E (Debt-to-Equity) | 0.81 | 0.59 |
| Debt-to-Assets | 36.68% | 25.89% |
| Interest Coverage | 6.10 | 8.30 |
| Asset Turnover | 0.50 | 1.23 |
| Fixed Asset Turnover | 7.34 | 25.51 |
| Payout Ratio | 15.34% | 0% |
| Dividend Yield | 0.32% | 0% |
Interpretation of the Ratios
JBT Marel Corporation
JBT Marel’s ratios show mixed strength with several unfavorable marks including net margin at 4.98% and ROE at 5.53%, suggesting limited profitability. The current ratio of 3.48 is unfavorable, indicating potential inefficiency in asset utilization despite a favorable quick ratio of 3.04. The company pays a dividend with a yield of 0.32%, but this yield is considered low and potentially unsustainable given the payout context.
Parsons Corporation
Parsons displays a blend of neutral to favorable ratios, with a slightly favorable overall opinion. Despite an unfavorable net margin of 3.48%, its ROE at 9.73% and asset turnover at 1.23 show operational efficiency. Parsons does not pay dividends, likely reflecting a reinvestment strategy to support growth and innovation in defense and infrastructure sectors, supported by a solid interest coverage of 8.13.
Which one has the best ratios?
Parsons Corporation exhibits a more favorable ratio profile overall, with 42.86% favorable ratios compared to JBT Marel’s 28.57%. Parsons benefits from better asset turnover, lower debt-to-assets, and stronger interest coverage. JBT Marel’s higher dividend yield is offset by weaker profitability and liquidity ratios, leading to a slightly unfavorable rating.
Strategic Positioning
This section compares the strategic positioning of JBT Marel Corporation and Parsons Corporation, including Market position, Key segments, and exposure to technological disruption:
JBT Marel Corporation
- Market position and competitive pressure
- Key segments and business drivers
- Exposure to technological disruption
Parsons Corporation
- Operates globally in food and beverage tech with diverse industry exposure, facing industrial machinery competition.
- Provides food processing and automation solutions across multiple food and health markets worldwide.
- Engages in automation and advanced processing tech but no explicit disruption risks mentioned.
JBT Marel Corporation vs Parsons Corporation Positioning
JBT Marel has a diversified approach across food processing and automation industries globally, while Parsons concentrates on defense and infrastructure sectors. Diversification offers broad market coverage; concentration allows specialization and government partnership advantages.
Which has the best competitive advantage?
Parsons displays a very favorable MOAT with growing ROIC exceeding WACC, indicating durable competitive advantage and increasing profitability. JBT Marel faces a very unfavorable MOAT with declining ROIC below WACC, showing value destruction and declining profitability.
Stock Comparison
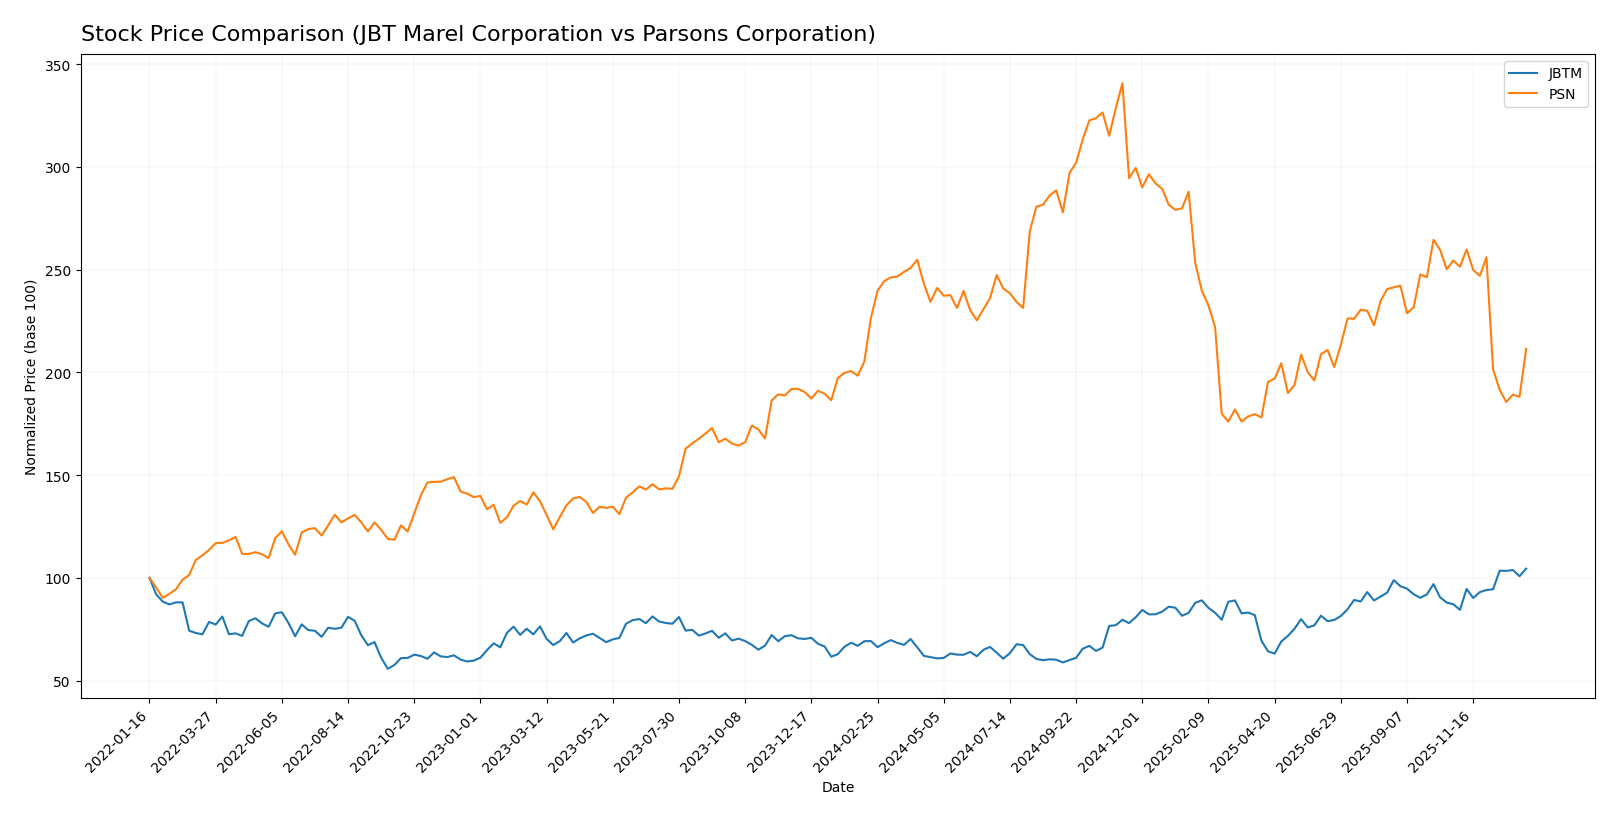
The stock price movement over the past 12 months reveals contrasting trends between JBT Marel Corporation and Parsons Corporation, marked by significant gains for JBTM and declines for PSN.
Trend Analysis
JBT Marel Corporation’s stock exhibited a bullish trend with a 50.89% increase over the past year, showing acceleration and strong volatility with a 19.24 std deviation. The price ranged from 87.85 to 156.04.
Parsons Corporation’s stock experienced a bearish trend, declining 6.64% over the same period with deceleration. Volatility stood at 12.98 std deviation, with prices fluctuating between 58.22 and 112.69.
Comparing the two, JBTM delivered the highest market performance, significantly outperforming PSN’s negative price movement during the analyzed timeframe.
Target Prices
Analysts provide a clear target price consensus for both JBT Marel Corporation and Parsons Corporation, reflecting moderate upside potential.
| Company | Target High | Target Low | Consensus |
|---|---|---|---|
| JBT Marel Corporation | 180 | 169 | 174.5 |
| Parsons Corporation | 107 | 70 | 85 |
The consensus target prices for both companies exceed their current stock prices, indicating analyst expectations for growth, with JBT Marel showing a tighter range and Parsons a wider valuation spread.
Analyst Opinions Comparison
This section compares the analysts’ ratings and grades for JBT Marel Corporation and Parsons Corporation:
Rating Comparison
JBTM Rating
- Rating: C, classified as Very Favorable
- Discounted Cash Flow Score: 3, Moderate
- ROE Score: 1, Very Unfavorable
- ROA Score: 1, Very Unfavorable
- Debt To Equity Score: 2, Moderate
- Overall Score: 2, Moderate
PSN Rating
- Rating: A-, classified as Very Favorable
- Discounted Cash Flow Score: 5, Very Favorable
- ROE Score: 4, Favorable
- ROA Score: 4, Favorable
- Debt To Equity Score: 2, Moderate
- Overall Score: 4, Favorable
Which one is the best rated?
Based strictly on provided data, Parsons Corporation outperforms JBT Marel Corporation in overall rating and key financial scores, showing stronger profitability and valuation metrics while both share moderate debt-to-equity scores.
Scores Comparison
The following table summarizes the Altman Z-Score and Piotroski Score for JBT Marel Corporation and Parsons Corporation:
JBTM Scores
- Altman Z-Score: 1.75, in distress zone, high bankruptcy risk
- Piotroski Score: 2, very weak financial health
PSN Scores
- Altman Z-Score: 3.59, in safe zone, low bankruptcy risk
- Piotroski Score: 6, average financial health
Which company has the best scores?
Parsons Corporation has clearly stronger scores, with a safe zone Altman Z-Score and an average Piotroski Score. JBT Marel shows distress-level risk and very weak Piotroski results based on the provided data.
Grades Comparison
This section presents a factual comparison of the recent grades assigned to JBT Marel Corporation and Parsons Corporation:
JBT Marel Corporation Grades
The following table summarizes recent grade changes from recognized grading companies for JBT Marel Corporation:
| Grading Company | Action | New Grade | Date |
|---|---|---|---|
| Jefferies | Upgrade | Buy | 2025-12-10 |
| William Blair | Upgrade | Outperform | 2025-08-06 |
JBT Marel Corporation’s grades show a positive trend with upgrades from Hold to Buy and Market Perform to Outperform, indicating improving analyst sentiment.
Parsons Corporation Grades
The table below details the latest grades provided by verified grading firms for Parsons Corporation:
| Grading Company | Action | New Grade | Date |
|---|---|---|---|
| B of A Securities | Maintain | Buy | 2025-12-30 |
| Stifel | Maintain | Buy | 2025-12-23 |
| Jefferies | Maintain | Hold | 2025-12-11 |
| TD Cowen | Upgrade | Buy | 2025-12-10 |
| Baird | Maintain | Outperform | 2025-12-08 |
| Truist Securities | Maintain | Buy | 2025-12-08 |
| Keybanc | Maintain | Overweight | 2025-12-08 |
| Truist Securities | Maintain | Buy | 2025-12-05 |
| William Blair | Upgrade | Outperform | 2025-11-20 |
| Keybanc | Maintain | Overweight | 2025-10-20 |
Parsons Corporation maintains a strong consensus with multiple Buy and Outperform ratings and only a few Hold and Sell opinions, reflecting a generally stable to positive outlook.
Which company has the best grades?
Parsons Corporation has received a broader range of grades, predominantly Buy and Outperform, supported by multiple grading firms maintaining or upgrading their ratings. JBT Marel shows notable recent upgrades but from fewer sources. Investors may interpret Parsons’ wider analyst support as a sign of stronger confidence, while JBT’s upward revisions suggest improving prospects.
Strengths and Weaknesses
Below is a comparative overview of key strengths and weaknesses for JBT Marel Corporation and Parsons Corporation based on the most recent financial and strategic data.
| Criterion | JBT Marel Corporation (JBTM) | Parsons Corporation (PSN) |
|---|---|---|
| Diversification | Limited product segmentation; less diversified revenue streams | Well diversified with Critical Infrastructure ($2.74B) and Federal Solutions ($4.01B) segments |
| Profitability | Low net margin (4.98%), ROIC (3.65%) below WACC (7.48%), value destroying | Moderate net margin (3.48%), ROIC (8.28%) above WACC (6.17%), value creating |
| Innovation | Moderate fixed asset turnover (7.34); innovation impact unclear | High fixed asset turnover (25.51); strong asset efficiency suggests innovation focus |
| Global presence | Neutral debt profile but declining ROIC points to operational challenges | Favorable debt-to-assets (25.89%), growing ROIC and profitability indicate strong global competitiveness |
| Market Share | High P/E ratio (47.63) suggests market expectations but weak fundamentals | High P/E (41.72) but improving profitability and operational metrics support growth potential |
Key takeaway: Parsons Corporation demonstrates a durable competitive advantage with growing profitability, diversification, and operational efficiency, making it a more favorable investment. JBT Marel shows signs of value destruction and less diversification, warranting caution.
Risk Analysis
Below is a comparison of key risks affecting JBT Marel Corporation (JBTM) and Parsons Corporation (PSN) based on the latest 2024 data and 2026 market insights:
| Metric | JBT Marel Corporation (JBTM) | Parsons Corporation (PSN) |
|---|---|---|
| Market Risk | Moderate beta (1.00), price volatility within $90-$160 range, slightly unfavorable profitability ratios | Lower beta (0.66), moderate price volatility, slightly more stable market position |
| Debt level | Debt-to-equity 0.81 (neutral), debt to assets 36.7%, interest coverage favorable (5.92x) | Debt-to-equity 0.59 (neutral), debt to assets 25.9%, higher interest coverage (8.13x) |
| Regulatory Risk | Exposure to food and beverage processing regulations globally, moderate risk | Defense and critical infrastructure sector faces strict US government and international regulations |
| Operational Risk | Broad industrial machinery operations with complex supply chains, moderate operational challenges | Complex defense and infrastructure projects, with high stakes on project delivery and cybersecurity |
| Environmental Risk | Moderate, due to manufacturing and food processing equipment | Higher, due to involvement in environmental cleanup, nuclear waste processing, and critical infrastructure |
| Geopolitical Risk | Moderate, global food sector exposure including emerging markets | High, given defense contracts and geopolitical tensions affecting government spending |
Synthesis: Parsons faces higher geopolitical and regulatory risks tied to defense and critical infrastructure projects, though it benefits from stronger financial stability and lower debt ratios. JBTM’s risks are more operational and market-driven, with weaker profitability and financial health indicators. Investors should weigh Parsons’ exposure to government policy shifts against JBTM’s challenges in profitability and market volatility.
Which Stock to Choose?
JBT Marel Corporation’s income shows a mixed evolution with a slight revenue growth of 3.1% in 2024 but overall unfavorable net margin and EPS declines. Financial ratios reveal a slightly unfavorable profile with weak profitability and moderate debt levels; the rating is very favorable but scores indicate financial distress.
Parsons Corporation exhibits favorable income growth with 24.03% revenue increase in 2024 and consistent improvements in profitability and margins. Its financial ratios are slightly favorable, demonstrating better asset turnover and lower debt, supported by a strong rating and scores indicating financial stability.
Investors with a growth-oriented profile might find Parsons Corporation appealing due to its favorable income growth and value-creating economic moat, while risk-tolerant investors could interpret JBT Marel’s mixed signals with caution given its declining profitability and value destruction indications.
Disclaimer: Investment carries a risk of loss of initial capital. The past performance is not a reliable indicator of future results. Be sure to understand risks before making an investment decision.
Go Further
I encourage you to read the complete analyses of JBT Marel Corporation and Parsons Corporation to enhance your investment decisions: