Home > Comparison > Industrials > PH vs JBTM
The strategic rivalry between Parker-Hannifin Corporation and JBT Marel Corporation shapes the Industrials sector’s machinery landscape. Parker-Hannifin is a diversified industrial heavyweight with aerospace and motion control expertise. JBT Marel specializes in food processing technology and automation solutions. This head-to-head contrasts broad industrial diversification against niche innovation. This analysis aims to reveal which trajectory offers a superior risk-adjusted return for a balanced portfolio in 2026.
Table of contents
Companies Overview
Parker-Hannifin and JBT Marel stand as pivotal players in industrial machinery, shaping diverse global markets.
Parker-Hannifin Corporation: Industrial Motion & Control Leader
Parker-Hannifin dominates motion and control technologies, serving mobile, industrial, and aerospace sectors. Its core revenue stems from diversified industrial and aerospace systems supplying OEMs and distributors. In 2026, it prioritizes innovation in hydraulic, pneumatic, and electromechanical solutions, emphasizing durability and precision across harsh environments.
JBT Marel Corporation: Food & Beverage Processing Innovator
JBT Marel specializes in technology solutions for food and beverage processing worldwide. It generates revenue through advanced processing equipment and automated guided vehicles for manufacturing and logistics. Its 2026 strategy focuses on expanding automation and value-added processing capabilities to meet evolving demands in food safety, efficiency, and sustainability.
Strategic Collision: Similarities & Divergences
Both companies excel in industrial machinery, yet Parker-Hannifin targets broad industrial and aerospace markets, while JBT Marel narrows its focus on food processing automation. Their competition centers on technological innovation and operational efficiency. Investors face distinct profiles: Parker-Hannifin offers scale and diversified exposure; JBT Marel presents niche growth driven by specialized automation.
Income Statement Comparison
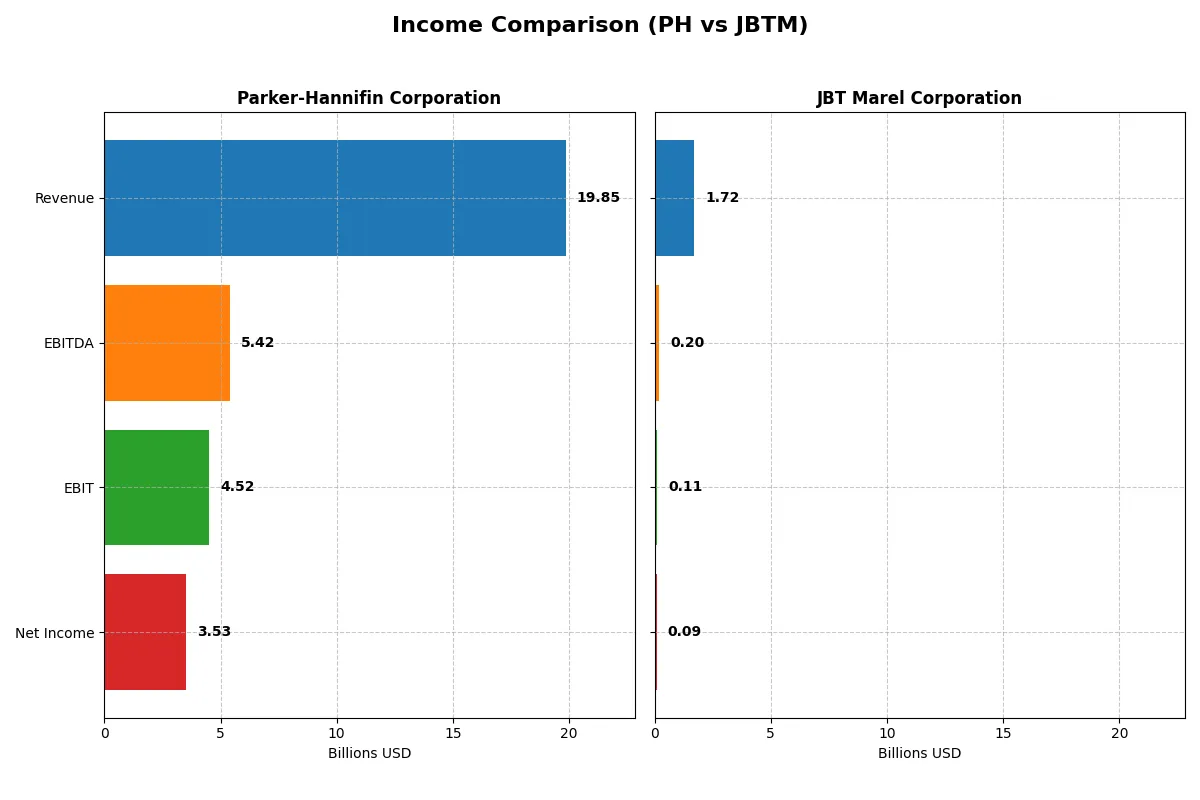
The following data dissects the core profitability and scalability of both corporate engines to reveal who dominates the bottom line:
| Metric | Parker-Hannifin Corporation (PH) | JBT Marel Corporation (JBTM) |
|---|---|---|
| Revenue | 19.85B | 1.72B |
| Cost of Revenue | 12.54B | 1.09B |
| Operating Expenses | 3.26B | 508M |
| Gross Profit | 7.32B | 627M |
| EBITDA | 5.42B | 204M |
| EBIT | 4.52B | 115M |
| Interest Expense | 409M | 19.4M |
| Net Income | 3.53B | 85.4M |
| EPS | 27.52 | 2.67 |
| Fiscal Year | 2025 | 2024 |
Income Statement Analysis: The Bottom-Line Duel
This income statement comparison reveals which company runs a more efficient and profitable corporate engine through key financial metrics.
Parker-Hannifin Corporation Analysis
Parker-Hannifin shows steady revenue growth, reaching $19.85B in 2025 with net income rising to $3.53B. Its gross margin holds strong at 36.85%, while net margin improves to 17.79%. Despite a slight revenue decline in the latest year, operating efficiency and earnings momentum remain robust, signaling solid profitability.
JBT Marel Corporation Analysis
JBT Marel posts lower scale revenues near $1.72B in 2024, with net income sharply down to $85M. Gross margin is comparable at 36.51%, but net margin languishes at 4.98%. Recent EBIT and net margin contractions highlight weakening profitability and operational challenges, despite modest revenue growth.
Margin Strength vs. Earnings Scale
Parker-Hannifin dominates with higher revenues and superior net margins, showing strong earnings growth and stable operating leverage. JBT Marel struggles with shrinking earnings and weaker margins, signaling less efficient capital use. For investors, Parker-Hannifin’s profile offers more resilience and profit power in this comparison.
Financial Ratios Comparison
These vital ratios act as a diagnostic tool to expose the underlying fiscal health, valuation premiums, and capital efficiency of the companies analyzed:
| Ratios | Parker-Hannifin (PH) | JBT Marel (JBTM) |
|---|---|---|
| ROE | 25.8% | 5.5% |
| ROIC | 13.7% | 3.7% |
| P/E | 25.4 | 47.6 |
| P/B | 6.5 | 2.6 |
| Current Ratio | 1.19 | 3.48 |
| Quick Ratio | 0.71 | 3.04 |
| D/E | 0.69 | 0.81 |
| Debt-to-Assets | 32.2% | 36.7% |
| Interest Coverage | 9.93 | 6.10 |
| Asset Turnover | 0.67 | 0.50 |
| Fixed Asset Turnover | 6.76 | 7.34 |
| Payout ratio | 24.4% | 15.3% |
| Dividend yield | 0.96% | 0.32% |
| Fiscal Year | 2025 | 2024 |
Efficiency & Valuation Duel: The Vital Signs
Financial ratios serve as a company’s DNA, exposing hidden risks and revealing operational strengths essential for investment decisions.
Parker-Hannifin Corporation
Parker-Hannifin boasts a robust 25.8% ROE and a strong 17.8% net margin, signaling efficient profitability. However, its P/E of 25.4 and P/B of 6.55 suggest the stock trades at a premium. Dividend yield remains low at 0.96%, indicating a modest shareholder return strategy.
JBT Marel Corporation
JBT Marel shows weaker profitability with a 5.5% ROE and a 5.0% net margin, reflecting operational challenges. Its valuation appears stretched with a high P/E of 47.6 despite a more reasonable P/B of 2.63. Dividend yield is minimal at 0.32%, with limited shareholder returns evident.
Balanced Profitability vs. Stretched Valuation
Parker-Hannifin offers superior profitability metrics but trades at a premium, balancing risk and reward cautiously. JBT Marel’s weaker returns and elevated P/E heighten risk. Investors seeking operational efficiency may prefer Parker-Hannifin, while value-seekers should note JBT Marel’s stretched valuation profile.
Which one offers the Superior Shareholder Reward?
I compare Parker-Hannifin (PH) and JBT Marel (JBTM) on dividends, buybacks, and sustainability. PH yields ~1.0% with a 24% payout, well-covered by free cash flow (0.88 FCF/OCF ratio). PH also maintains steady buybacks, bolstering total return. JBTM’s yield is a mere 0.3%, with a low 15% payout and weaker free cash flow coverage (0.84). JBTM prefers reinvestment, but volatile margins and higher valuation (P/E ~48 vs. PH’s ~25) raise risk. PH’s balanced, sustainable distribution—dividends plus buybacks—offers a superior total return profile for 2026 investors.
Comparative Score Analysis: The Strategic Profile
The radar chart reveals the fundamental DNA and trade-offs of Parker-Hannifin Corporation and JBT Marel Corporation, highlighting their financial strengths and valuation nuances:
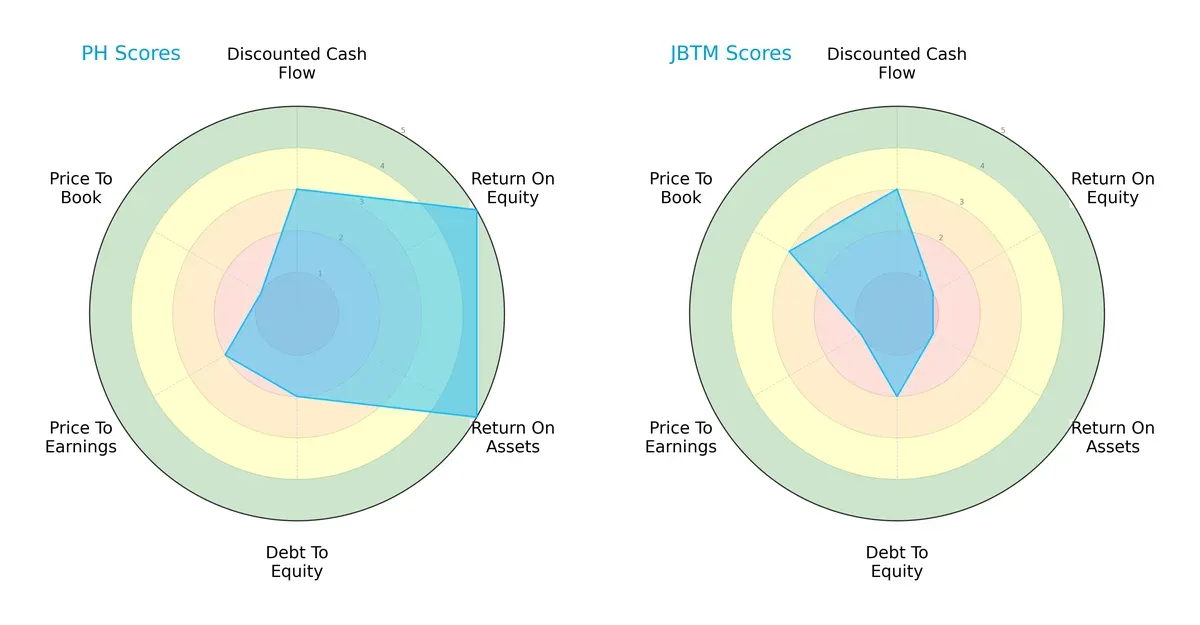
Parker-Hannifin shows a balanced profile with strong ROE and ROA scores (5 each), indicating efficient profit generation and asset use. Its debt-to-equity and valuation metrics are moderate to weak, signaling some leverage and premium pricing concerns. JBT Marel relies heavily on valuation edges with a moderate price-to-book score (3) but suffers from weak profitability metrics (ROE and ROA at 1), reflecting operational challenges. Overall, Parker-Hannifin offers more consistent financial health, while JBT Marel depends on selective valuation advantages.
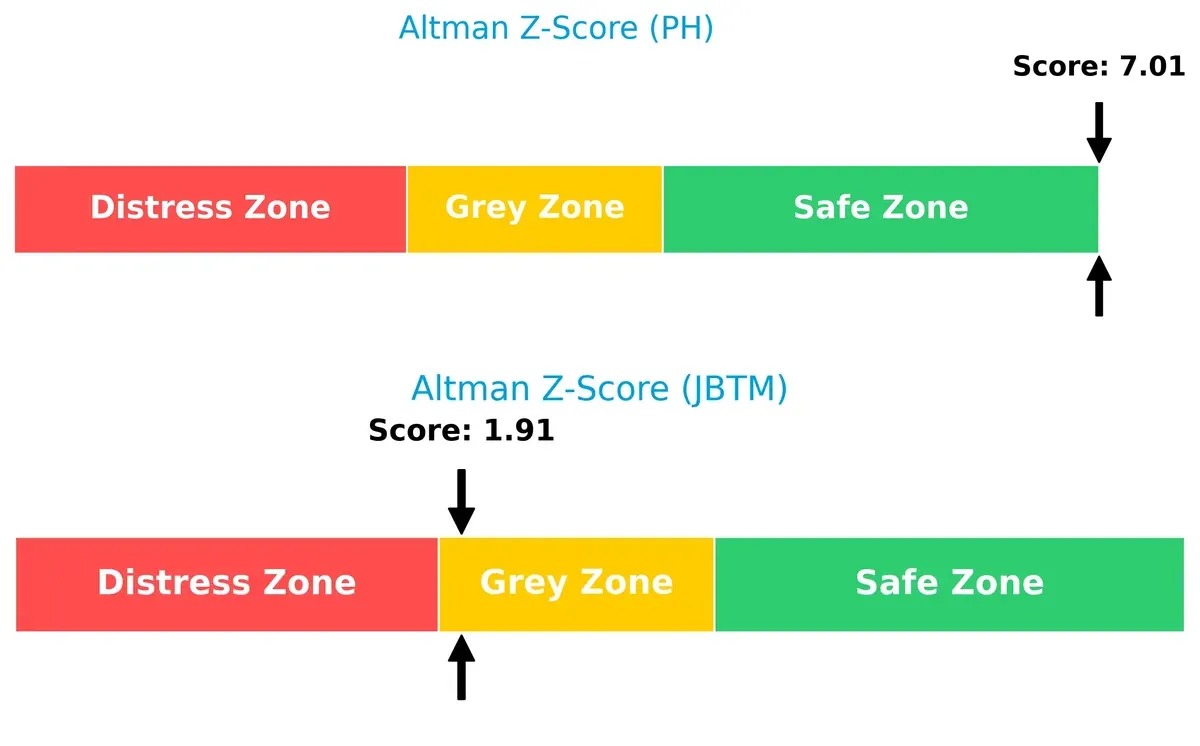
Bankruptcy Risk: Solvency Showdown
Parker-Hannifin’s Altman Z-Score of 7.0 places it firmly in the safe zone, while JBT Marel’s 1.9 hovers in the grey zone, signaling higher bankruptcy risk in this cycle:
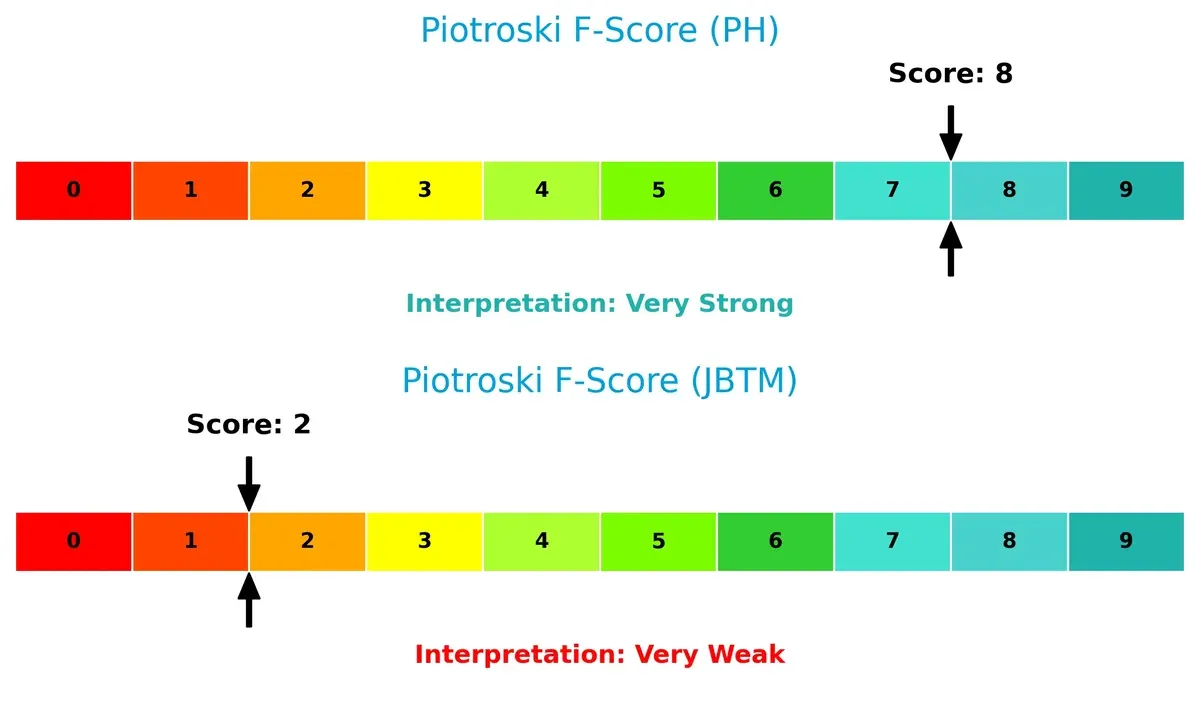
Financial Health: Quality of Operations
Parker-Hannifin’s Piotroski F-Score of 8 demonstrates very strong financial health and operational quality. JBT Marel’s score of 2 raises red flags, indicating weak internal financial metrics and caution for investors:
How are the two companies positioned?
This section dissects PH and JBTM’s operational DNA by comparing revenue distribution and internal dynamics. The goal is to confront their economic moats and identify which model offers the most resilient, sustainable competitive advantage today.
Revenue Segmentation: The Strategic Mix
The following visual comparison dissects how Parker-Hannifin Corporation and JBT Marel Corporation diversify their income streams and where their primary sector bets lie:
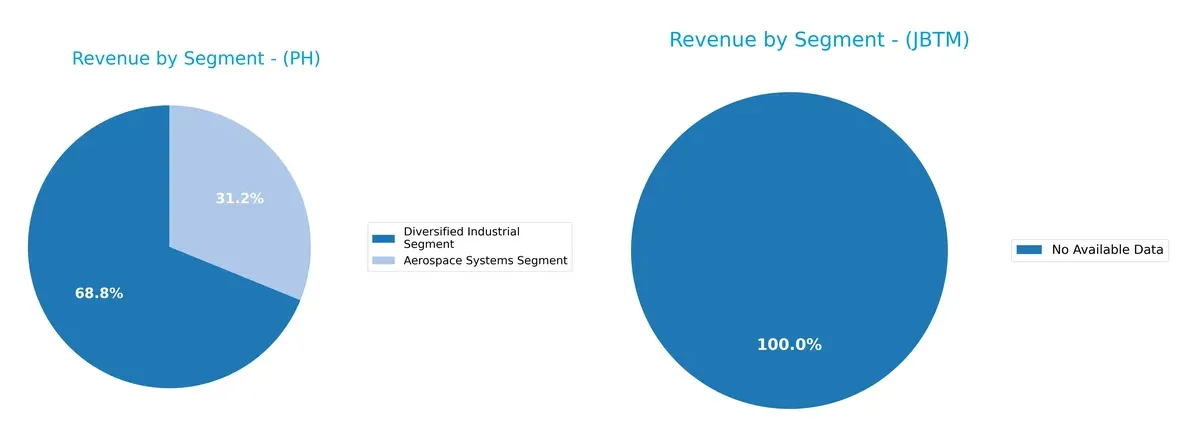
Parker-Hannifin relies heavily on its Diversified Industrial Segment, generating $13.7B in 2025, dwarfing its Aerospace Systems Segment at $6.2B. JBT Marel lacks reported data for segmentation, preventing direct comparison. Parker-Hannifin’s mix anchors its industrial infrastructure dominance but carries concentration risk. Its two-segment split shows moderate diversification, supporting resilience against sector volatility while leveraging aerospace growth opportunities.
Strengths and Weaknesses Comparison
This table compares the Strengths and Weaknesses of Parker-Hannifin Corporation and JBT Marel Corporation:
PH Strengths
- Diverse revenue from Aerospace and Industrial segments
- Strong profitability with 17.79% net margin and 25.81% ROE
- Favorable ROIC at 13.69% exceeding WACC
- Solid interest coverage ratio at 11.04
- Global presence with significant North America, Europe, Asia Pacific sales
JBTM Strengths
- Favorable WACC at 7.53% supports cost of capital
- Strong quick ratio at 3.04 indicating liquidity
- Favorable fixed asset turnover at 7.34 reflects efficiency
- Interest coverage at 5.92 ensures debt service ability
PH Weaknesses
- Elevated P/E at 25.38 and high P/B at 6.55 suggest rich valuation
- Quick ratio low at 0.71 may signal liquidity risks
- Dividend yield below 1% may deter income investors
- Moderate current ratio at 1.19 limits short-term flexibility
JBTM Weaknesses
- Weak profitability with 4.98% net margin and 5.53% ROE
- High P/E of 47.63 indicates expensive valuation
- Unfavorable current ratio at 3.48 raises working capital concerns
- Low dividend yield at 0.32% offers limited income
Parker-Hannifin shows robust profitability and diversified revenue streams, underpinning its global industrial presence. JBT Marel’s strengths lie in capital efficiency and liquidity, but its weak profitability and valuation metrics highlight operational challenges. Both companies face valuation concerns that may influence strategic financial decisions.
The Moat Duel: Analyzing Competitive Defensibility
A structural moat is the only thing protecting long-term profits from relentless competitive erosion. Let’s dissect the core moats at play:
Parker-Hannifin Corporation: Engineering Precision with a Durable Cost Advantage
Parker-Hannifin’s moat stems from its complex motion and control technologies, creating high switching costs. Its 22.75% EBIT margin and rising ROIC confirm efficient capital use. New aerospace and industrial innovations in 2026 could deepen this moat further.
JBT Marel Corporation: Niche Food Tech with a Fragile Margin Profile
JBT Marel relies on specialized food processing technology, but weaker EBIT margins at 6.69% and a shrinking ROIC signal a fragile moat. While expanding automation offers upside, market disruption risks loom large in 2026.
The Moat Battle: Industrial Engineering Scale vs. Specialized Food Tech Fragility
Parker-Hannifin’s 4.4% ROIC advantage over WACC and growing profitability reveal a wider, more durable moat. JBT Marel’s declining returns starkly contrast this strength. Parker-Hannifin is better equipped to defend and grow its market share.
Which stock offers better returns?
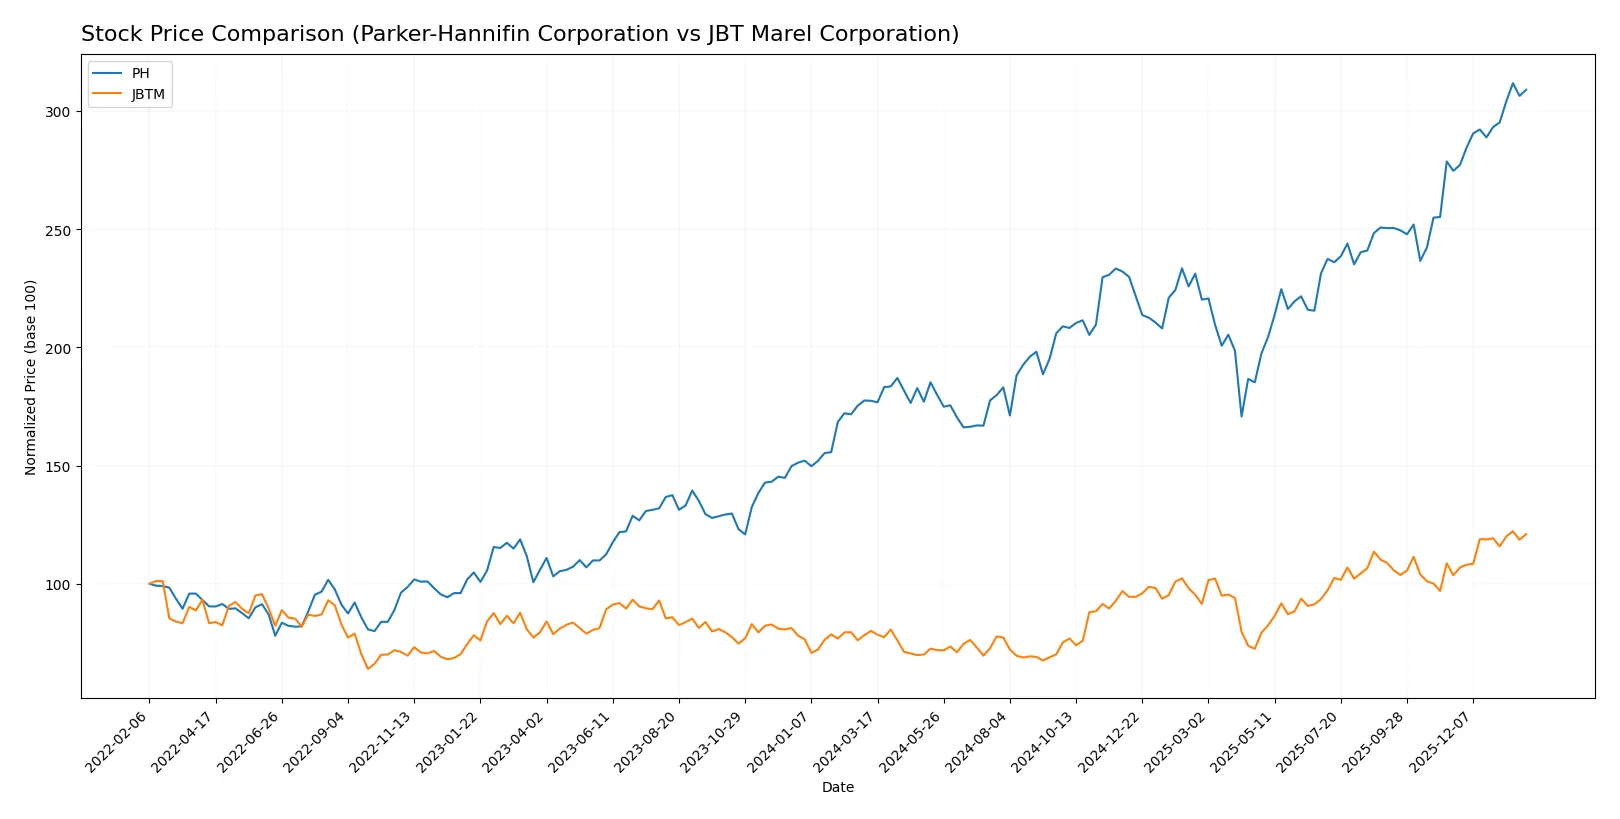
The past year shows strong upward momentum for both stocks, with Parker-Hannifin accelerating sharply from mid-2025 while JBT Marel exhibits steady gains and moderate volatility.
Trend Comparison
Parker-Hannifin’s stock rose 74.16% over the past 12 months, displaying a bullish trend with accelerating gains and high volatility, hitting a peak near 944.27.
JBT Marel’s stock increased 51.1% in the same period, also bullish with acceleration but less volatile, reaching a high of 158.88.
Parker-Hannifin outperformed JBT Marel significantly, delivering the highest market returns and stronger price momentum over the last year.
Target Prices
Analysts present a confident target consensus for Parker-Hannifin Corporation and JBT Marel Corporation.
| Company | Target Low | Target High | Consensus |
|---|---|---|---|
| Parker-Hannifin Corporation | 825 | 1,139 | 995.46 |
| JBT Marel Corporation | 169 | 180 | 174.5 |
The target consensus for Parker-Hannifin at 995.46 suggests a modest upside versus the current 935.84 price. JBT Marel’s consensus at 174.5 similarly indicates potential appreciation from the current 157.31 level.

Don’t Let Luck Decide Your Entry Point
Optimize your entry points with our advanced ProRealTime indicators. You’ll get efficient buy signals with precise price targets for maximum performance. Start outperforming now!
How do institutions grade them?
Parker-Hannifin Corporation Grades
The following table summarizes recent grades given to Parker-Hannifin Corporation by major institutions:
| Grading Company | Action | New Grade | Date |
|---|---|---|---|
| Wells Fargo | maintain | Overweight | 2026-01-30 |
| Citigroup | maintain | Buy | 2026-01-30 |
| JP Morgan | maintain | Overweight | 2026-01-30 |
| Jefferies | maintain | Buy | 2026-01-30 |
| Barclays | maintain | Overweight | 2026-01-30 |
| Stifel | maintain | Hold | 2026-01-30 |
| Stifel | maintain | Hold | 2026-01-23 |
| JP Morgan | maintain | Overweight | 2026-01-16 |
| Morgan Stanley | maintain | Equal Weight | 2026-01-14 |
| Barclays | maintain | Overweight | 2026-01-07 |
JBT Marel Corporation Grades
Recent institutional grades for JBT Marel Corporation appear as follows:
| Grading Company | Action | New Grade | Date |
|---|---|---|---|
| Jefferies | upgrade | Buy | 2025-12-10 |
| William Blair | upgrade | Outperform | 2025-08-06 |
Which company has the best grades?
Parker-Hannifin holds mostly Overweight and Buy grades, showing broad institutional confidence. JBT Marel’s upgrades to Buy and Outperform indicate improving sentiment. Investors may view Parker-Hannifin as more consistently favored but should monitor JBT Marel’s positive momentum.
Risks specific to each company
The following categories identify critical pressure points and systemic threats facing Parker-Hannifin Corporation and JBT Marel Corporation in the 2026 market environment:
1. Market & Competition
Parker-Hannifin Corporation
- Established industrial machinery leader with diversified aerospace and industrial segments; faces intense global competition and technological disruption.
JBT Marel Corporation
- Niche food and beverage technology provider; growth constrained by specialized markets and competitive pressure from larger industrial automation firms.
2. Capital Structure & Debt
Parker-Hannifin Corporation
- Moderate debt-to-equity ratio (0.69), interest coverage strong at 11x; balanced leverage supports expansion without excessive risk.
JBT Marel Corporation
- Slightly higher debt ratio (0.81), interest coverage more strained at 5.9x; elevated leverage increases financial risk amid volatile earnings.
3. Stock Volatility
Parker-Hannifin Corporation
- Beta of 1.25 indicates moderate sensitivity to market swings; stock price range is broad, reflecting cyclical industrial exposure.
JBT Marel Corporation
- Beta near 1.0 suggests stock moves closely with market; price range narrower but valuation is more volatile due to sector focus.
4. Regulatory & Legal
Parker-Hannifin Corporation
- Exposure to aerospace regulations and defense contracts adds complexity; compliance costs and geopolitical shifts pose ongoing challenges.
JBT Marel Corporation
- Food safety and international trade regulations dominate; recent name change signals strategic repositioning but regulatory compliance remains critical.
5. Supply Chain & Operations
Parker-Hannifin Corporation
- Complex global supply chain servicing multiple industries; risks include raw material costs and logistics disruptions.
JBT Marel Corporation
- Supply chain concentrated on food processing components; vulnerable to raw material price swings and regional operational bottlenecks.
6. ESG & Climate Transition
Parker-Hannifin Corporation
- Increasing pressure to reduce carbon footprint in aerospace and industrial sectors; ESG initiatives are capital intensive but necessary for long-term viability.
JBT Marel Corporation
- Focus on sustainability in food processing offers opportunities; however, climate risks and energy use remain key challenges.
7. Geopolitical Exposure
Parker-Hannifin Corporation
- Significant exposure due to global aerospace and defense sales; geopolitical tensions could disrupt contracts and supply chains.
JBT Marel Corporation
- Operations spread across diverse regions; geopolitical instability could affect export markets and regulatory environments.
Which company shows a better risk-adjusted profile?
Parker-Hannifin faces its greatest risk in geopolitical exposure due to aerospace dependencies, yet its strong financial health and conservative leverage provide a cushion. JBT Marel’s biggest risk lies in weak profitability and financial stability, reflected in poor Altman Z and Piotroski scores. Parker-Hannifin’s superior risk-adjusted profile is confirmed by its very strong financial scores versus JBT’s precarious grey zone and weak operational metrics. Notably, Parker-Hannifin’s Altman Z-score of 7.0 signals robust bankruptcy safety, contrasting sharply with JBT’s borderline 1.9, underscoring the latter’s vulnerability.
Final Verdict: Which stock to choose?
Parker-Hannifin’s superpower lies in its durable competitive moat, consistently generating returns well above its cost of capital. Its robust profitability and improving operational efficiency underpin a strong cash generation machine. However, cautious investors should monitor its moderate liquidity as a point of vigilance. It suits portfolios targeting aggressive growth with resilience.
JBT Marel’s strategic moat centers on its strong balance sheet and high liquidity, offering a safer harbor amid market volatility. Despite weaker profitability metrics and declining ROIC, its operational cash flow stability supports a more conservative risk profile. It fits well with GARP investors seeking measured growth at a reasonable price.
If you prioritize long-term value creation and superior profitability, Parker-Hannifin outshines due to its expanding economic moat and strong income growth. However, if you seek safety and liquidity with less emphasis on rapid earnings expansion, JBT Marel offers better stability and downside protection. Each represents distinct analytical scenarios tailored to different investor risk appetites.
Disclaimer: Investment carries a risk of loss of initial capital. The past performance is not a reliable indicator of future results. Be sure to understand risks before making an investment decision.
Go Further
I encourage you to read the complete analyses of Parker-Hannifin Corporation and JBT Marel Corporation to enhance your investment decisions: