Home > Comparison > Industrials > OTIS vs JBTM
The strategic rivalry between Otis Worldwide Corporation and JBT Marel Corporation defines key dynamics within the Industrials sector. Otis operates as a capital-intensive machinery manufacturer specializing in elevators and escalators, while JBT Marel focuses on high-technology solutions for food processing and automation. This analysis contrasts their divergent models to identify which company presents a superior risk-adjusted opportunity for diversified investors seeking exposure to industrial innovation and operational resilience.
Table of contents
Companies Overview
Two key players shape the industrial machinery landscape with distinct market footprints and innovative approaches.
Otis Worldwide Corporation: Elevating Global Infrastructure
Otis commands a dominant position as a manufacturer and servicer of elevators and escalators. Its revenue stems from new equipment sales and a vast service network of 34,000 mechanics supporting maintenance and modernization. In 2026, Otis emphasizes expanding its service footprint and upgrading existing installations to capitalize on urban infrastructure growth worldwide.
JBT Marel Corporation: Innovating Food and Beverage Processing
JBT Marel leads in technology-driven solutions for food and beverage processing across global markets. It generates revenue through a diversified portfolio of processing and packaging systems spanning numerous sectors. In 2026, the company focuses on integrating automation and advanced material handling to enhance efficiency and meet evolving industry demands.
Strategic Collision: Similarities & Divergences
Both companies operate in industrial machinery yet diverge sharply in their business philosophies—Otis builds a closed ecosystem around building infrastructure, while JBT Marel embraces open, modular technology for varied food processing needs. Their primary battleground lies in leveraging innovation to deepen client engagement. Otis offers steady recurring service revenues; JBT Marel targets growth through cutting-edge product development, reflecting distinct investment risk and return profiles.
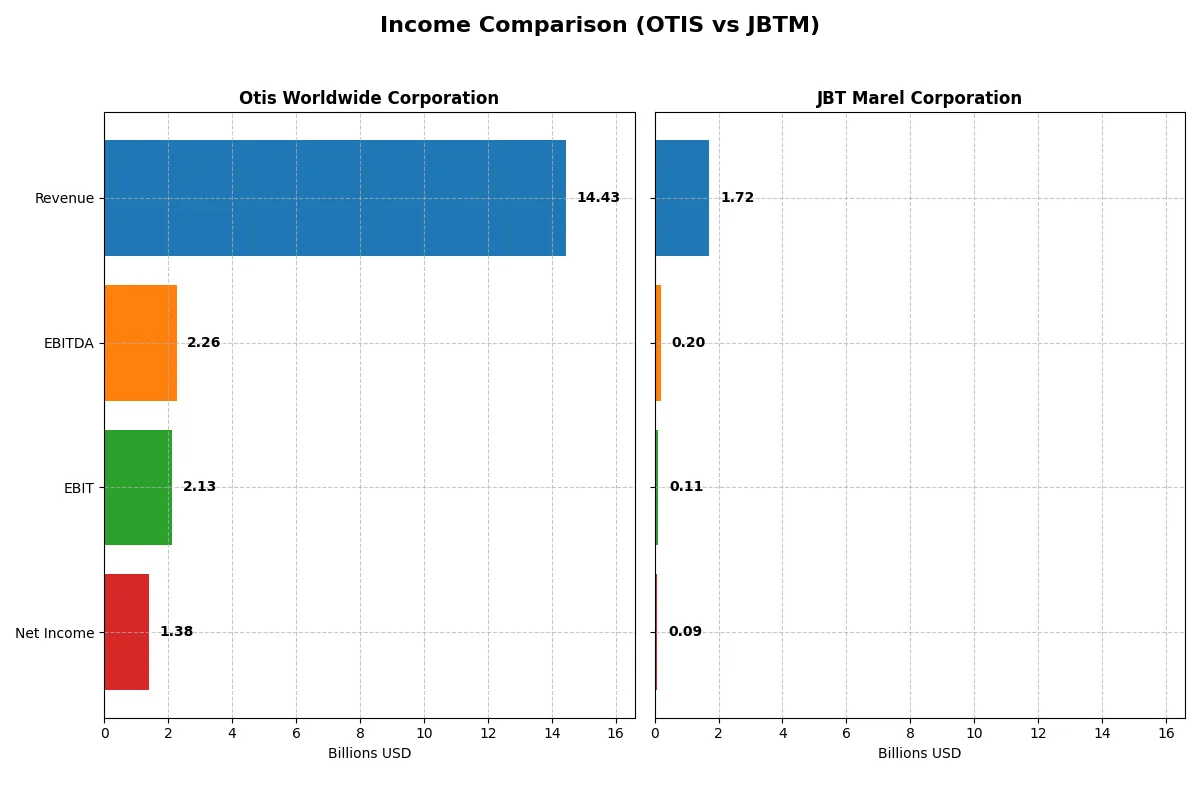
Income Statement Comparison
This data dissects the core profitability and scalability of both corporate engines to reveal who dominates the bottom line:
| Metric | Otis Worldwide Corporation (OTIS) | JBT Marel Corporation (JBTM) |
|---|---|---|
| Revenue | 14.43B | 1.72B |
| Cost of Revenue | 10.04B | 1.09B |
| Operating Expenses | 2.20B | 508M |
| Gross Profit | 4.40B | 626M |
| EBITDA | 2.26B | 204M |
| EBIT | 2.13B | 115M |
| Interest Expense | 196M | 19.4M |
| Net Income | 1.38B | 85.4M |
| EPS | 3.53 | 2.67 |
| Fiscal Year | 2025 | 2024 |
Income Statement Analysis: The Bottom-Line Duel
This income statement comparison reveals which company operates with superior efficiency and profitability in their respective markets.
Otis Worldwide Corporation Analysis
Otis shows stable revenue growth around 14.4B to 14.6B over recent years with net income rising from 1.25B in 2022 to 1.38B in 2025. Gross and net margins remain healthy, at roughly 30.5% and 9.6% respectively, signaling strong cost control. The 2025 year marks slight revenue growth but a net income dip, reflecting margin pressure amid efficient operating expense management.
JBT Marel Corporation Analysis
JBT Marel’s revenue hovers near 1.7B in 2024, with net income sharply declining from 583M in 2023 to 85M in 2024. Its gross margin at 36.5% is solid, but net margin drops to 5%, revealing rising costs or operational challenges. The steep net income and EPS contraction in 2024 highlights deteriorating profitability despite modest revenue growth.
Margin Resilience vs. Earnings Volatility
Otis outperforms JBTM with consistent margin expansion and positive net income growth over the period. JBTM’s volatile earnings and shrinking net margins undermine its operational efficiency. For investors prioritizing stability and margin durability, Otis presents a more attractive profile given its demonstrated ability to sustain profits amid modest top-line growth.
Financial Ratios Comparison
These vital ratios act as a diagnostic tool to expose the underlying fiscal health, valuation premiums, and capital efficiency of the companies compared:
| Ratios | Otis Worldwide Corporation (OTIS) | JBT Marel Corporation (JBTM) |
|---|---|---|
| ROE | -25.7% (2025) | 5.53% (2024) |
| ROIC | 40.7% (2025) | 3.65% (2024) |
| P/E | 24.8x (2025) | 47.6x (2024) |
| P/B | -6.38 (2025) | 2.63 (2024) |
| Current Ratio | 0.85 (2025) | 3.48 (2024) |
| Quick Ratio | 0.77 (2025) | 3.04 (2024) |
| D/E (Debt-to-Equity) | -1.62 (2025) | 0.81 (2024) |
| Debt-to-Assets | 82.1% (2025) | 36.7% (2024) |
| Interest Coverage | 11.2x (2025) | 6.10x (2024) |
| Asset Turnover | 1.35 (2025) | 0.50 (2024) |
| Fixed Asset Turnover | 11.1 (2025) | 7.34 (2024) |
| Payout Ratio | 46.7% (2025) | 15.3% (2024) |
| Dividend Yield | 1.88% (2025) | 0.32% (2024) |
| Fiscal Year | 2025 | 2024 |
Efficiency & Valuation Duel: The Vital Signs
Ratios act as a company’s DNA, revealing hidden risks and operational excellence that influence investment decisions deeply.
Otis Worldwide Corporation
Otis shows a mixed profitability profile with a negative ROE of -25.7% but a strong ROIC at 40.7%, indicating efficient capital use despite shareholder equity struggles. The stock trades at a neutral P/E of 24.85 and offers a modest 1.88% dividend yield, balancing risk with steady shareholder returns.
JBT Marel Corporation
JBT Marel posts modest profitability with a 5.5% ROE and a low 3.7% ROIC, suggesting operational inefficiency. The stock appears expensive with a high P/E of 47.63, and dividends are minimal at 0.32%, reflecting limited direct returns and a cautious reinvestment approach.
Premium Valuation vs. Operational Safety
Otis balances risk and reward with efficient capital deployment and moderate valuation, despite equity challenges. JBT Marel’s stretched valuation and weaker profitability raise concerns. Investors seeking operational strength may lean toward Otis, while those favoring growth potential face higher risk with JBT Marel.
Which one offers the Superior Shareholder Reward?
Otis Worldwide Corporation delivers a higher dividend yield near 1.9% with a prudent payout ratio of 37-47%, backed by strong free cash flow coverage (~90%). Its steady buyback program complements distributions, sustaining shareholder value. JBT Marel Corporation offers a minimal dividend yield (~0.3-0.4%) and lower payout ratio (~15%), prioritizing reinvestment in growth. However, its buybacks are less consistent and free cash flow coverage weaker. I find Otis’s balanced distribution model more sustainable and attractive for long-term total return in 2026.
Comparative Score Analysis: The Strategic Profile
The radar chart reveals the fundamental DNA and trade-offs of Otis Worldwide Corporation and JBT Marel Corporation, highlighting their financial strengths and weaknesses side by side:
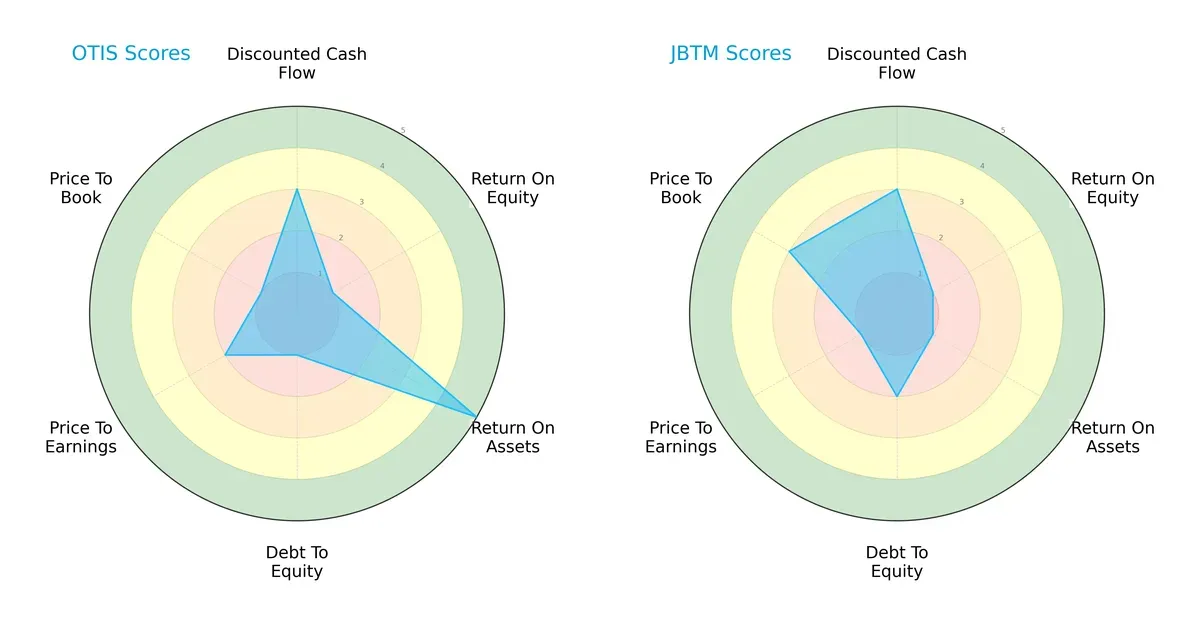
Otis shows a superior return on assets (5 vs. 1) but struggles with debt-to-equity and valuation metrics. JBT Marel holds a more moderate debt profile and better price-to-book score but falls short on asset efficiency and valuation. Otis’s profile is less balanced, relying heavily on operational efficiency, while JBTM’s stands as more diversified yet weaker overall.
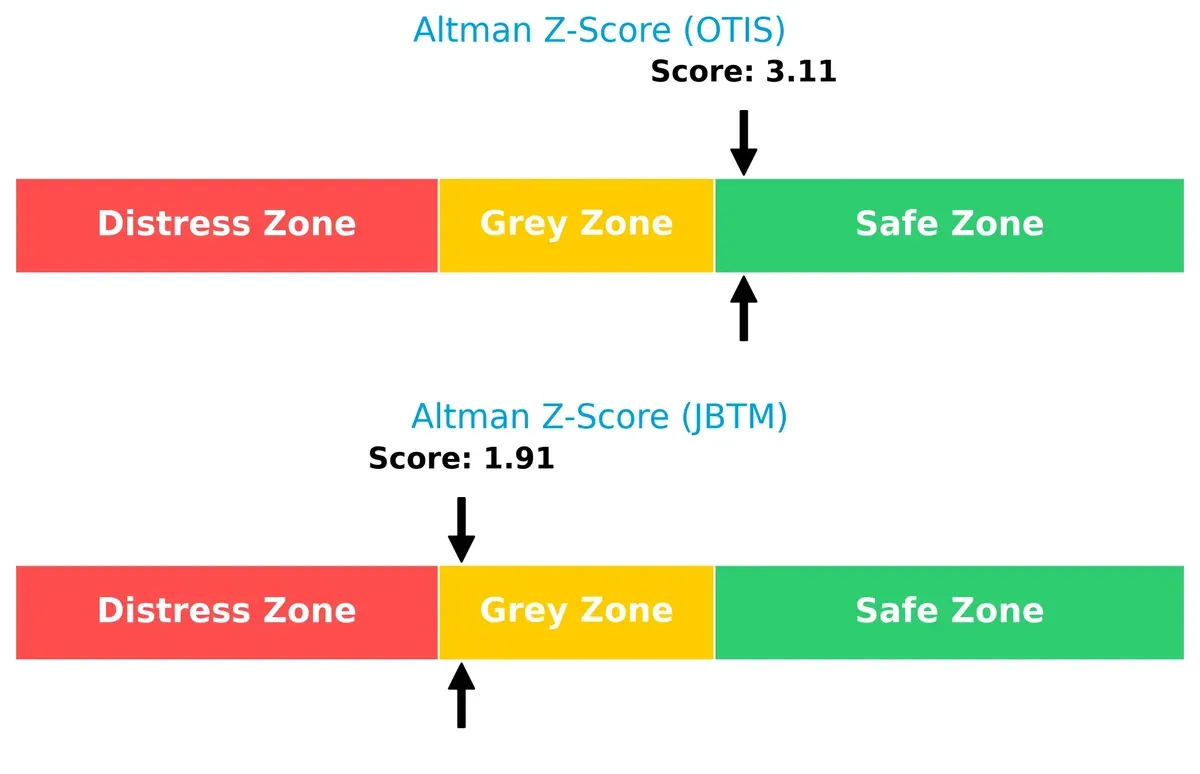
Bankruptcy Risk: Solvency Showdown
Otis’s Altman Z-Score of 3.11 places it firmly in the safe zone, signaling robust financial stability. JBT Marel’s 1.91 score lands in the grey zone, indicating moderate bankruptcy risk in this cycle:
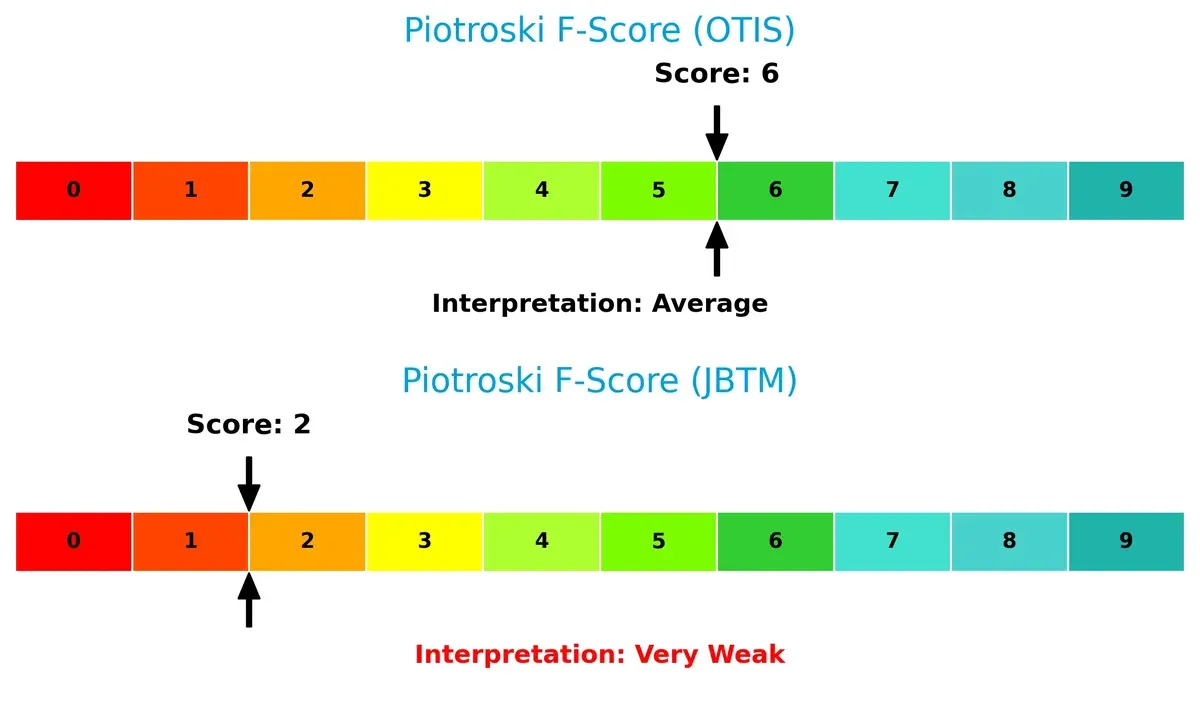
Financial Health: Quality of Operations
Otis’s Piotroski F-Score of 6 suggests average financial health and operational quality. JBT Marel’s score of 2 flags significant red flags and underlying financial weakness compared to Otis:
How are the two companies positioned?
This section dissects Otis and JBTM’s operational DNA by comparing their revenue distribution and internal dynamics. The goal is to confront their economic moats and reveal which model sustains a stronger competitive advantage today.
Revenue Segmentation: The Strategic Mix
The following visual comparison dissects how both firms diversify their income streams and where their primary sector bets lie:
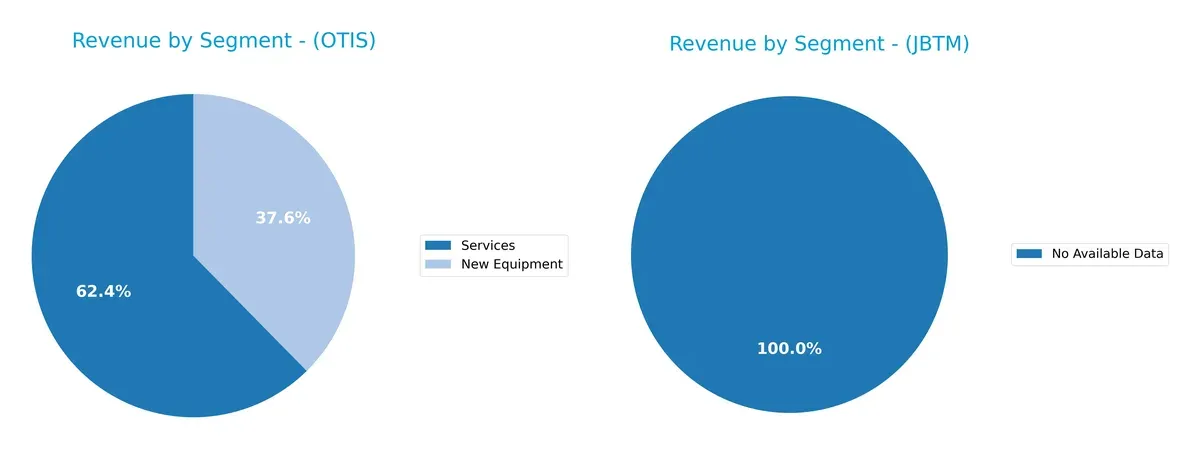
Otis Worldwide anchors its revenue in two key segments: Services at $8.9B and New Equipment at $5.4B in 2024. This mix shows a balanced diversification, reducing concentration risk while leveraging recurring service income. JBT Marel lacks available data, preventing a direct comparison. Otis’s dual focus supports ecosystem lock-in, with services providing stable cash flow and equipment sales driving growth, a strategic edge in infrastructure dominance.
Strengths and Weaknesses Comparison
This table compares the Strengths and Weaknesses of Otis Worldwide Corporation and JBT Marel Corporation:
Otis Strengths
- Strong profitability with 40.74% ROIC above 7.36% WACC
- Favorable asset and fixed asset turnover rates
- High interest coverage ratio at 10.87
- Balanced revenue from new equipment and services
- Diversified global sales including China and US markets
JBTM Strengths
- Favorable WACC at 7.53% supports capital cost control
- Quick ratio favorable at 3.04 indicating liquidity
- Interest coverage ratio of 5.92 supports debt service
- Favorable fixed asset turnover at 7.34
Otis Weaknesses
- Negative ROE at -25.67% signals shareholder return issues
- Low current and quick ratios below 1 indicating liquidity concerns
- High debt-to-assets at 82.14% poses leverage risk
- Negative PB ratio suggests market valuation challenges
- Net margin only neutral at 9.59%
JBTM Weaknesses
- Low net margin at 4.98% and ROIC at 3.65% signal weak profitability
- Elevated PE ratio at 47.63 indicates possible overvaluation
- Current ratio high at 3.48 but unfavorable status questions working capital use
- Low dividend yield at 0.32% may deter income investors
Otis exhibits operational strength with efficient capital use and a diversified revenue base but faces liquidity and leverage concerns. JBTM shows liquidity advantages and asset efficiency, yet profitability and valuation metrics raise caution. Each company’s financial profile shapes its strategic focus on balancing growth and risk.
The Moat Duel: Analyzing Competitive Defensibility
A structural moat is the only true shield protecting long-term profits from relentless competitive erosion in capital-intensive industries:
Otis Worldwide Corporation: Durable Network Effects Moat
Otis leverages its vast service network and installed base to generate stable, recurring revenue with a high ROIC of 33%. Its expanding global footprint, especially in China and the U.S., underpins durable pricing power and margin resilience in 2026.
JBT Marel Corporation: Challenged Innovation and Scale Moat
JBTM’s moat relies on specialized food processing tech but lacks Otis’s scale and network. Its declining ROIC and shrinking margins signal weakening competitive positioning amid intensifying industry pressures in 2026.
Network Effects vs. Innovation Scale: Who Defends Profit Pools Better?
Otis boasts a wider, more durable moat driven by network effects and service lock-in, while JBTM struggles with value destruction and margin compression. Otis stands better equipped to defend market share long term.
Which stock offers better returns?
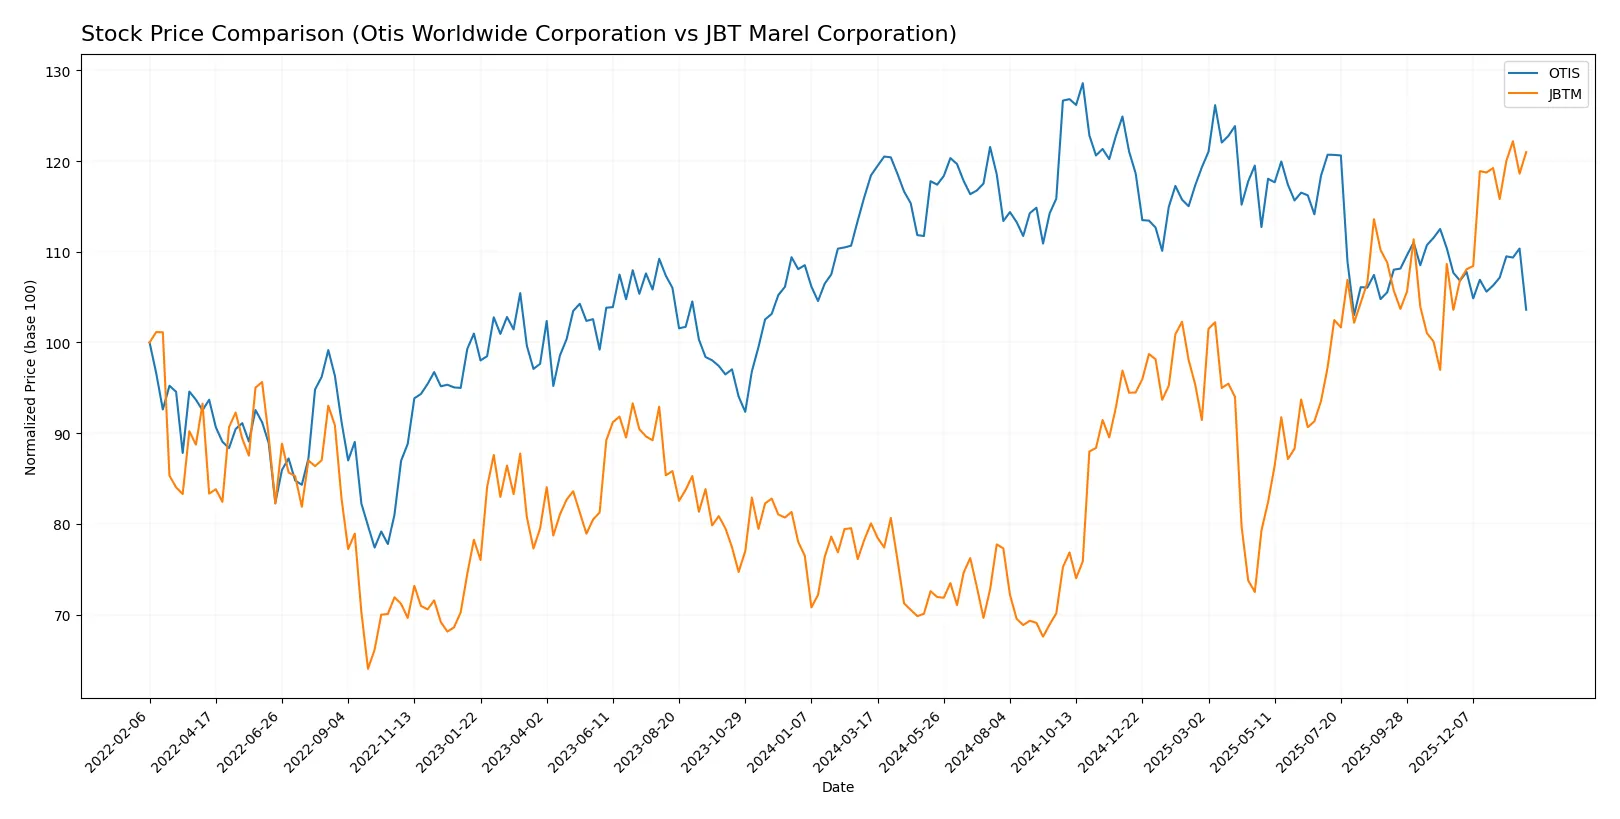
Over the past year, Otis Worldwide Corporation’s stock declined steadily, while JBT Marel Corporation surged sharply, showing contrasting trading dynamics and investor sentiment.
Trend Comparison
Otis Worldwide Corporation’s stock fell 12.51% over the past 12 months, marking a bearish trend with accelerating decline. The price ranged between 106.01 and 84.93.
JBT Marel Corporation’s stock rose 51.1% over the last year, reflecting a strong bullish trend with accelerating gains. Prices fluctuated widely from 87.85 to 158.88.
JBT Marel outperformed Otis by a wide margin, delivering the highest market performance with robust upward momentum throughout the period.
Target Prices
Analysts present a cautiously optimistic consensus for Otis Worldwide Corporation and JBT Marel Corporation.
| Company | Target Low | Target High | Consensus |
|---|---|---|---|
| Otis Worldwide Corporation | 92 | 109 | 97.75 |
| JBT Marel Corporation | 169 | 180 | 174.5 |
Otis trades well below its consensus target, suggesting upside potential. JBT Marel’s target prices imply moderate appreciation from the current price, reflecting analyst confidence.

Don’t Let Luck Decide Your Entry Point
Optimize your entry points with our advanced ProRealTime indicators. You’ll get efficient buy signals with precise price targets for maximum performance. Start outperforming now!
How do institutions grade them?
Here is an overview of recent institutional grades for Otis Worldwide Corporation and JBT Marel Corporation:
Otis Worldwide Corporation Grades
The table below summarizes recent grades from reputable financial institutions for Otis Worldwide Corporation.
| Grading Company | Action | New Grade | Date |
|---|---|---|---|
| JP Morgan | Maintain | Overweight | 2026-01-16 |
| Wells Fargo | Maintain | Equal Weight | 2025-12-15 |
| Barclays | Maintain | Underweight | 2025-10-30 |
| JP Morgan | Maintain | Overweight | 2025-10-15 |
| Wolfe Research | Upgrade | Outperform | 2025-10-08 |
| Wells Fargo | Maintain | Equal Weight | 2025-10-06 |
| JP Morgan | Maintain | Overweight | 2025-09-18 |
| RBC Capital | Maintain | Outperform | 2025-07-28 |
| Wolfe Research | Upgrade | Peer Perform | 2025-07-25 |
| Wells Fargo | Maintain | Equal Weight | 2025-07-24 |
JBT Marel Corporation Grades
The table below summarizes recent grades from reputable financial institutions for JBT Marel Corporation.
| Grading Company | Action | New Grade | Date |
|---|---|---|---|
| Jefferies | Upgrade | Buy | 2025-12-10 |
| William Blair | Upgrade | Outperform | 2025-08-06 |
Which company has the best grades?
JBT Marel Corporation holds stronger recent upgrades, including a Buy and Outperform rating. Otis Worldwide shows mixed grades with several Overweight and Outperform marks but also Underweight and Equal Weight. Investors may interpret JBT Marel’s upgrades as a clearer positive signal.
Risks specific to each company
In the complex 2026 market environment, the following categories reveal the critical pressure points and systemic threats facing both Otis Worldwide Corporation and JBT Marel Corporation:
1. Market & Competition
Otis Worldwide Corporation
- Faces mature elevator market with stable demand but intense competition in modernization services.
JBT Marel Corporation
- Operates in diverse food tech markets; faces rapid innovation and strong competition in automation solutions.
2. Capital Structure & Debt
Otis Worldwide Corporation
- High debt-to-assets ratio at 82.14% signals leverage risk despite strong interest coverage.
JBT Marel Corporation
- Moderate leverage with 36.68% debt-to-assets; current ratio very high at 3.48, but quick ratio signals liquidity strength.
3. Stock Volatility
Otis Worldwide Corporation
- Beta near 1.01 implies market-level volatility; recent price range stable between $84 and $106.
JBT Marel Corporation
- Beta near 1.00 indicates market-correlated volatility; wider trading range from $90 to $160 suggests higher price swings.
4. Regulatory & Legal
Otis Worldwide Corporation
- Subject to building codes and safety regulations worldwide; compliance costs can pressure margins.
JBT Marel Corporation
- Food safety and environmental regulations impose compliance costs; global reach increases exposure to varying standards.
5. Supply Chain & Operations
Otis Worldwide Corporation
- Large global footprint with 34,000 service mechanics; supply chain disruptions could delay installations and maintenance.
JBT Marel Corporation
- Complex, multi-industry supply chain; dependence on robotics and automation components vulnerable to semiconductor shortages.
6. ESG & Climate Transition
Otis Worldwide Corporation
- Faces pressure to decarbonize manufacturing and service fleets; ESG initiatives critical for contract wins.
JBT Marel Corporation
- Needs to innovate sustainable food processing technologies rapidly; ESG compliance affects customer contracts and investor appeal.
7. Geopolitical Exposure
Otis Worldwide Corporation
- Significant exposure to U.S. and China markets; trade tensions could impact new equipment sales.
JBT Marel Corporation
- Operates across Americas, EMEA, and Asia-Pacific; geopolitical instability threatens supply continuity and sales growth.
Which company shows a better risk-adjusted profile?
Otis Worldwide faces its biggest risk in its high leverage, risking financial flexibility despite solid operating profits. JBT Marel’s main risk lies in weak profitability metrics and operational complexity amid volatile markets. Otis’s Altman Z-Score of 3.11 places it in the safe zone, while JBT’s 1.91 signals moderate distress. Otis shows a better risk-adjusted profile, bolstered by stronger ROIC and asset turnover despite debt risks. JBT’s very weak Piotroski score of 2 highlights fragile financial health, reflecting recent margin pressures and high P/E valuation that concern me.
Final Verdict: Which stock to choose?
Otis Worldwide Corporation stands out with a durable competitive advantage powered by its exceptional capital efficiency. Its ability to generate returns well above its cost of capital signals a strong economic moat. The main point of vigilance is its stretched liquidity position, which could pressure short-term operations. Otis suits portfolios seeking disciplined, long-term value creation.
JBT Marel Corporation’s key strength lies in its innovative product niche and high-quality income generation, supported by solid liquidity and a conservative debt profile. However, its declining profitability and negative value creation warn of operational challenges ahead. It fits investors who prioritize strategic growth potential but require a cautious allocation due to financial volatility.
If you prioritize steady value creation and robust capital returns, Otis is the compelling choice due to its proven moat and disciplined capital allocation. However, if you seek growth with a focus on liquidity safety and can tolerate operational risks, JBTM offers superior short-term momentum and innovation exposure. Both require careful risk monitoring aligned with your investment horizon.
Disclaimer: Investment carries a risk of loss of initial capital. The past performance is not a reliable indicator of future results. Be sure to understand risks before making an investment decision.
Go Further
I encourage you to read the complete analyses of Otis Worldwide Corporation and JBT Marel Corporation to enhance your investment decisions: