In today’s dynamic industrial machinery sector, JBT Marel Corporation and Nano Nuclear Energy Inc represent two intriguing investment options. JBT Marel is an established player offering advanced food processing technologies globally, while Nano Nuclear Energy pioneers innovative microreactor solutions in nuclear energy. Their contrasting approaches to industry innovation and market presence make this comparison essential. Join me as we explore which company holds the greatest potential for your investment portfolio.
Table of contents
Companies Overview
I will begin the comparison between JBT Marel Corporation and Nano Nuclear Energy Inc by providing an overview of these two companies and their main differences.
JBT Marel Corporation Overview
JBT Marel Corporation provides technology solutions to the food and beverage industry across multiple regions including North America, Europe, and Asia Pacific. The company offers a wide range of processing and packaging solutions, as well as automated guided vehicle systems for manufacturing and warehousing. Formerly known as John Bean Technologies Corporation, it is headquartered in Chicago and employs about 11,700 people.
Nano Nuclear Energy Inc Overview
Nano Nuclear Energy Inc operates in the microreactor technology sector, developing solid-core and low-pressure coolant reactors. It also works on fuel fabrication and nuclear consultation services. Founded in 2021 and based in New York City, NNE is a much smaller company with only 5 employees, focusing on innovative nuclear energy solutions within the industrial machinery industry.
Key similarities and differences
Both companies operate in the industrial machinery sector and are publicly traded in the US, but they differ significantly in scale and focus. JBT Marel serves diverse food-related industries with extensive processing technologies, while NNE concentrates on cutting-edge nuclear microreactor development. Additionally, JBT Marel has a broad global presence and workforce, whereas NNE is a small, specialized firm focused on nuclear energy innovation.
Income Statement Comparison
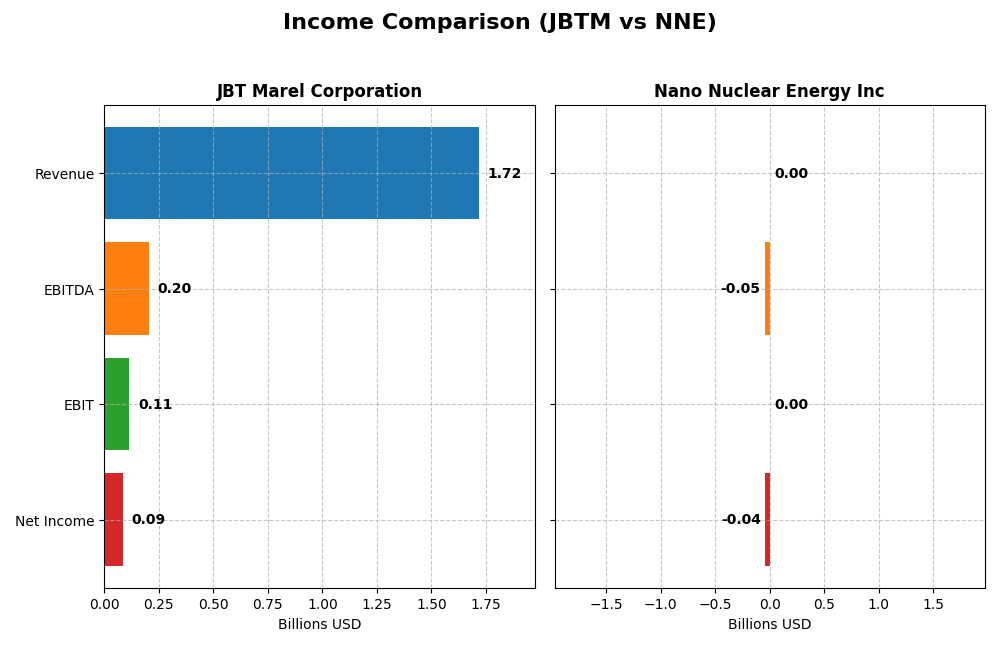
The table below compares the most recent fiscal year income statement figures for JBT Marel Corporation and Nano Nuclear Energy Inc, highlighting key financial metrics.
| Metric | JBT Marel Corporation | Nano Nuclear Energy Inc |
|---|---|---|
| Market Cap | 8.11B | 1.33B |
| Revenue | 1.72B | 0 |
| EBITDA | 204.2M | -46.2M |
| EBIT | 114.8M | 0 |
| Net Income | 85.4M | -40.1M |
| EPS | 2.67 | -1.06 |
| Fiscal Year | 2024 | 2025 |
Income Statement Interpretations
JBT Marel Corporation
JBTM’s revenue showed a slight increase from $1.4B in 2021 to $1.72B in 2024, but net income declined overall, from $119M in 2021 to $85M in 2024. Margins have been mixed, with gross margin favorable at 36.5% yet EBIT and net margins showing neutral to unfavorable trends. The latest year saw a slowdown in EBIT and net income growth, reflecting margin pressures despite revenue growth.
Nano Nuclear Energy Inc
NNE has reported zero revenue across recent years, with consistent net losses expanding from around -$1M in 2022 to -$40M in 2025. Margins remain unfavorable due to ongoing operating expenses and no sales. While gross profit and EBIT growth appear favorable, this is from a base of zero revenue, indicating continued developmental stage losses without profitability or positive margin improvements.
Which one has the stronger fundamentals?
Neither company exhibits strong fundamentals currently, with both showing unfavorable global income statement evaluations. JBTM generates substantial revenue and maintains positive margins, but suffers declining profitability. NNE’s lack of revenue and persistent losses weigh heavily on its profile, despite some favorable growth metrics from a zero base. Overall, JBTM’s scale and positive gross margins suggest relatively better fundamentals.
Financial Ratios Comparison
The table below presents key financial ratios for JBT Marel Corporation (JBTM) and Nano Nuclear Energy Inc (NNE) based on their most recent fiscal year data, allowing a side-by-side evaluation of their financial health and performance.
| Ratios | JBT Marel Corporation (2024) | Nano Nuclear Energy Inc (2025) |
|---|---|---|
| ROE | 5.53% | -18.00% |
| ROIC | 3.65% | -20.51% |
| P/E | 47.63 | -0.04 |
| P/B | 2.63 | 0.007 |
| Current Ratio | 3.48 | 53.48 |
| Quick Ratio | 3.04 | 53.48 |
| D/E (Debt-to-Equity) | 0.81 | 0.013 |
| Debt-to-Assets | 36.68% | 1.22% |
| Interest Coverage | 6.10 | 0 |
| Asset Turnover | 0.50 | 0 |
| Fixed Asset Turnover | 7.34 | 0 |
| Payout ratio | 15.34% | 0 |
| Dividend yield | 0.32% | 0 |
Interpretation of the Ratios
JBT Marel Corporation
JBTM shows a mixed ratio profile with a slightly unfavorable global opinion. Key weaknesses include low net margin at 4.98% and return on equity of 5.53%, both flagged as unfavorable. However, favorable metrics like a quick ratio of 3.04 and an interest coverage of 5.92 support liquidity and debt service. The company pays dividends with a low yield of 0.32%, indicating modest shareholder returns and potential concerns over payout sustainability.
Nano Nuclear Energy Inc
NNE’s ratios are largely unfavorable, reflecting its early-stage status and high volatility, with negative returns on equity (-18%) and invested capital (-20.51%). Despite a strong balance sheet indicated by a very high quick ratio of 53.48 and low debt levels, the company pays no dividends, consistent with its reinvestment strategy and development focus in microreactor technology. Cash flow metrics remain challenging, highlighting operational risks.
Which one has the best ratios?
Between the two, JBT Marel Corporation presents a more balanced ratio set with some favorable liquidity and coverage ratios, despite lower profitability. Nano Nuclear Energy’s financials reflect typical risks of a young, capital-intensive firm with predominantly unfavorable profitability and operational ratios. Overall, JBTM’s ratios appear less risky and more stable compared to NNE’s highly negative profitability indicators.
Strategic Positioning
This section compares the strategic positioning of JBT Marel Corporation and Nano Nuclear Energy Inc, focusing on market position, key segments, and exposure to technological disruption:
JBTM
- Established player in food and beverage technology with broad global reach and moderate competitive pressure.
- Diverse industrial segments including food processing, packaging, and automated material handling across many industries.
- Operates in traditional industrial machinery with moderate exposure to technological disruption.
NNE
- Emerging microreactor technology firm with niche nuclear focus and high competitive pressure.
- Concentrated on microreactor development, uranium fuel fabrication, and nuclear consulting services.
- High exposure due to innovative nuclear microreactor technology and new fuel supply infrastructure.
JBTM vs NNE Positioning
JBTM pursues a diversified approach across multiple food and industrial segments, offering stability but facing moderate disruption risk. NNE is highly concentrated in nuclear microreactors, showing innovation potential but greater risk and competitive pressure.
Which has the best competitive advantage?
Both companies are currently shedding value with ROIC below WACC. JBTM shows declining profitability and a very unfavorable moat, while NNE’s profitability is improving, resulting in a slightly unfavorable moat, indicating a modestly better competitive advantage.
Stock Comparison
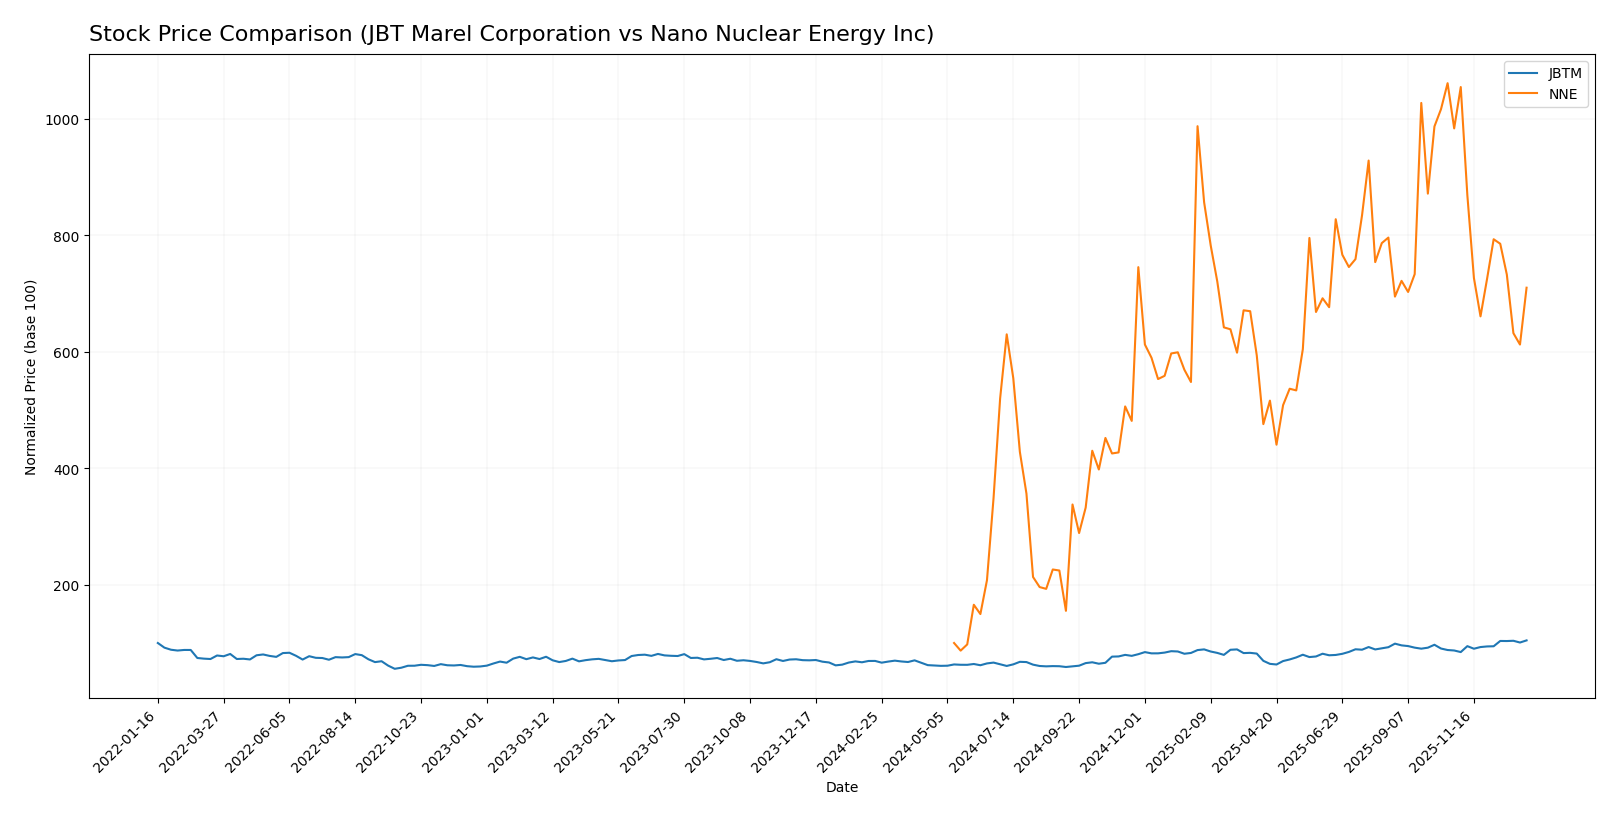
The past year saw significant divergences in stock price trajectories for JBT Marel Corporation and Nano Nuclear Energy Inc, marked by strong bullish momentum for JBTM and extraordinary overall gains but recent weakness for NNE.
Trend Analysis
JBT Marel Corporation’s stock price rose 50.89% over the past 12 months, reflecting a bullish trend with accelerating momentum and a high volatility level (std deviation 19.24). The price peaked at 156.04 and bottomed at 87.85, with recent gains continuing at a 19.87% increase.
Nano Nuclear Energy Inc’s stock exhibited a remarkable 609.76% increase over the last year, confirming a bullish but decelerating trend. Its volatility was moderate (std deviation 10.81), with prices ranging from 3.92 to 47.84. However, recent months showed a 27.81% decline, indicating short-term bearish pressure.
Comparing both, Nano Nuclear Energy Inc delivered the highest annual market performance despite recent weakness, surpassing JBT Marel Corporation’s strong but more moderate gains.
Target Prices
The current analyst consensus points to promising upside potential for both JBT Marel Corporation and Nano Nuclear Energy Inc.
| Company | Target High | Target Low | Consensus |
|---|---|---|---|
| JBT Marel Corporation | 180 | 169 | 174.5 |
| Nano Nuclear Energy Inc | 50 | 50 | 50 |
Analysts expect JBT Marel’s stock to trade significantly above the current price of 156.04 USD, suggesting moderate upside. Nano Nuclear Energy’s consensus target of 50 USD also indicates strong growth potential from its current 32.01 USD price.
Analyst Opinions Comparison
This section compares analysts’ ratings and grades for JBT Marel Corporation and Nano Nuclear Energy Inc:
Rating Comparison
JBT Marel Corporation Rating
- Rating: C, assessed as Very Favorable by analysts.
- Discounted Cash Flow Score: 3, indicating moderate valuation.
- ROE Score: 1, considered very unfavorable for profitability.
- ROA Score: 1, reflecting very unfavorable asset utilization.
- Debt To Equity Score: 2, moderate financial risk.
- Overall Score: 2, moderate overall financial standing.
Nano Nuclear Energy Inc Rating
- Rating: C, assessed as Very Favorable by analysts.
- Discounted Cash Flow Score: 2, indicating moderate valuation.
- ROE Score: 1, considered very unfavorable for profitability.
- ROA Score: 1, reflecting very unfavorable asset utilization.
- Debt To Equity Score: 5, very favorable financial risk.
- Overall Score: 2, moderate overall financial standing.
Which one is the best rated?
Both companies share the same overall rating and score of 2, with very unfavorable ROE and ROA scores. However, Nano Nuclear Energy Inc has a notably stronger debt to equity score, indicating better financial stability compared to JBT Marel Corporation.
Scores Comparison
Here is a comparison of the Altman Z-Score and Piotroski Score for the two companies:
JBTM Scores
- Altman Z-Score: 1.75, in distress zone indicating financial risk.
- Piotroski Score: 2, classified as very weak financial strength.
NNE Scores
- Altman Z-Score: 143.56, in safe zone indicating low bankruptcy risk.
- Piotroski Score: 2, classified as very weak financial strength.
Which company has the best scores?
NNE has a significantly stronger Altman Z-Score, placing it in the safe zone, unlike JBTM which is in distress. Both companies share the same very weak Piotroski Score, showing limited financial strength in that area.
Grades Comparison
Here is a comparison of the latest grades assigned to JBT Marel Corporation and Nano Nuclear Energy Inc by established grading companies:
JBT Marel Corporation Grades
The table below presents recent grade updates from reliable grading firms for JBT Marel Corporation.
| Grading Company | Action | New Grade | Date |
|---|---|---|---|
| Jefferies | Upgrade | Buy | 2025-12-10 |
| William Blair | Upgrade | Outperform | 2025-08-06 |
Overall, the grades for JBT Marel Corporation show an upward trend with recent upgrades to Buy and Outperform ratings, indicating growing analyst confidence.
Nano Nuclear Energy Inc Grades
The following table summarizes recent grades from recognized grading companies for Nano Nuclear Energy Inc.
| Grading Company | Action | New Grade | Date |
|---|---|---|---|
| HC Wainwright & Co. | Maintain | Buy | 2025-08-19 |
| Ladenburg Thalmann | Downgrade | Sell | 2025-08-18 |
| HC Wainwright & Co. | Maintain | Buy | 2025-08-15 |
| HC Wainwright & Co. | Maintain | Buy | 2025-03-31 |
| HC Wainwright & Co. | Maintain | Buy | 2025-01-29 |
| HC Wainwright & Co. | Maintain | Buy | 2024-11-27 |
| Benchmark | Maintain | Buy | 2024-11-07 |
| Benchmark | Maintain | Buy | 2024-07-15 |
| Benchmark | Maintain | Buy | 2024-06-25 |
Nano Nuclear Energy Inc’s grades predominantly maintain a Buy rating, though there is a notable recent downgrade to Sell by Ladenburg Thalmann, reflecting some divergence in analyst views.
Which company has the best grades?
JBT Marel Corporation has received mainly upgrades resulting in Buy and Outperform ratings, suggesting improving analyst sentiment. Nano Nuclear Energy Inc shows consistent Buy ratings but also a recent Sell downgrade, indicating mixed perspectives. Investors may interpret these grade trends as signals of relative analyst confidence and risk perceptions.
Strengths and Weaknesses
The table below summarizes the key strengths and weaknesses of JBT Marel Corporation and Nano Nuclear Energy Inc based on their latest financial performance and strategic positioning.
| Criterion | JBT Marel Corporation (JBTM) | Nano Nuclear Energy Inc (NNE) |
|---|---|---|
| Diversification | Moderate, focused on food processing technologies | Limited, focused on niche nuclear energy solutions |
| Profitability | Low net margin 4.98%, ROIC 3.65%, shedding value (ROIC < WACC) | Negative profitability, ROIC -20.51%, shedding value but improving |
| Innovation | Stable innovation in processing tech, moderate asset turnover | High potential in nuclear innovation but currently unprofitable |
| Global presence | Established global footprint in food tech markets | Emerging player, limited global reach |
| Market Share | Moderate market share with consistent but declining returns | Small market share, early growth phase |
Key takeaways: JBT Marel shows moderate strengths in diversification and global presence but struggles with profitability and value creation. Nano Nuclear Energy is in a growth and innovation phase with improving ROIC but currently faces significant profitability challenges. Investors should weigh JBTM’s stability against NNE’s high-risk, high-potential profile.
Risk Analysis
Below is a comparative table outlining key risk metrics for JBT Marel Corporation (JBTM) and Nano Nuclear Energy Inc (NNE) based on the most recent data from 2025-2026.
| Metric | JBT Marel Corporation (JBTM) | Nano Nuclear Energy Inc (NNE) |
|---|---|---|
| Market Risk | Moderate (Beta 1.00) | Very High (Beta 7.49) |
| Debt Level | Moderate (Debt/Assets 36.7%) | Very Low (Debt/Assets 1.2%) |
| Regulatory Risk | Moderate (Food & Industrial sectors) | High (Nuclear energy industry) |
| Operational Risk | Moderate (Large employee base, complex supply chain) | Very High (Early stage, 5 employees) |
| Environmental Risk | Moderate (Food processing machinery) | High (Nuclear technology and fuel fabrication) |
| Geopolitical Risk | Moderate (Global operations) | High (Nuclear regulations and international scrutiny) |
JBT Marel faces moderate market and operational risks, with leverage and liquidity ratios signaling some caution. NNE carries significantly higher market volatility and regulatory risks due to its nuclear focus and early development stage, despite very low debt. Investors should weigh the high-impact regulatory and operational risks at NNE against JBTM’s more stable but still cautious profile.
Which Stock to Choose?
JBT Marel Corporation (JBTM) shows a mixed income evolution with a slight revenue growth but declining profitability metrics. Its financial ratios are slightly unfavorable overall, with moderate debt levels and a very favorable rating. The company is shedding value, evidenced by a very unfavorable moat evaluation.
Nano Nuclear Energy Inc (NNE) presents a weak income evolution marked by zero gross margin and negative returns. Its financial ratios are mostly unfavorable despite very favorable debt metrics. The rating is very favorable, but the company is still shedding value, though with improving profitability trends.
For investors prioritizing financial stability and moderate risk, JBTM might appear more aligned due to its moderate rating and stronger cash flow quality, while those with tolerance for volatility and focus on growth potential could find NNE’s improving ROIC trend and strong recent price appreciation noteworthy.
Disclaimer: Investment carries a risk of loss of initial capital. The past performance is not a reliable indicator of future results. Be sure to understand risks before making an investment decision.
Go Further
I encourage you to read the complete analyses of JBT Marel Corporation and Nano Nuclear Energy Inc to enhance your investment decisions: