In the competitive industrial machinery sector, JBT Marel Corporation and Kadant Inc. stand out as key players delivering innovative solutions worldwide. Both companies serve diverse industries with advanced technologies in processing, handling, and automation, making them natural contenders for comparison. This analysis will explore their market strategies, financial health, and growth potential to help you, the investor, identify the most promising opportunity to add to your portfolio.
Table of contents
Companies Overview
I will begin the comparison between JBT Marel Corporation and Kadant Inc. by providing an overview of these two companies and their main differences.
JBT Marel Corporation Overview
JBT Marel Corporation provides technology solutions primarily to the food and beverage industry across multiple regions including North America, Europe, and Asia Pacific. Its offerings cover a broad range of processing and packaging solutions, as well as automated guided vehicle systems for manufacturing and warehousing. The company serves diverse markets such as poultry, meat, seafood, pharmaceuticals, and fast-moving consumer goods, positioning it as a comprehensive industrial machinery provider.
Kadant Inc. Overview
Kadant Inc. supplies engineered systems and technologies worldwide, operating through three main segments: Flow Control, Industrial Processing, and Material Handling. Its products include fluid-handling systems, industrial automation equipment, and conveying and vibratory equipment for industries such as packaging, tissue, wood products, and alternative fuels. Kadant focuses on specialized machinery and components that support a variety of industrial applications globally.
Key similarities and differences
Both JBT Marel and Kadant operate in the industrial machinery sector, serving global markets with technology-driven solutions. While JBT Marel targets food and beverage processing with a wide array of equipment and automation, Kadant emphasizes fluid control, industrial processing, and material handling systems across various industries. JBT Marel has a larger workforce and market cap, reflecting its broader product scope, whereas Kadant concentrates on specialized segments with a more focused portfolio.
Income Statement Comparison
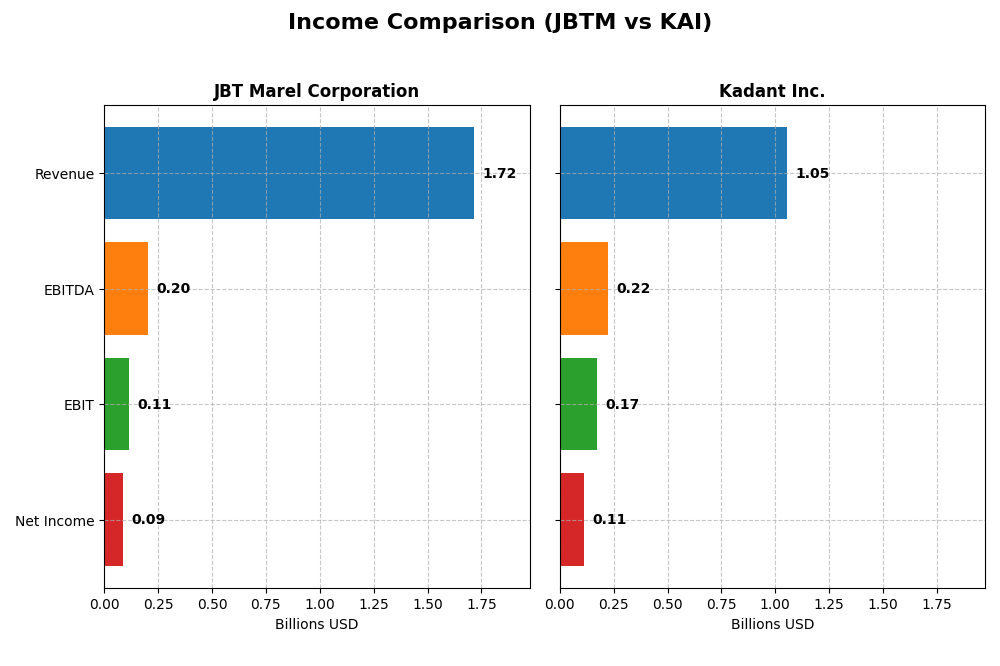
The following table presents a side-by-side comparison of key income statement metrics for JBT Marel Corporation and Kadant Inc. based on their most recent fiscal year data.
| Metric | JBT Marel Corporation | Kadant Inc. |
|---|---|---|
| Market Cap | 8.11B | 3.76B |
| Revenue | 1.72B | 1.05B |
| EBITDA | 204.2M | 222.7M |
| EBIT | 114.8M | 173.1M |
| Net Income | 85.4M | 111.6M |
| EPS | 2.67 | 9.51 |
| Fiscal Year | 2024 | 2024 |
Income Statement Interpretations
JBT Marel Corporation
Between 2020 and 2024, JBT Marel’s revenue showed a slight overall decline of 0.68%, while net income dropped by 21.5%, reflecting weaker profitability. Gross margins remained favorable at 36.5%, but EBIT and net margins were neutral to declining. In 2024, revenue growth slowed to 3.1%, gross profit rose modestly, yet EBIT and net income margins deteriorated significantly, signaling margin pressure.
Kadant Inc.
Kadant demonstrated robust growth from 2020 to 2024, with revenue up 65.9% and net income more than doubling by 102.2%. Gross margin improved to 44.3%, alongside a strong EBIT margin of 16.4% and net margin above 10%. Despite a slight net margin decline of 12.6% in 2024, overall profitability remained strong, supported by nearly 10% revenue growth and stable EBIT performance.
Which one has the stronger fundamentals?
Kadant Inc. clearly exhibits stronger fundamentals with consistent revenue and net income growth, higher and improving margins, and a favorable overall income statement evaluation. JBT Marel, by contrast, faces declining net income and margin contraction despite stable gross margins. Kadant’s financial metrics suggest more robust and sustainable operational performance over the analyzed period.
Financial Ratios Comparison
Below is a comparison of key financial ratios for JBT Marel Corporation (JBTM) and Kadant Inc. (KAI) based on their latest fiscal year 2024 data.
| Ratios | JBT Marel Corporation (JBTM) | Kadant Inc. (KAI) |
|---|---|---|
| ROE | 5.53% | 13.17% |
| ROIC | 3.65% | 10.08% |
| P/E | 47.63 | 36.90 |
| P/B | 2.63 | 4.86 |
| Current Ratio | 3.48 | 2.31 |
| Quick Ratio | 3.04 | 1.55 |
| D/E (Debt-to-Equity) | 0.81 | 0.38 |
| Debt-to-Assets | 36.68% | 22.57% |
| Interest Coverage | 6.10 | 8.55 |
| Asset Turnover | 0.50 | 0.74 |
| Fixed Asset Turnover | 7.34 | 6.18 |
| Payout Ratio | 15.34% | 13.15% |
| Dividend Yield | 0.32% | 0.36% |
Interpretation of the Ratios
JBT Marel Corporation
JBT Marel exhibits a mixed ratio profile with several unfavorable metrics, including a low net margin of 4.98% and a modest ROE of 5.53%, suggesting profitability challenges. The company’s current ratio is high at 3.48 but viewed as unfavorable, implying potential liquidity inefficiencies. Dividend yield is low at 0.32%, indicating limited shareholder returns through dividends.
Kadant Inc.
Kadant shows stronger ratios overall, with a favorable net margin of 10.59% and a solid ROIC of 10.08%, reflecting operational efficiency. Its debt levels are conservative with a debt-to-assets ratio at 22.57%, and liquidity ratios are favorable, supporting financial stability. The dividend yield is modest at 0.36%, signaling consistent but limited returns to shareholders.
Which one has the best ratios?
Kadant’s ratios are generally more favorable, with a higher proportion of positive metrics compared to JBT Marel, which faces several unfavorable financial indicators. Kadant’s stronger profitability, better debt management, and balanced liquidity ratios suggest a more robust financial condition relative to JBT Marel’s slightly unfavorable ratio evaluation.
Strategic Positioning
This section compares the strategic positioning of JBT Marel Corporation and Kadant Inc. considering Market position, Key segments, and disruption:
JBT Marel Corporation
- Operates globally with broad competitive presence in food and beverage technology solutions.
- Focuses on food, beverage, health industries, plus automated material handling systems.
- Exposure to technology through automation and processing innovations in food and health sectors.
Kadant Inc.
- Serves global industrial machinery markets with moderate competitive pressure.
- Operates three segments: Flow Control, Industrial Processing, and Material Handling.
- Faces technological disruption via fluid-handling and industrial automation systems.
JBT Marel Corporation vs Kadant Inc. Positioning
JBT Marel exhibits a diversified portfolio across food processing and health sectors with broad geographic reach, while Kadant concentrates on industrial machinery segments, emphasizing flow control and material handling. JBT’s diversification may offer resilience; Kadant’s focus provides targeted expertise.
Which has the best competitive advantage?
Kadant holds a slightly favorable moat with growing profitability, indicating potential competitive advantage, whereas JBT Marel shows a very unfavorable moat with declining returns, reflecting value erosion and weaker competitive positioning.
Stock Comparison
The stock price movements over the past 12 months show a strong bullish trend for JBT Marel Corporation with significant price appreciation and accelerating momentum, contrasted by Kadant Inc., which experienced a bearish trend despite recent positive gains.

Trend Analysis
JBT Marel Corporation’s stock price rose by 50.89% over the past year, indicating a bullish trend with acceleration and moderate volatility (std dev 19.24). The stock reached a high of 156.04 and a low of 87.85.
Kadant Inc. showed a bearish trend with a 5.86% decline over the same period, though recent months saw a 9.69% price increase. The trend is accelerating but with higher volatility (std dev 34.44).
Comparatively, JBT Marel Corporation delivered the highest market performance over the past year, outperforming Kadant Inc. by a wide margin in overall price appreciation.
Target Prices
The current analyst consensus presents optimistic target prices for both JBT Marel Corporation and Kadant Inc.
| Company | Target High | Target Low | Consensus |
|---|---|---|---|
| JBT Marel Corporation | 180 | 169 | 174.5 |
| Kadant Inc. | 410 | 275 | 342.5 |
Analysts expect JBT Marel’s stock to appreciate modestly above its current price of $156.04, while Kadant’s consensus target suggests a significant upside from its $319.22 price level.
Analyst Opinions Comparison
This section compares analysts’ ratings and grades for the two companies:
Rating Comparison
JBTM Rating
- Rating: C, considered Very Favorable overall.
- Discounted Cash Flow Score: 3, indicating a moderate valuation outlook.
- ROE Score: 1, rated Very Unfavorable for efficiency in generating profits.
- ROA Score: 1, Very Unfavorable, reflecting weak asset utilization.
- Debt To Equity Score: 2, Moderate financial risk due to leverage.
- Overall Score: 2, Moderate overall financial standing.
KAI Rating
- Rating: B, considered Very Favorable overall.
- Discounted Cash Flow Score: 3, indicating a moderate valuation outlook.
- ROE Score: 3, rated Moderate, showing better profit generation from equity.
- ROA Score: 4, Favorable, indicating strong efficiency in asset use.
- Debt To Equity Score: 3, Moderate, with comparatively stronger balance sheet.
- Overall Score: 3, Moderate with a slight edge over JBTM in overall metrics.
Which one is the best rated?
Based strictly on the provided data, KAI holds a better rating with a B grade and higher scores in ROE, ROA, debt-to-equity, and overall metrics. JBTM’s rating is C with several scores marked as very unfavorable.
Scores Comparison
Here is a comparison of the Altman Z-Score and Piotroski Score for JBT Marel Corporation and Kadant Inc.:
JBTM Scores
- Altman Z-Score: 1.75, in distress zone, indicating high bankruptcy risk.
- Piotroski Score: 2, classified as very weak financial strength.
KAI Scores
- Altman Z-Score: 5.59, in safe zone, indicating low bankruptcy risk.
- Piotroski Score: 7, classified as strong financial strength.
Which company has the best scores?
Kadant Inc. shows significantly stronger scores with a safe zone Altman Z-Score of 5.59 and a strong Piotroski Score of 7, compared to JBT Marel’s distress zone and very weak Piotroski Score. This suggests Kadant currently exhibits better financial stability and strength.
Grades Comparison
Here is the comparison of recent grades and rating trends for JBT Marel Corporation and Kadant Inc.:
JBT Marel Corporation Grades
The following table presents recent grade upgrades from reputable grading companies for JBT Marel Corporation:
| Grading Company | Action | New Grade | Date |
|---|---|---|---|
| Jefferies | Buy | Buy | 2025-12-10 |
| William Blair | Outperform | Outperform | 2025-08-06 |
JBT Marel Corporation shows an upward trend with recent upgrades from Hold to Buy and Market Perform to Outperform, indicating increasing confidence among analysts.
Kadant Inc. Grades
This table summarizes consistent maintained ratings for Kadant Inc. by established grading firms:
| Grading Company | Action | New Grade | Date |
|---|---|---|---|
| Barrington Research | Maintain | Outperform | Multiple dates in 2025 |
| DA Davidson | Maintain | Neutral | 2025-08-04, 2025-05-01 |
Kadant Inc. maintains a stable outlook with multiple Outperform ratings sustained by Barrington Research and Neutral ratings by DA Davidson, reflecting steady analyst sentiment.
Which company has the best grades?
JBT Marel Corporation has received stronger recent upgrades compared to Kadant Inc., moving from Hold to Buy and Market Perform to Outperform. This suggests growing analyst optimism for JBTM, whereas Kadant’s stable but less bullish consensus may imply more cautious investor expectations.
Strengths and Weaknesses
Below is a comparative overview of the strengths and weaknesses for JBT Marel Corporation (JBTM) and Kadant Inc. (KAI) based on the most recent financial and operational data.
| Criterion | JBT Marel Corporation (JBTM) | Kadant Inc. (KAI) |
|---|---|---|
| Diversification | Limited product segmentation; not highly diversified | Diverse product segments including Capital and Parts and Consumables with steady growth |
| Profitability | Low net margin (4.98%), ROIC below WACC; value destroying | Higher net margin (10.59%), ROIC above WACC; value creating with improving profitability |
| Innovation | Declining ROIC trend suggests challenges in innovation impact | Growing ROIC trend indicates effective innovation and capital use |
| Global presence | Moderate, but no significant data on global footprint | Established global presence with expanding product lines |
| Market Share | Neutral to slightly unfavorable financial ratios; high P/E (47.63) may indicate market skepticism | Favorable financial ratios overall, though P/E (36.9) and P/B (4.86) are high, reflecting growth expectations |
Key takeaways: Kadant Inc. shows stronger profitability, value creation, and innovation momentum, supported by a diverse product base and favorable financial health. JBT Marel struggles with declining capital efficiency and profitability, signaling caution despite a stable balance sheet. Investors should weigh KAI’s growth potential against its valuation premium, while closely monitoring JBTM’s turnaround prospects.
Risk Analysis
Below is a comparative risk table for JBT Marel Corporation (JBTM) and Kadant Inc. (KAI) based on their most recent financial and operational data for 2024.
| Metric | JBT Marel Corporation (JBTM) | Kadant Inc. (KAI) |
|---|---|---|
| Market Risk | Moderate (Beta 1.00) | Higher (Beta 1.25) |
| Debt Level | Moderate (Debt/Equity 0.81) | Low (Debt/Equity 0.38) |
| Regulatory Risk | Medium (Global operations) | Medium (Industrial tech) |
| Operational Risk | Medium (Complex food tech) | Lower (Focused segments) |
| Environmental Risk | Moderate (Industrial impact) | Moderate (Industrial impact) |
| Geopolitical Risk | Medium (Global supply chains) | Medium (Global supply chains) |
The most impactful risks are market volatility for Kadant due to its higher beta, and JBT Marel’s financial distress signals, as reflected in its Altman Z-Score in the distress zone and very weak Piotroski score. Kadant’s stronger financial health and lower debt reduce its risk profile, making it relatively safer amid economic uncertainties.
Which Stock to Choose?
JBT Marel Corporation (JBTM) shows a mixed income evolution with a slight revenue growth but declining profitability over 2020-2024. Its financial ratios reflect several unfavorable metrics, including low returns and a slightly unfavorable global rating. Debt levels are moderate, and its overall rating is very favorable.
Kadant Inc. (KAI) demonstrates favorable income growth and profitability, with strong gross and net margins. Its financial ratios are largely favorable, indicating efficient capital use and lower leverage. KAI holds a slightly favorable moat status and a very favorable overall rating, supported by solid liquidity and profitability metrics.
Investors seeking growth potential might find KAI’s improving profitability and favorable ratios more appealing, while those with a tolerance for risk might consider JBTM’s valuation and moderate debt. The choice could depend on an investor’s preference for stability and financial strength versus potential value creation amid some financial challenges.
Disclaimer: Investment carries a risk of loss of initial capital. The past performance is not a reliable indicator of future results. Be sure to understand risks before making an investment decision.
Go Further
I encourage you to read the complete analyses of JBT Marel Corporation and Kadant Inc. to enhance your investment decisions: