In the evolving industrial machinery sector, JBT Marel Corporation and Columbus McKinnon Corporation stand out as key players with distinct yet overlapping market footprints. JBT Marel focuses on advanced food processing technology, while Columbus McKinnon excels in intelligent motion and material handling solutions. Both companies emphasize innovation to meet diverse industrial needs. This article will analyze their strengths and risks to identify which presents a more compelling investment opportunity for your portfolio.
Table of contents
Companies Overview
I will begin the comparison between JBT Marel Corporation and Columbus McKinnon Corporation by providing an overview of these two companies and their main differences.
JBT Marel Corporation Overview
JBT Marel Corporation provides technology solutions primarily to the food and beverage industry across multiple regions including North America, Europe, and Asia Pacific. The company offers a wide range of processing and packaging solutions, as well as automated guided vehicle systems for manufacturing and warehousing. With a market cap of 7.8B USD and over 11,700 employees, JBT Marel holds a significant position in the industrial machinery sector.
Columbus McKinnon Corporation Overview
Columbus McKinnon Corporation designs and manufactures intelligent motion solutions for material handling, specializing in hoists, crane systems, rigging equipment, and power and motion technology products. Serving diverse market verticals such as industrial automation, construction, and food and beverage, the company operates with a market cap of approximately 494M USD and employs around 3,515 people. It is headquartered in Buffalo, New York, and listed on NASDAQ.
Key similarities and differences
Both companies operate within the industrial sector but focus on distinct niches: JBT Marel concentrates on food and beverage processing technologies, while Columbus McKinnon specializes in material handling and lifting equipment. Each serves a global customer base and distributes products through direct sales and third-party channels. However, JBT Marel’s market cap and workforce size are substantially larger, reflecting a broader product scope and market reach compared to Columbus McKinnon’s more specialized offerings.
Income Statement Comparison
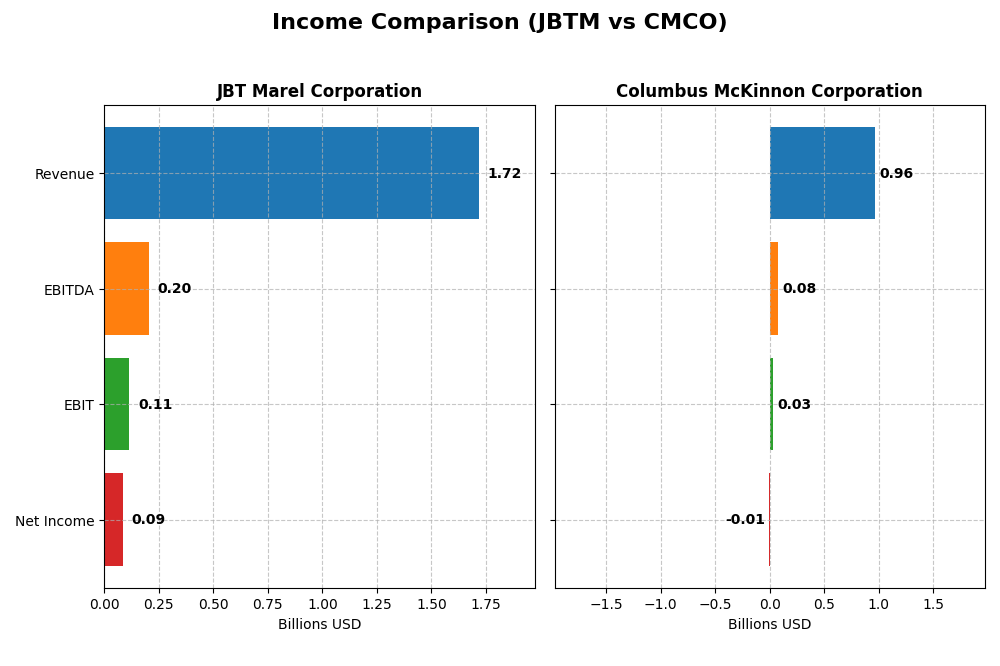
The table below compares the key income statement metrics for JBT Marel Corporation and Columbus McKinnon Corporation for the most recent fiscal year available.
| Metric | JBT Marel Corporation | Columbus McKinnon Corporation |
|---|---|---|
| Market Cap | 7.83B | 494M |
| Revenue | 1.72B | 963M |
| EBITDA | 204.2M | 75.1M |
| EBIT | 114.8M | 26.9M |
| Net Income | 85.4M | -5.1M |
| EPS | 2.67 | -0.18 |
| Fiscal Year | 2024 | 2024 |
Income Statement Interpretations
JBT Marel Corporation
JBT Marel’s revenue showed modest growth of 3.1% in 2024, with gross margin favorable at 36.5%. However, net income declined by 85.8% year-over-year, reflecting a sharp margin contraction to 4.98%. Operating expenses grew alongside revenue, pressuring EBIT down by 35.3%. The overall five-year trend reveals declining profitability despite stable top-line figures.
Columbus McKinnon Corporation
Columbus McKinnon experienced a revenue decline of 5% in 2024, with gross margin at 33.8%, also favorable. The net margin turned negative at -0.53%, driven by a steep 72.9% drop in EBIT and increased interest expenses. Despite a favorable 48% revenue growth over five years, net income and earnings per share sharply deteriorated, indicating profitability challenges.
Which one has the stronger fundamentals?
Both companies face unfavorable profitability trends, but JBT Marel maintains positive net margins and better control over interest expenses. Columbus McKinnon’s negative net margin and larger EBIT decline highlight more severe earnings pressure. While each shows some favorable revenue or margin aspects, JBT Marel’s fundamentals appear relatively stronger given its more stable margin profile and less negative net income trajectory.
Financial Ratios Comparison
This table presents the most recent financial ratios for JBT Marel Corporation and Columbus McKinnon Corporation, reflecting their performance and financial health as of fiscal year 2024.
| Ratios | JBT Marel Corporation (JBTM) | Columbus McKinnon Corporation (CMCO) |
|---|---|---|
| ROE | 5.53% | -0.58% |
| ROIC | 3.65% | 3.30% |
| P/E | 47.63 | -94.69 |
| P/B | 2.63 | 0.55 |
| Current Ratio | 3.48 | 1.81 |
| Quick Ratio | 3.04 | 1.04 |
| D/E (Debt to Equity) | 0.81 | 0.61 |
| Debt-to-Assets | 36.68% | 31.09% |
| Interest Coverage | 6.10 | 1.68 |
| Asset Turnover | 0.50 | 0.55 |
| Fixed Asset Turnover | 7.34 | 9.07 |
| Payout Ratio | 15.34% | -156.52% |
| Dividend Yield | 0.32% | 1.65% |
Interpretation of the Ratios
JBT Marel Corporation
JBTM shows a mixed ratio profile with unfavorable net margin (4.98%) and return on equity (5.53%), indicating modest profitability and efficiency. Its dividend yield is low at 0.32%, reflecting cautious shareholder returns. The payout appears sustainable given coverage by free cash flow, but investors should note slightly unfavorable overall financial health and liquidity concerns with a high current ratio.
Columbus McKinnon Corporation
CMCO displays weaker profitability with negative net margin (-0.53%) and return on equity (-0.58%), reflecting operational challenges. The company pays dividends, yielding 1.65% with a neutral status, suggesting cautious payout policies amid unfavorable interest coverage (0.83). Its financial leverage is moderate, and the overall ratio assessment is slightly favorable due to better liquidity and valuation metrics.
Which one has the best ratios?
Comparing both, Columbus McKinnon has a slightly favorable ratio profile, supported by better liquidity and valuation ratios despite profitability issues. JBT Marel’s ratios are slightly unfavorable mostly due to lower profitability and dividend yield, although it maintains stronger coverage and asset turnover. Thus, CMCO’s ratios are currently more balanced overall.
Strategic Positioning
This section compares the strategic positioning of JBT Marel Corporation and Columbus McKinnon Corporation, including Market position, Key segments, and Exposure to technological disruption:
JBT Marel Corporation
- Large market cap of 7.8B in industrial machinery with global competition.
- Serves diverse segments: food, beverage, health, pharma, manufacturing, warehousing.
- Provides advanced technology solutions including automation and material handling systems.
Columbus McKinnon Corporation
- Smaller market cap of 494M in agricultural machinery with moderate competitive pressure.
- Focuses on motion solutions: hoists, cranes, conveyors, power control systems, and rigging equipment.
- Offers intelligent motion and power technology products with some automation and diagnostics.
JBT Marel Corporation vs Columbus McKinnon Corporation Positioning
JBT Marel’s strategy is broadly diversified across many industrial and food-related sectors, enhancing market reach but increasing complexity. Columbus McKinnon concentrates on motion and lifting solutions, allowing focused expertise but narrower market exposure.
Which has the best competitive advantage?
Both companies are shedding value, with JBT Marel showing declining profitability and Columbus McKinnon improving profitability despite value destruction. Columbus McKinnon’s growing ROIC trend suggests a slightly more favorable competitive advantage over JBT Marel.
Stock Comparison
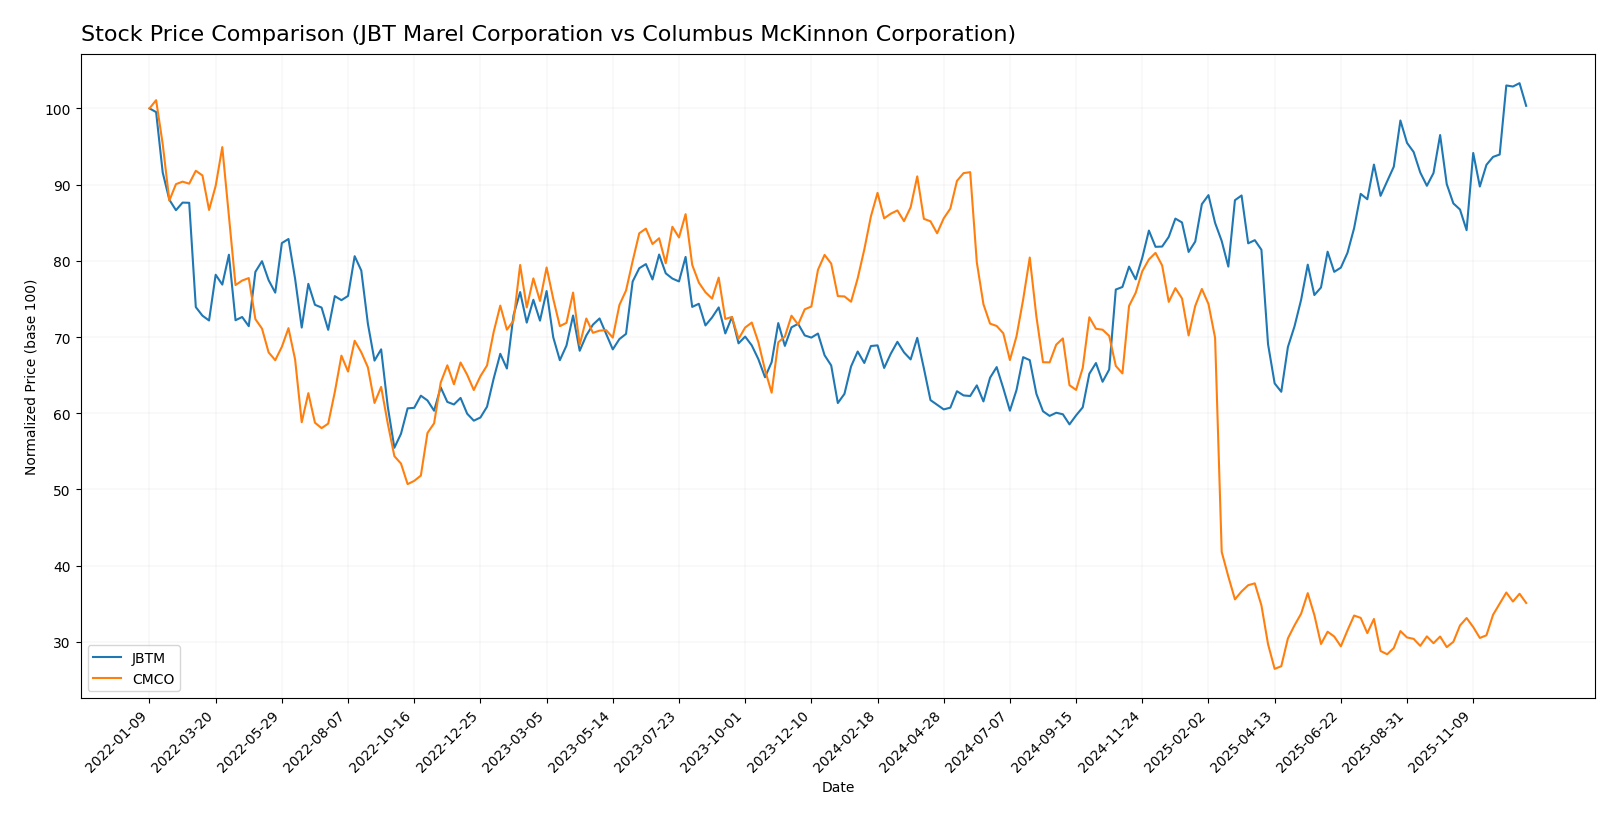
The stock price movements over the past year reveal contrasting dynamics, with JBT Marel Corporation showing strong bullish momentum and Columbus McKinnon Corporation experiencing a pronounced bearish trend despite recent recovery signs.
Trend Analysis
JBT Marel Corporation’s stock demonstrated a bullish trend with a 45.81% increase over the past 12 months, accompanied by accelerating momentum and a notable high near 155.05. Volatility was relatively high with an 18.87 standard deviation.
Columbus McKinnon Corporation’s shares declined by 59.11% over the same period, marking a bearish trend with accelerating downward pressure. The stock’s volatility was moderate with an 11.28 standard deviation, and it reached a low of 12.96.
Comparing the two, JBT Marel Corporation delivered the highest market performance with significant gains, while Columbus McKinnon Corporation’s performance was substantially weaker despite a recent positive trend shift.
Target Prices
The current analyst consensus shows a positive outlook for both JBT Marel Corporation and Columbus McKinnon Corporation.
| Company | Target High | Target Low | Consensus |
|---|---|---|---|
| JBT Marel Corporation | 180 | 169 | 174.5 |
| Columbus McKinnon Corporation | 50 | 48 | 49 |
Analysts expect JBT Marel’s stock to rise from its current price of $150.59 toward the consensus target of $174.5, while Columbus McKinnon’s stock price of $17.20 is forecasted to approach $49, indicating strong potential upside.
Analyst Opinions Comparison
This section compares analysts’ ratings and grades for JBT Marel Corporation and Columbus McKinnon Corporation:
Rating Comparison
JBTM Rating
- Rating: C, classified as Very Favorable overall.
- Discounted Cash Flow Score: 3, indicating a Moderate valuation outlook.
- ROE Score: 1, considered Very Unfavorable for profitability from equity.
- ROA Score: 1, marked as Very Unfavorable for asset efficiency.
- Debt To Equity Score: 2, Moderate risk from financial leverage.
- Overall Score: 2, categorized as Moderate financial standing.
CMCO Rating
- Rating: B, also rated Very Favorable overall.
- Discounted Cash Flow Score: 5, signaling a Very Favorable valuation rating.
- ROE Score: 1, also Very Unfavorable in generating profit from equity.
- ROA Score: 2, Moderate rating showing better asset utilization.
- Debt To Equity Score: 2, also Moderate debt-related financial risk.
- Overall Score: 3, moderately stronger overall financial profile.
Which one is the best rated?
Based strictly on the provided data, CMCO holds a better analyst rating with a B grade and a higher overall score of 3, compared to JBTM’s C rating and overall score of 2. CMCO also outperforms JBTM notably in discounted cash flow and asset utilization metrics.
Scores Comparison
The following table compares the Altman Z-Score and Piotroski Score for JBTM and CMCO:
JBTM Scores
- Altman Z-Score: 1.75, in distress zone, indicating high bankruptcy risk.
- Piotroski Score: 2, very weak financial strength and poor investment quality.
CMCO Scores
- Altman Z-Score: 1.40, in distress zone, indicating high bankruptcy risk.
- Piotroski Score: 8, very strong financial strength and good investment quality.
Which company has the best scores?
CMCO shows a better Piotroski Score indicating stronger financial health, but both companies have Altman Z-Scores in the distress zone, signaling high bankruptcy risk for each based on the data provided.
Grades Comparison
The grades of JBT Marel Corporation and Columbus McKinnon Corporation from recognized grading companies are detailed as follows:
JBT Marel Corporation Grades
The latest grade updates from reputable firms for JBT Marel Corporation are presented here.
| Grading Company | Action | New Grade | Date |
|---|---|---|---|
| Jefferies | Buy | Buy | 2025-12-10 |
| William Blair | Upgrade | Outperform | 2025-08-06 |
JBT Marel Corporation has experienced recent upgrades in its grades, indicating growing analyst confidence.
Columbus McKinnon Corporation Grades
Here are the recent grade changes from established grading companies for Columbus McKinnon Corporation.
| Grading Company | Action | New Grade | Date |
|---|---|---|---|
| DA Davidson | Downgrade | Neutral | 2025-02-11 |
| DA Davidson | Maintain | Buy | 2024-02-05 |
| DA Davidson | Maintain | Buy | 2022-10-04 |
| DA Davidson | Maintain | Buy | 2022-10-03 |
| Barrington Research | Maintain | Outperform | 2022-07-29 |
| Barrington Research | Maintain | Outperform | 2022-07-28 |
| DA Davidson | Downgrade | Neutral | 2022-05-26 |
| Barrington Research | Maintain | Outperform | 2022-05-26 |
| Barrington Research | Maintain | Outperform | 2022-05-25 |
| JP Morgan | Downgrade | Neutral | 2022-05-25 |
Columbus McKinnon Corporation has seen several downgrades recently, with ratings shifting from Buy or Outperform to Neutral.
Which company has the best grades?
JBT Marel Corporation holds the better grades, with recent upgrades to Buy and Outperform, signaling positive analyst sentiment. Columbus McKinnon Corporation shows a downward trend toward Neutral, which may suggest increased caution among analysts. Investors might interpret these trends as differing outlooks on growth and risk.
Strengths and Weaknesses
Below is a comparison of key strengths and weaknesses for JBT Marel Corporation (JBTM) and Columbus McKinnon Corporation (CMCO) based on recent financial and operational data.
| Criterion | JBT Marel Corporation (JBTM) | Columbus McKinnon Corporation (CMCO) |
|---|---|---|
| Diversification | Limited product segmentation; focused business model | Highly diversified with multiple product lines including hoists, conveyors, actuators, and cranes |
| Profitability | Low profitability; ROIC at 3.65% below WACC (7.47%) | Low profitability; ROIC at 3.3% below WACC (7.22%) but improving |
| Innovation | Moderate innovation with some efficiency in asset turnover | Innovation evident in digital power systems and precision conveyors; fixed asset turnover high |
| Global presence | Moderate, not clearly dominant globally | Strong global presence indicated by broad product range and market segments |
| Market Share | Stable but with declining ROIC trend indicating weakness | Market share bolstered by growing ROIC and expanding product offerings |
Key takeaways: JBTM struggles with declining profitability and value destruction, reflecting weaker financial health and less diversification. CMCO, despite also shedding value, shows signs of recovery and strength through product diversification and improving profitability trends, making it a more resilient choice for investors.
Risk Analysis
Below is a comparative table highlighting key risk metrics for JBT Marel Corporation (JBTM) and Columbus McKinnon Corporation (CMCO) based on the most recent data from 2024:
| Metric | JBT Marel Corporation (JBTM) | Columbus McKinnon Corporation (CMCO) |
|---|---|---|
| Market Risk | Beta 1.009 – moderately aligned with market volatility | Beta 1.294 – higher sensitivity to market swings |
| Debt level | Debt-to-Equity 0.81 – moderate leverage | Debt-to-Equity 0.61 – moderate leverage |
| Regulatory Risk | Moderate – operates globally with diverse food and industrial regulations | Moderate – exposed to safety and industry-specific regulations worldwide |
| Operational Risk | Moderate – complex food processing tech and automation | Moderate – manufacturing and material handling complexity |
| Environmental Risk | Moderate – industrial machinery with some environmental compliance | Moderate – machinery production with environmental considerations |
| Geopolitical Risk | Moderate – global operations in multiple regions | Moderate – global sales but less diversified geographically |
In synthesis, both companies face moderate market and operational risks, but CMCO’s higher beta indicates greater market volatility exposure. JBTM’s financial distress signals (Altman Z-score near distress zone) and weak profitability metrics heighten risk, while CMCO’s stronger Piotroski score suggests better financial health despite distress zone bankruptcy risk. Investors should weigh CMCO’s favorable valuation against JBTM’s riskier financial position.
Which Stock to Choose?
JBT Marel Corporation shows mixed financial performance with slightly unfavorable ratios overall and an unfavorable income statement trend marked by declining profitability and earnings. It maintains low net debt to EBITDA and a very favorable rating of C, but its ROIC is below WACC and trending downward, signaling value destruction.
Columbus McKinnon Corporation presents slightly favorable financial ratios and a very favorable rating of B despite negative net margin and ROE. Its income statement is unfavorable overall, with declining margins, but it shows a rising ROIC trend, though still below WACC, indicating improving profitability amidst value destruction.
Considering rating and financials, JBTM might appeal to investors prioritizing stability and a stronger market cap, while CMCO’s improving profitability and better ratio favorability could interest those favoring growth potential despite risk. Each company’s profile suggests different risk-reward balances depending on investor tolerance and strategy.
Disclaimer: Investment carries a risk of loss of initial capital. The past performance is not a reliable indicator of future results. Be sure to understand risks before making an investment decision.
Go Further
I encourage you to read the complete analyses of JBT Marel Corporation and Columbus McKinnon Corporation to enhance your investment decisions: