In the dynamic world of packaged foods, JBS N.V. and The Magnum Ice Cream Company N.V. stand out with distinct yet overlapping market footprints. JBS, a global protein powerhouse, contrasts with Magnum’s focused innovation in premium ice cream. Both Dutch-based companies showcase unique strategies that appeal to consumer trends and investor interests. This article will guide you through a comparative analysis to identify which company presents the most compelling investment opportunity for your portfolio.
Table of contents
Companies Overview
I will begin the comparison between JBS N.V. and The Magnum Ice Cream Company N.V. by providing an overview of these two companies and their main differences.
JBS N.V. Overview
JBS N.V. operates as a global protein and food company, offering a diverse range of products including beef, pork, chicken, fish, and plant-based foods. Founded in 1953 and based in Amstelveen, Netherlands, JBS also engages in leather production, biodiesel, and logistics services, positioning itself as a comprehensive player in the packaged foods industry with 280K employees and a market cap of $31.7B.
The Magnum Ice Cream Company N.V. Overview
The Magnum Ice Cream Company N.V. specializes exclusively in the ice cream segment within the packaged foods sector. Based in Amsterdam, Netherlands, it employs approximately 18.6K people and focuses on the production and sale of ice cream products. With a market capitalization of $9.3B, Magnum Ice Cream is a niche player in consumer defensive goods listed on the NYSE.
Key similarities and differences
Both companies operate within the consumer defensive sector and are listed on the New York Stock Exchange, headquartered in the Netherlands. JBS has a broad, diversified product portfolio across multiple protein and food categories, whereas Magnum Ice Cream concentrates solely on ice cream products. JBS’s workforce and market capitalization are significantly larger, reflecting its wider scope compared to Magnum’s specialized market focus.
Income Statement Comparison
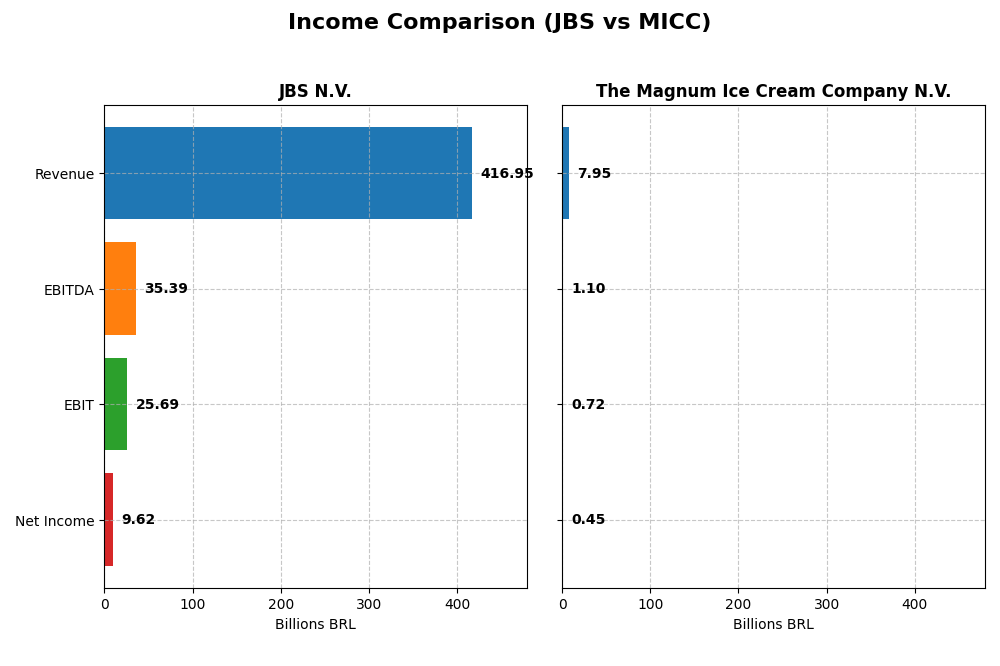
The following table compares key income statement metrics for JBS N.V. and The Magnum Ice Cream Company N.V. for the fiscal year 2024, reflecting their financial performance in their respective currencies.
| Metric | JBS N.V. (BRL) | The Magnum Ice Cream Company N.V. (EUR) |
|---|---|---|
| Market Cap | 31.7B | 9.3B |
| Revenue | 417B | 7.95B |
| EBITDA | 35.4B | 1.1B |
| EBIT | 25.7B | 725M |
| Net Income | 9.6B | 450M |
| EPS | 30.55 | 0.74 |
| Fiscal Year | 2024 | 2024 |
Income Statement Interpretations
JBS N.V.
JBS N.V. showed strong growth in revenue and net income from 2020 to 2024, with revenue rising 54% and net income more than doubling. Margins remained largely stable, with a neutral gross margin around 15% and net margin at 2.3%. The 2024 fiscal year marked a notable rebound with a 14.6% revenue increase and sharply improved profitability, including an 890% rise in net margin.
The Magnum Ice Cream Company N.V.
The Magnum Ice Cream Company experienced modest revenue growth of about 6% over 2022-2024 but faced declining net income and margins. Gross margin is favorable at nearly 35%, yet net margin dropped to 5.7%, with net income decreasing by over 11% across the period. The 2024 year showed slower growth and a reduction in net margin and EPS, signaling some operational challenges.
Which one has the stronger fundamentals?
JBS N.V. demonstrates stronger fundamentals, supported by substantial revenue and net income growth, improved margins, and favorable interest expense ratios. In contrast, The Magnum Ice Cream Company exhibits weaker fundamentals due to declining net income, unfavorable margin trends, and negative EPS growth. Overall, JBS’s income statement reflects more robust financial health and operational performance.
Financial Ratios Comparison
The table below compares key financial ratios for JBS N.V. and The Magnum Ice Cream Company N.V. based on their latest fiscal year data from 2024.
| Ratios | JBS N.V. | The Magnum Ice Cream Company N.V. |
|---|---|---|
| ROE | 21.47% | 16.20% |
| ROIC | 8.61% | 16.42% |
| P/E | 3.20 | 19.60 |
| P/B | 0.69 | 3.18 |
| Current Ratio | 1.47 | 0.80 |
| Quick Ratio | 0.90 | 0.35 |
| D/E (Debt-to-Equity) | 3.01 | 0.07 |
| Debt-to-Assets | 53.56% | 3.41% |
| Interest Coverage | 2.33 | 5.18 |
| Asset Turnover | 1.65 | 1.44 |
| Fixed Asset Turnover | 4.85 | 3.37 |
| Payout ratio | 46.14% | 2.44% |
| Dividend yield | 14.42% | 0.12% |
Interpretation of the Ratios
JBS N.V.
JBS displays a mix of strong and weak ratios, with favorable ROE at 21.47% and a low P/E of 3.2, signaling value potential, but concerns arise from a high debt-to-equity of 3.01 and debt-to-assets at 53.56%. The current ratio of 1.47 is neutral, indicating moderate liquidity. Dividend yield is 14.42% with a stable payout, supported by free cash flow, though high leverage poses risks.
The Magnum Ice Cream Company N.V.
Magnum Ice Cream presents generally favorable ratios, including a solid ROE of 16.2% and ROIC of 16.42%, but liquidity ratios are weak with a current ratio of 0.8 and quick ratio at 0.35, indicating potential short-term coverage issues. Debt levels are low, with a debt-to-equity of 0.07. The company does not pay dividends, likely reinvesting earnings to support growth and R&D.
Which one has the best ratios?
Magnum Ice Cream shows a more favorable overall ratio profile with stronger returns on invested capital and lower leverage, despite liquidity concerns. JBS has strengths in profitability and dividend yield but faces challenges from its high debt levels and mixed liquidity indicators. The choice depends on investor priorities between leverage risk and dividend income.
Strategic Positioning
This section compares the strategic positioning of JBS and MICC, focusing on market position, key segments, and exposure to technological disruption:
JBS
- Leading global protein and food company with diverse product range facing competitive pressure in packaged foods.
- Key segments include beef, pork, chicken, leather, biodiesel, and various food and by-products.
- Exposure to technological disruption not specified; operates in traditional food processing.
MICC
- Specialized ice cream business, focused on a single product segment in packaged foods.
- Exclusively operates in the ice cream segment, driving growth through product focus.
- No explicit exposure to technological disruption mentioned; focused on ice cream production.
JBS vs MICC Positioning
JBS pursues a diversified strategy across multiple protein and food products, offering broad market exposure but potential complexity. MICC concentrates solely on ice cream, allowing focused expertise but limited segment diversification.
Which has the best competitive advantage?
MICC shows a favorable MOAT with stable profitability and strong value creation, whereas JBS has a slightly favorable MOAT but declining profitability, indicating MICC currently holds a stronger competitive advantage.
Stock Comparison
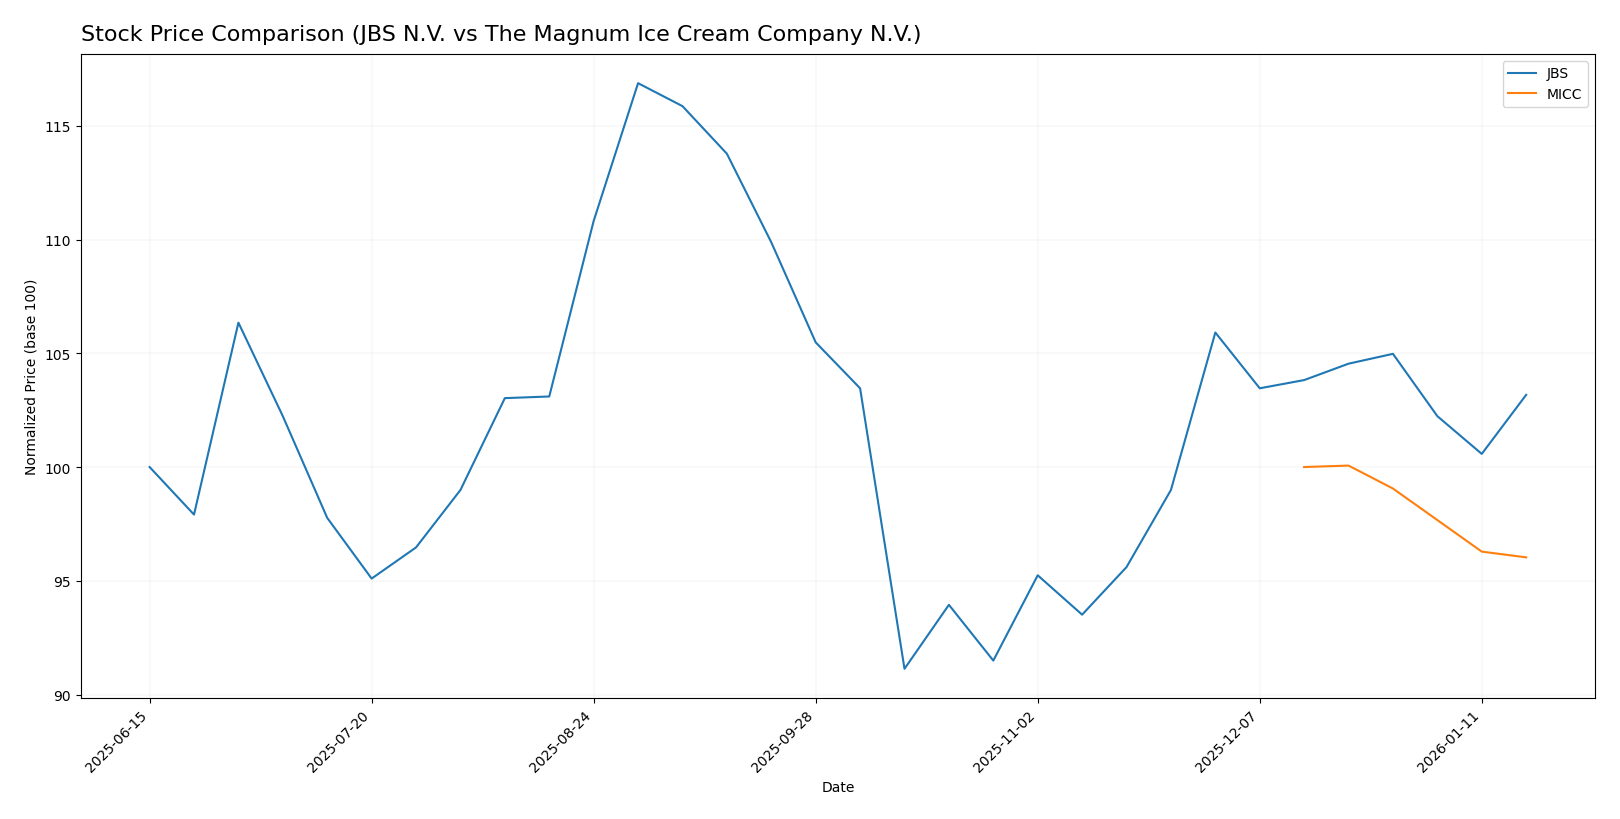
The stock price developments of JBS N.V. and The Magnum Ice Cream Company N.V. reveal contrasting trends over the past 12 months, with JBS showing a positive momentum and MICC experiencing a decline.
Trend Analysis
JBS N.V. exhibited a bullish trend over the past year with a 3.17% price increase, showing acceleration and a high of 16.21, supported by moderate volatility (0.9 std deviation).
The Magnum Ice Cream Company N.V. showed a bearish trend with a 3.97% price decline, maintaining a stable pace with limited volatility (0.26 std deviation) and a narrow price range between 15.24 and 15.88.
Comparing the two, JBS delivered the highest market performance, with positive growth contrasting MICC’s negative trend over the same period.
Target Prices
Analysts present a cautiously optimistic consensus on target prices for JBS N.V. and The Magnum Ice Cream Company N.V.
| Company | Target High | Target Low | Consensus |
|---|---|---|---|
| JBS N.V. | 20 | 17 | 18.5 |
| The Magnum Ice Cream Company N.V. | 16 | 16 | 16 |
Overall, the target prices suggest moderate upside potential for both stocks compared to their current prices of 14.31 for JBS and 15.24 for Magnum Ice Cream. Analysts expect JBS to outperform its current trading level more significantly.
Analyst Opinions Comparison
This section compares analysts’ ratings and grades for JBS and MICC:
Rating Comparison
JBS Rating
- Rating: A, indicating a very favorable overall assessment.
- Discounted Cash Flow Score: 4, favorable outlook on valuation based on cash flow.
- ROE Score: 5, very favorable, showing efficient profit generation from equity.
- ROA Score: 5, very favorable, reflecting excellent asset utilization.
- Debt To Equity Score: 1, very unfavorable, indicating high financial risk.
- Overall Score: 4, favorable overall financial standing.
MICC Rating
- Rating: B-, also marked as very favorable but lower than JBS.
- Discounted Cash Flow Score: 1, very unfavorable score suggesting concerns on valuation.
- ROE Score: 5, equally very favorable, indicating strong profit efficiency.
- ROA Score: 4, favorable, but slightly below JBS’s score.
- Debt To Equity Score: 1, very unfavorable, showing similar financial risk concerns.
- Overall Score: 3, moderate overall financial standing.
Which one is the best rated?
Based strictly on the provided data, JBS is better rated overall with a higher rating (A vs. B-) and stronger scores in discounted cash flow, ROA, and overall financial standing. Both have equally unfavorable debt-to-equity scores.
Scores Comparison
The comparison of the scores between JBS and The Magnum Ice Cream Company N.V. is as follows:
JBS Scores
- Altman Z-Score: 10.74, indicating a safe financial zone.
- Piotroski Score: 8, reflecting very strong financial health.
MICC Scores
- No data available for MICC.
- No data available for MICC.
Which company has the best scores?
Based on the available data, JBS demonstrates a high Altman Z-Score and a very strong Piotroski Score, whereas MICC’s scores are not provided, making JBS the company with the best documented financial scores.
Grades Comparison
The grades comparison for JBS N.V. and The Magnum Ice Cream Company N.V. is as follows:
JBS N.V. Grades
This table summarizes recent official grades assigned to JBS N.V. by verified grading companies.
| Grading Company | Action | New Grade | Date |
|---|---|---|---|
| JP Morgan | Maintain | Overweight | 2025-10-14 |
| JP Morgan | Maintain | Overweight | 2025-09-03 |
| Stephens & Co. | Maintain | Overweight | 2025-08-15 |
| Stephens & Co. | Maintain | Overweight | 2025-06-26 |
The grades for JBS N.V. consistently indicate an “Overweight” rating, reflecting a positive consensus among analysts.
There are no reliable grade data available for The Magnum Ice Cream Company N.V., so no grading table is presented. The absence of ratings suggests limited analyst coverage or data for this company.
Which company has the best grades?
JBS N.V. clearly has better grades with a consistent “Overweight” rating from reputable firms, while The Magnum Ice Cream Company N.V. lacks any published grades. This may influence investors seeking well-analyzed stocks with clearer outlooks.
Strengths and Weaknesses
The table below compares key strengths and weaknesses of JBS N.V. and The Magnum Ice Cream Company N.V. based on their diversification, profitability, innovation, global presence, and market share using the most recent data available.
| Criterion | JBS N.V. | The Magnum Ice Cream Company N.V. |
|---|---|---|
| Diversification | Moderate, focused on meat sector | More specialized in ice cream |
| Profitability | ROIC 8.61% (neutral), Net margin 2.31% (unfavorable) | ROIC 16.42% (favorable), Net margin 5.66% (neutral) |
| Innovation | Stable but limited innovation data | Shows steady innovation, stable profitability |
| Global presence | Strong global footprint | Mainly European market focus |
| Market Share | Large in meat industry | Leading niche in premium ice cream |
Key takeaways: JBS shows solid value creation with a broad global presence but faces profitability and debt structure challenges. Magnum Ice Cream has a favorable profitability profile and efficient capital use but operates in a more niche market with less diversification. Both companies demonstrate competitive moats, with Magnum showing a slightly stronger and more stable profitability trend.
Risk Analysis
The table below summarizes key risks associated with JBS N.V. and The Magnum Ice Cream Company N.V. based on the most recent 2024 data.
| Metric | JBS N.V. | The Magnum Ice Cream Company N.V. |
|---|---|---|
| Market Risk | Moderate (Beta 0.48, stable demand in protein sector) | Low (Beta 0, niche ice cream market) |
| Debt level | High (Debt-to-Equity 3.01, Debt-to-Assets 53.56%) | Low (Debt-to-Equity 0.07, Debt-to-Assets 3.41%) |
| Regulatory Risk | Elevated (Food safety and environmental laws) | Moderate (Consumer product regulations) |
| Operational Risk | High (Complex global supply chains, large workforce) | Moderate (Smaller scale operations) |
| Environmental Risk | Significant (Meat production impact, sustainability concerns) | Low (Ice cream production, less resource-intensive) |
| Geopolitical Risk | Moderate (Global operations, exposure to trade policies) | Low (Mostly localized in Netherlands) |
JBS faces the most impactful risks with high debt levels and significant environmental and operational risks due to the scale and nature of its protein business. Magnum Ice Cream’s risks are generally lower, with financial stability but some operational and regulatory exposure. Investors should weigh JBS’s growth potential against its financial leverage and environmental challenges.
Which Stock to Choose?
JBS N.V. shows a favorable income evolution with strong revenue and EPS growth, supported by a slightly favorable global ratios evaluation. Profitability is solid with a 21.47% ROE, though debt levels remain high, reflected in an unfavorable debt-to-equity ratio. Its rating is very favorable, indicating robust financial health.
The Magnum Ice Cream Company N.V. exhibits stable income with moderate revenue growth and a favorable ROIC. Profitability metrics are positive but less dynamic, with a 16.2% ROE and low debt, as shown by favorable leverage ratios. The rating is very favorable overall, despite some unfavorable liquidity and valuation ratios.
For investors, JBS might appear more attractive for those prioritizing growth and strong earnings improvement, while MICC could be better suited for those valuing stable profitability and low leverage. The choice might depend on the investor’s tolerance for debt and preference for income growth versus financial stability.
Disclaimer: Investment carries a risk of loss of initial capital. The past performance is not a reliable indicator of future results. Be sure to understand risks before making an investment decision.
Go Further
I encourage you to read the complete analyses of JBS N.V. and The Magnum Ice Cream Company N.V. to enhance your investment decisions: