In the competitive landscape of packaged foods, JBS N.V. and The J. M. Smucker Company stand out as influential players with distinct approaches. JBS, a global protein and food giant, contrasts with Smucker’s stronghold in branded consumer foods and beverages. Both companies innovate within overlapping markets, making their comparison insightful. Join me as we explore which company offers the most compelling investment opportunity in 2026.
Table of contents
Companies Overview
I will begin the comparison between JBS N.V. and The J. M. Smucker Company by providing an overview of these two companies and their main differences.
JBS N.V. Overview
JBS N.V. is a global protein and food company headquartered in Amstelveen, Netherlands. Founded in 1953, it operates in the packaged foods industry, offering a wide range of products including beef, pork, chicken, fish, and plant-based foods. Beyond meat processing, JBS also produces leather goods, biodiesel, packaging materials, and provides various logistics and industrial services with a workforce of about 280K employees.
The J. M. Smucker Company Overview
The J. M. Smucker Company, based in Orrville, Ohio, is a branded food and beverage manufacturer founded in 1897. It operates primarily in three segments: pet foods, coffee, and consumer foods. Smucker’s portfolio includes well-known brands in coffee, spreads, snacks, and pet products, distributed through diverse retail channels. The company employs around 9K people and focuses on the U.S. market within the packaged foods sector.
Key similarities and differences
Both JBS and Smucker operate within the packaged foods industry, serving consumers globally and maintaining a focus on branded products. However, JBS has a broader business model that includes meat processing, by-products, and industrial services, while Smucker concentrates on branded consumer foods and beverages with an emphasis on pet foods and coffee. JBS is significantly larger in scale with over 280K employees compared to Smucker’s 9K, reflecting their different operational scopes and market focuses.
Income Statement Comparison
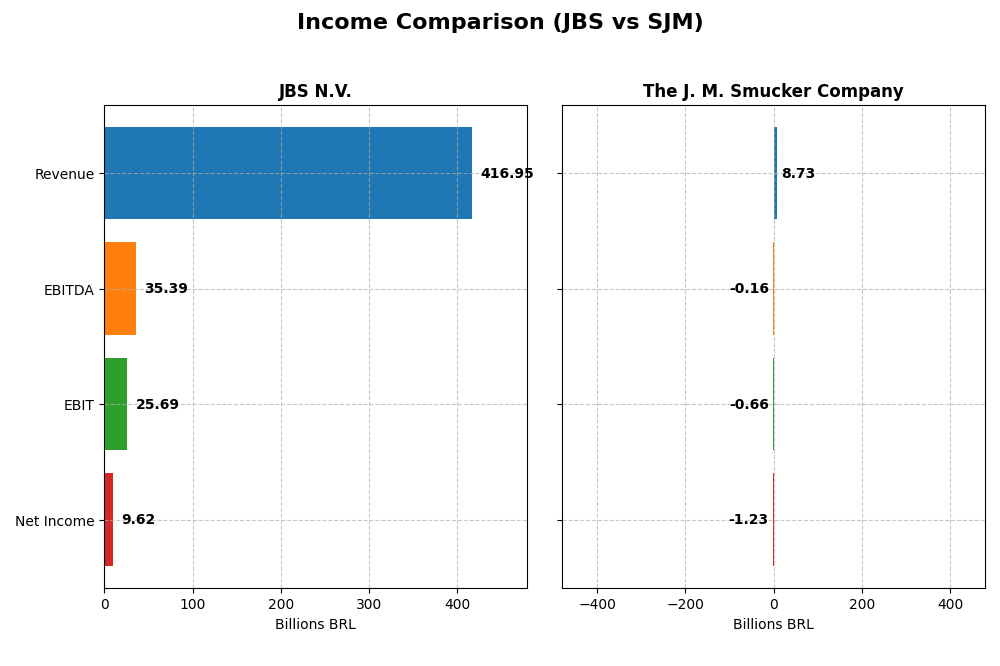
The table below presents a side-by-side comparison of the most recent full fiscal year income statement metrics for JBS N.V. and The J. M. Smucker Company, highlighting their financial performance and earnings per share.
| Metric | JBS N.V. (2024) | The J. M. Smucker Company (2025) |
|---|---|---|
| Market Cap | 31.7B BRL | 10.7B USD |
| Revenue | 417B BRL | 8.7B USD |
| EBITDA | 35.4B BRL | -156M USD |
| EBIT | 25.7B BRL | -658M USD |
| Net Income | 9.6B BRL | -1.23B USD |
| EPS | 30.55 BRL | -11.57 USD |
| Fiscal Year | 2024 | 2025 |
Income Statement Interpretations
JBS N.V.
JBS N.V. exhibited a favorable overall performance from 2020 to 2024, with revenue growing 54.31% and net income more than doubling. Margins remained mostly stable, with a neutral gross margin at 15.06% and a net margin of 2.31%. The 2024 year saw strong growth, including a 14.61% rise in revenue and an 890.83% increase in net margin, reflecting improving profitability.
The J. M. Smucker Company
The J. M. Smucker Company showed modest revenue growth of 9.04% over the 2021–2025 period but faced a decline in net income and margins. Gross margin was favorable at 38.79%, yet EBIT and net margins were negative in 2025. The latest year revealed a slowdown with a 6.69% revenue rise but significant declines in EBIT (-152.2%) and net margin (-255.05%), indicating profitability challenges.
Which one has the stronger fundamentals?
JBS N.V. demonstrates stronger fundamentals with consistent revenue and net income growth, stable margins, and favorable interest expense management. Conversely, The J. M. Smucker Company struggles with profitability despite reasonable gross margins and revenue growth. The overall income statement evaluation favors JBS, reflecting a more robust income profile and operational efficiency.
Financial Ratios Comparison
The table below presents a side-by-side comparison of the most recent key financial ratios for JBS N.V. and The J. M. Smucker Company, highlighting their operational efficiency, profitability, liquidity, and leverage.
| Ratios | JBS N.V. (2024) | The J. M. Smucker Company (2025) |
|---|---|---|
| ROE | 21.47% | -20.23% |
| ROIC | 8.61% | -5.09% |
| P/E | 3.20 | -10.05 |
| P/B | 0.69 | 2.03 |
| Current Ratio | 1.47 | 0.81 |
| Quick Ratio | 0.90 | 0.35 |
| D/E | 3.01 | 1.28 |
| Debt-to-Assets | 53.56% | 44.19% |
| Interest Coverage | 2.33 | -1.88 |
| Asset Turnover | 1.65 | 0.50 |
| Fixed Asset Turnover | 4.85 | 2.73 |
| Payout ratio | 46.14% | -37.00% |
| Dividend yield | 14.42% | 3.68% |
Interpretation of the Ratios
JBS N.V.
JBS displays a mixed ratio profile with strong return on equity (21.47%) and favorable valuation metrics like a P/E of 3.2 and P/B of 0.69, but concerns arise from a low net margin of 2.31% and high leverage (debt-to-equity 3.01). Its dividend yield is notable at 14.42%, supported by consistent dividend payments, though balance sheet risks remain.
The J. M. Smucker Company
Smucker’s ratios reflect significant weaknesses, including negative net margin (-14.1%), return on equity (-20.23%), and interest coverage (-1.84), indicating profitability and solvency challenges. Despite these, it offers a modest dividend yield of 3.68%, suggesting ongoing shareholder returns, but liquidity ratios below 1.0 highlight short-term financial stress.
Which one has the best ratios?
JBS’s ratio set is comparatively stronger, with half the ratios favorable and a slightly favorable overall opinion, contrasting sharply with Smucker’s predominantly unfavorable metrics and negative profitability. JBS’s valuation and efficiency ratios outperform, though leverage and margin concerns persist, while Smucker faces broader financial challenges and weaker operational returns.
Strategic Positioning
This section compares the strategic positioning of JBS N.V. and The J. M. Smucker Company, focusing on market position, key segments, and exposure to technological disruption:
JBS N.V.
- Large global protein and food company with diversified product range; faces broad competitive pressure.
- Key segments include beef, pork, chicken, plant-based products, leather, biodiesel, and logistics.
- Exposure to technological disruption not explicitly detailed; operates in traditional food processing and related industries.
The J. M. Smucker Company
- U.S.-focused branded food and beverage company with presence in pet foods, coffee, and snacks.
- Key segments are U.S. Retail Pet Foods, Coffee, Consumer Foods, Sweet Baked Snacks, and International.
- No explicit data on technological disruption exposure; operates in established packaged foods sectors.
JBS N.V. vs The J. M. Smucker Company Positioning
JBS has a diversified global presence across multiple protein and related product lines, while Smucker concentrates on branded U.S. retail food and beverage segments. JBS’s broader scope offers varied business drivers; Smucker’s focus allows specialization but less diversification.
Which has the best competitive advantage?
JBS shows a slightly favorable moat with value creation despite declining profitability, whereas Smucker has a very unfavorable moat, destroying value with sharply declining returns, indicating JBS currently holds the stronger competitive advantage.
Stock Comparison
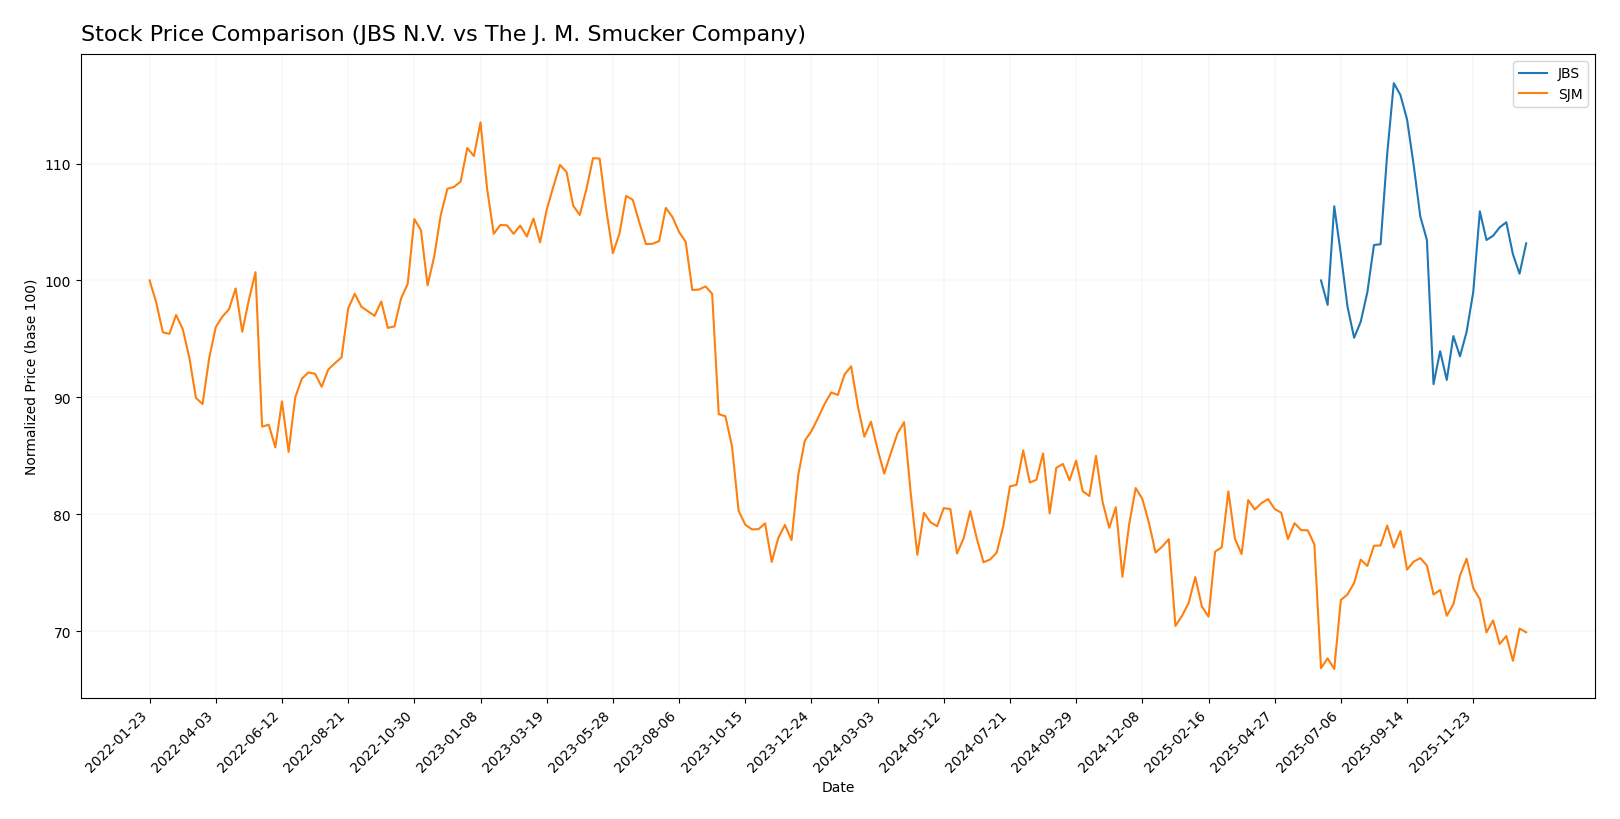
The stock prices of JBS N.V. and The J. M. Smucker Company have exhibited contrasting dynamics over the past 12 months, with JBS showing a steady upward trajectory and Smucker experiencing a significant decline.
Trend Analysis
JBS N.V. demonstrated a bullish trend over the past year with a 3.17% price increase, exhibiting acceleration and moderate volatility, reaching a high of 16.21 and a low of 12.64.
The J. M. Smucker Company recorded a bearish trend with a -20.49% price change, showing deceleration and high volatility, with prices ranging from 95.63 to 125.92 over the same period.
Comparatively, JBS outperformed Smucker in market performance, with a positive price change versus Smucker’s substantial decline over the past 12 months.
Target Prices
The current analyst consensus reflects moderate upside potential for both JBS N.V. and The J. M. Smucker Company.
| Company | Target High | Target Low | Consensus |
|---|---|---|---|
| JBS N.V. | 20 | 17 | 18.5 |
| The J. M. Smucker Company | 117 | 110 | 113.4 |
Analysts expect JBS shares to appreciate from $14.31 to around $18.5, indicating a notable upside. Smucker’s target consensus of $113.4 also suggests a moderate increase from the current $100.12 price.
Analyst Opinions Comparison
This section compares analysts’ ratings and financial scores for JBS N.V. and The J. M. Smucker Company:
Rating Comparison
JBS Rating
- Rating: A, indicating a very favorable overall assessment by analysts.
- Discounted Cash Flow Score: 4, showing a favorable valuation based on cash flows.
- ROE Score: 5, very favorable, indicating efficient profit generation.
- ROA Score: 5, very favorable, reflecting strong asset utilization.
- Debt To Equity Score: 1, very unfavorable, suggesting high financial risk.
- Overall Score: 4, favorable overall financial standing.
SJM Rating
- Rating: C+, reflecting a moderate overall assessment by analysts.
- Discounted Cash Flow Score: 5, rated very favorable for undervaluation.
- ROE Score: 1, very unfavorable, showing weak equity profit efficiency.
- ROA Score: 1, very unfavorable, indicating poor asset earnings generation.
- Debt To Equity Score: 1, very unfavorable, also indicating high financial risk.
- Overall Score: 2, moderate overall financial standing.
Which one is the best rated?
Based on the provided data, JBS holds a stronger overall rating (A) and higher scores in ROE and ROA compared to SJM’s lower rating (C+) and weak profitability scores. Despite both having unfavorable debt-to-equity scores, JBS is clearly better rated overall.
Scores Comparison
The comparison of the Altman Z-Score and Piotroski Score for both companies is as follows:
JBS Scores
- Altman Z-Score: 10.74, indicating a safe zone with low bankruptcy risk.
- Piotroski Score: 8, classified as very strong financial health.
SJM Scores
- Altman Z-Score: 0.90, indicating a distress zone with high bankruptcy risk.
- Piotroski Score: 4, indicating average financial strength.
Which company has the best scores?
Based on the provided data, JBS holds significantly stronger scores, with a very safe Altman Z-Score and a very strong Piotroski Score. SJM’s scores indicate financial distress and only average strength, showing a weaker financial position compared to JBS.
Grades Comparison
Here is the comparison of the latest reliable grades from recognized grading companies for both companies:
JBS N.V. Grades
The following table summarizes recent grades assigned by reputable firms for JBS N.V.:
| Grading Company | Action | New Grade | Date |
|---|---|---|---|
| JP Morgan | Maintain | Overweight | 2025-10-14 |
| JP Morgan | Maintain | Overweight | 2025-09-03 |
| Stephens & Co. | Maintain | Overweight | 2025-08-15 |
| Stephens & Co. | Maintain | Overweight | 2025-06-26 |
Overall, JBS N.V. consistently received “Overweight” ratings, indicating a positive outlook from analysts.
The J. M. Smucker Company Grades
The table below details the recent grades assigned by recognized institutions for The J. M. Smucker Company:
| Grading Company | Action | New Grade | Date |
|---|---|---|---|
| TD Cowen | Maintain | Hold | 2026-01-08 |
| Bernstein | Maintain | Market Perform | 2025-11-26 |
| Stifel | Maintain | Hold | 2025-11-26 |
| UBS | Maintain | Buy | 2025-11-26 |
| Morgan Stanley | Maintain | Overweight | 2025-11-26 |
| JP Morgan | Maintain | Overweight | 2025-11-26 |
| Stifel | Maintain | Hold | 2025-10-24 |
| Argus Research | Downgrade | Hold | 2025-09-12 |
| Barclays | Maintain | Equal Weight | 2025-08-29 |
| JP Morgan | Maintain | Overweight | 2025-08-28 |
The grades for The J. M. Smucker Company vary, ranging from “Hold” to “Overweight,” reflecting a more mixed analyst sentiment.
Which company has the best grades?
JBS N.V. holds consistently positive “Overweight” grades, while The J. M. Smucker Company shows a broader range from “Hold” to “Overweight.” Investors may interpret JBS’s uniform favorable grades as stronger analyst confidence compared to the more cautious or varied outlook on Smucker.
Strengths and Weaknesses
Below is a comparison of key strengths and weaknesses for JBS N.V. and The J. M. Smucker Company based on recent financial and strategic data.
| Criterion | JBS N.V. | The J. M. Smucker Company |
|---|---|---|
| Diversification | Focused on meat processing; moderate product range | Broad product portfolio: pet foods, coffee, snacks, consumer foods |
| Profitability | ROIC 8.61%, ROE 21.47%, but low net margin 2.31% | Negative profitability: ROIC -5.09%, ROE -20.23%, net margin -14.1% |
| Innovation | Moderate, with efficiency gains in asset turnover | Innovation challenged by declining margins and profitability |
| Global presence | Strong global meat market presence | Mainly US-focused with some international sales |
| Market Share | Significant in global meat industry | Leading in US retail categories but facing headwinds |
Key takeaway: JBS shows better profitability and value creation despite some declining trends, supported by operational efficiency and global reach. Smucker struggles with profitability and financial health, despite a diversified product lineup and strong brand presence in the US. Investors should weigh JBS’s steady value creation against Smucker’s current financial challenges.
Risk Analysis
Below is a comparison of key risk factors for JBS N.V. and The J. M. Smucker Company based on the most recent data from 2025-2026.
| Metric | JBS N.V. | The J. M. Smucker Company |
|---|---|---|
| Market Risk | Moderate (Beta 0.48) | Low (Beta 0.22) |
| Debt level | High (D/E 3.01, 53.6% debt to assets) | Moderate (D/E 1.28, 44.2% debt to assets) |
| Regulatory Risk | Moderate (Food industry regulations, global operations) | Moderate (Food safety and labeling regulations) |
| Operational Risk | High (Complex global supply chain, large workforce 280K) | Moderate (Smaller workforce 9K, diversified product lines) |
| Environmental Risk | Moderate (Meat production impact, sustainability pressures) | Moderate (Agricultural sourcing and packaging impact) |
| Geopolitical Risk | Moderate to High (Operations in multiple countries including Brazil) | Low to Moderate (Primarily US-focused) |
JBS faces significant debt-related and operational risks due to its large scale and global footprint, with regulatory and environmental challenges in meat production. Smucker struggles more with profitability and financial stability, increasing operational and market vulnerabilities despite lower leverage and geographic concentration. JBS’s strong Altman Z-Score (10.7, safe zone) contrasts with Smucker’s distress zone score (0.9), highlighting JBS’s better financial resilience despite risks.
Which Stock to Choose?
JBS N.V. shows a favorable income evolution with strong revenue and net income growth, a slightly favorable global ratio profile, high profitability indicated by a 21.47% ROE, but carries a relatively high debt level with a debt-to-equity ratio of 3.01; its overall rating is very favorable.
The J. M. Smucker Company exhibits an unfavorable income evolution marked by negative net margin and declining profitability, an unfavorable global ratios evaluation, lower returns on equity and assets, moderate debt levels with a debt-to-equity ratio of 1.28, and a moderate overall rating.
For investors prioritizing growth and stronger financial health, JBS may appear more favorable given its value-creating moat and robust income trends, whereas those with tolerance for volatility but seeking potential value in turnaround scenarios might view SJM’s profile differently; the choice could depend on risk preference and investment strategy.
Disclaimer: Investment carries a risk of loss of initial capital. The past performance is not a reliable indicator of future results. Be sure to understand risks before making an investment decision.
Go Further
I encourage you to read the complete analyses of JBS N.V. and The J. M. Smucker Company to enhance your investment decisions: