Home > Comparison > Consumer Defensive > JBS vs MKC
The strategic rivalry between JBS N.V. and McCormick & Company, Incorporated defines the current trajectory of the packaged foods sector. JBS operates as a capital-intensive protein and food conglomerate with extensive vertical integration. In contrast, McCormick excels as a high-margin, brand-driven seasoning and flavor solutions provider. This analysis aims to identify which company offers a superior risk-adjusted return, balancing scale and innovation for a diversified portfolio.
Table of contents
Companies Overview
JBS N.V. and McCormick & Company hold pivotal roles in the global packaged foods industry. Both leverage distinctive approaches to capture consumer demand in highly competitive markets.
JBS N.V.: Global Protein and Food Powerhouse
JBS N.V. dominates as a protein and food company worldwide, generating revenue from beef, pork, poultry, and plant-based products. Its vast product mix extends to leather, biodiesel, and logistics services. In 2026, JBS focuses strategically on vertical integration, controlling the entire supply chain from livestock to processed foods to optimize margins and ensure supply resilience.
McCormick & Company: Flavor Innovator and Seasoning Leader
McCormick & Company leads as a manufacturer and distributor of spices and seasonings globally. Its revenue streams come from branded consumer products and flavor solutions for food manufacturers. In 2026, McCormick emphasizes expanding its flavor solutions segment, catering to multinational food companies with customized seasoning blends to capture higher-margin B2B sales.
Strategic Collision: Similarities & Divergences
Both firms operate in packaged foods but differ fundamentally: JBS pursues a vertically integrated, broad-based protein model, while McCormick champions specialized flavor innovation with a dual consumer-B2B focus. They compete indirectly in food ingredient markets but face distinct value chains and customer bases. JBS offers scale and supply control, whereas McCormick delivers product differentiation. Their investment profiles reflect these contrasts—JBS as a volume-driven industrial player, McCormick as a niche brand-driven growth story.
Income Statement Comparison
This table dissects the core profitability and scalability of both corporate engines to reveal who dominates the bottom line:
| Metric | JBS N.V. (JBS) | McCormick & Company (MKC) |
|---|---|---|
| Revenue | 417B BRL | 6.84B USD |
| Cost of Revenue | 354B BRL | 4.25B USD |
| Operating Expenses | 39B BRL | 1.5B USD |
| Gross Profit | 63B BRL | 2.59B USD |
| EBITDA | 35B BRL | 1.34B USD |
| EBIT | 26B BRL | 1.11B USD |
| Interest Expense | 1.65B BRL | 196M USD |
| Net Income | 9.6B BRL | 789M USD |
| EPS | 30.55 BRL | 2.94 USD |
| Fiscal Year | 2024 | 2025 |
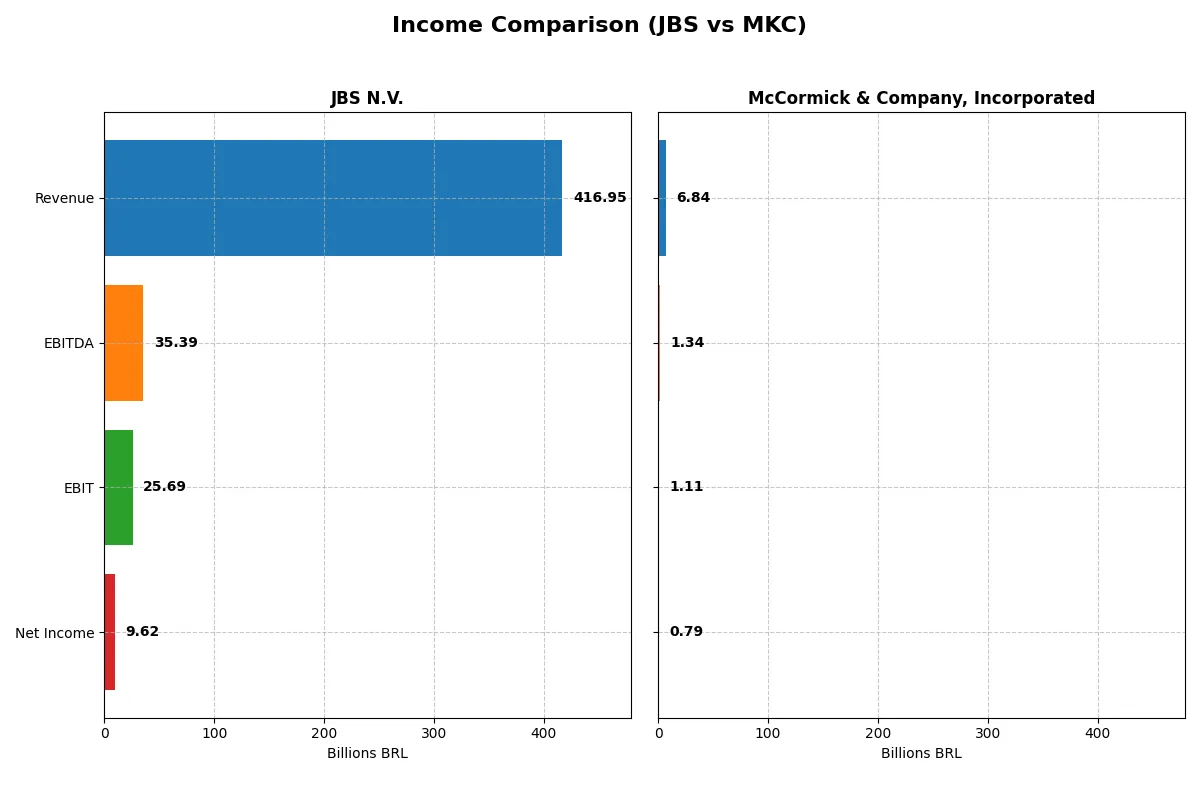
Income Statement Analysis: The Bottom-Line Duel
This income statement comparison reveals how efficiently each company converts sales into profits and sustains momentum in their core business engines.
JBS N.V. Analysis
JBS N.V. demonstrates strong revenue growth, rising 14.6% in 2024 to BRL 417B, with net income soaring from a loss in 2023 to BRL 9.6B. Gross and net margins remain stable around 15% and 2.3%, respectively, reflecting solid cost control despite large scale. The surge in EBIT and EPS signals renewed operational efficiency and robust momentum.
McCormick & Company, Incorporated Analysis
McCormick posts steady revenue growth of 1.7% in 2025, hitting USD 6.8B, with net income slightly down to USD 789M. The firm maintains a healthy gross margin near 38% and a strong net margin of 11.5%, illustrating superior profitability relative to peers. However, recent growth rates flatten, indicating a mature business with modest momentum.
Margin Power vs. Revenue Scale
JBS leads in revenue scale and rapid profit recovery, showing remarkable margin expansion and EPS growth. McCormick excels in margin quality and consistent profitability but exhibits slower top-line and bottom-line growth. For investors, JBS offers high momentum and scale, while McCormick presents a stable, margin-rich profile suited for steady returns.
Financial Ratios Comparison
These vital ratios act as a diagnostic tool to expose the underlying fiscal health, valuation premiums, and capital efficiency of the companies compared below:
| Ratios | JBS N.V. (JBS) | McCormick & Company (MKC) |
|---|---|---|
| ROE | 21.47% (2024) | 13.76% (2025) |
| ROIC | 8.61% (2024) | 7.93% (2025) |
| P/E | 3.20 (2024) | 22.59 (2025) |
| P/B | 0.69 (2024) | 3.11 (2025) |
| Current Ratio | 1.47 (2024) | 0.70 (2025) |
| Quick Ratio | 0.90 (2024) | 0.28 (2025) |
| D/E (Debt to Equity) | 3.01 (2024) | 0.70 (2025) |
| Debt-to-Assets | 53.6% (2024) | 30.3% (2025) |
| Interest Coverage | 14.43 (2024) | 5.57 (2025) |
| Asset Turnover | 1.65 (2024) | 0.52 (2025) |
| Fixed Asset Turnover | 4.85 (2024) | 4.72 (2025) |
| Payout ratio | 46.1% (2024) | 61.2% (2025) |
| Dividend yield | 14.42% (2024) | 2.71% (2025) |
| Fiscal Year | 2024 | 2025 |
Efficiency & Valuation Duel: The Vital Signs
Financial ratios serve as a company’s DNA, unveiling hidden risks and operational excellence through key profitability and valuation metrics.
JBS N.V.
JBS posts a strong 21.5% ROE, signaling effective shareholder value creation despite a low 2.3% net margin. The stock trades at a cheap 3.2 P/E and 0.69 P/B, indicating undervaluation. A robust 14.4% dividend yield supports shareholder returns amid moderate reinvestment, reflecting prudent capital allocation.
McCormick & Company, Incorporated
McCormick delivers an 11.5% net margin and a moderate 13.8% ROE, showing efficient profitability. Its valuation appears stretched with a 22.6 P/E and a high 3.11 P/B. The company maintains a modest 2.7% dividend yield, balancing shareholder payback with reinvestment focused on sustaining growth.
Undervalued Strength vs. Premium Stability
JBS offers superior valuation and return on equity, balancing risk with attractive dividends. McCormick trades at a premium for stable margins and moderate returns. Value investors may favor JBS’s efficiency, while growth-oriented profiles might lean toward McCormick’s steady profitability.
Which one offers the Superior Shareholder Reward?
I see JBS N.V. delivers an exceptional 14.4% dividend yield in 2024, backed by a 46% payout ratio and strong free cash flow coverage at 66%. Its buyback program is less emphasized but dividend sustainability appears solid despite leverage risks. McCormick & Company offers a more modest 2.7% yield with a 61% payout ratio and robust buybacks fueling total returns. MKC’s model balances dividends with capital reinvestment and steady buybacks, supporting long-term growth. I conclude JBS provides superior immediate yield and shareholder reward in 2026, but MKC’s distribution approach offers a more sustainable, balanced total return profile for patient investors.
Comparative Score Analysis: The Strategic Profile
The radar chart reveals the fundamental DNA and trade-offs of JBS N.V. and McCormick & Company, Incorporated, exposing their financial strengths and vulnerabilities:
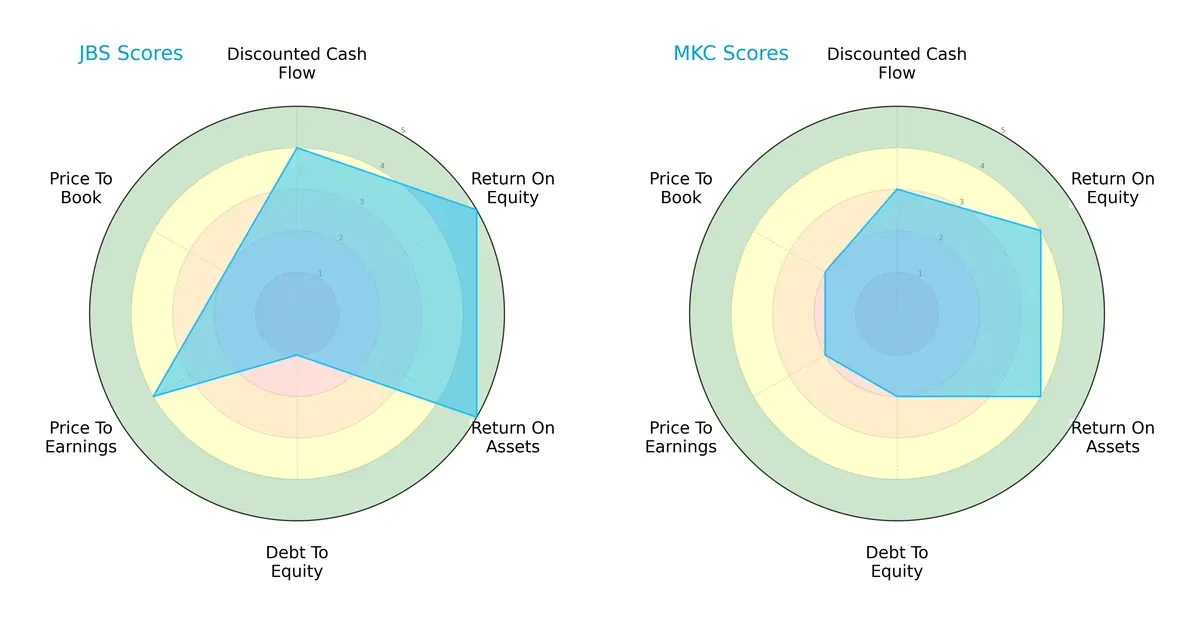
JBS outperforms McCormick in profitability metrics with higher ROE (5 vs. 4) and ROA (5 vs. 4) scores, showing superior asset and equity efficiency. JBS also leads in Discounted Cash Flow (4 vs. 3) and Price-to-Earnings valuation (4 vs. 2), indicating better cash flow prospects and relative undervaluation. However, JBS carries a considerable debt risk with a Debt/Equity score of 1, far weaker than McCormick’s moderate 2. McCormick offers a more balanced but moderate profile without a singular edge, while JBS relies heavily on operational efficiency but with financial leverage risks.
Bankruptcy Risk: Solvency Showdown
JBS’s Altman Z-Score of 13.45 vastly surpasses McCormick’s 2.49, signaling a rock-solid solvency position against McCormick’s borderline grey zone risk:
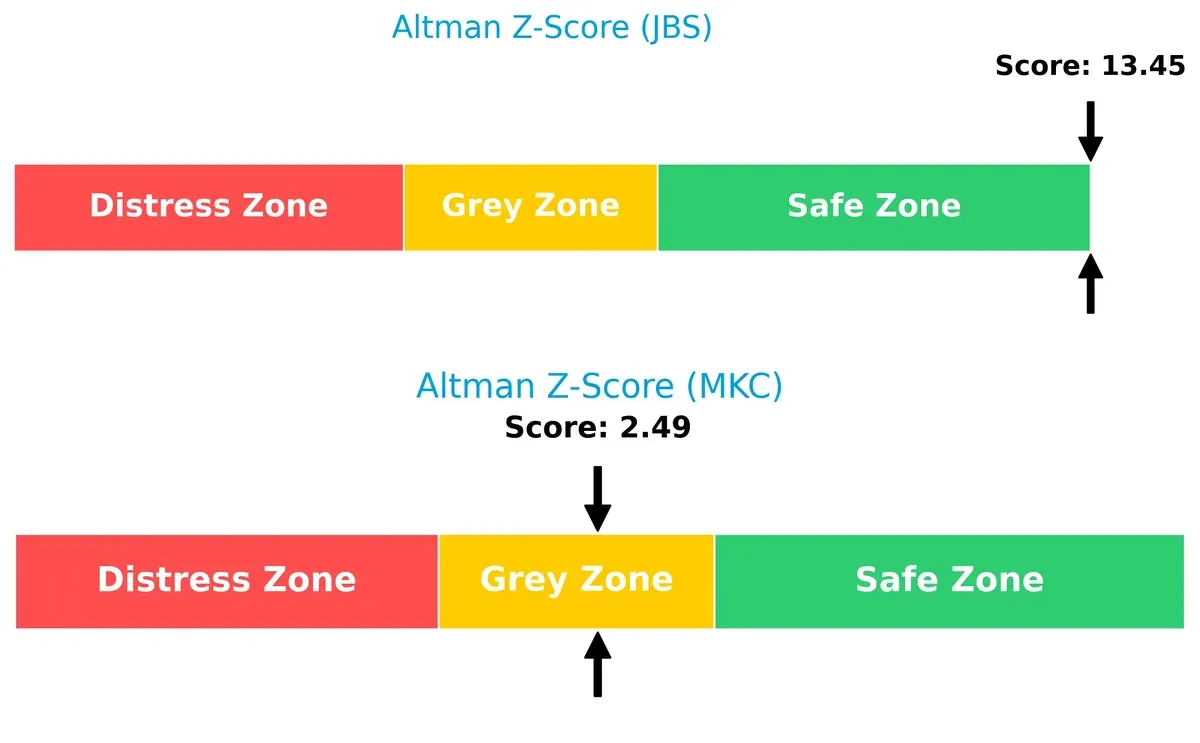
JBS’s score situates it deep in the safe zone, reflecting robust financial health and resilience to economic downturns. McCormick’s position in the grey zone warns of moderate bankruptcy risk, demanding cautious monitoring amid market fluctuations.
Financial Health: Quality of Operations
Both companies share an identical Piotroski F-Score of 6, indicating average financial health with no glaring red flags between them:
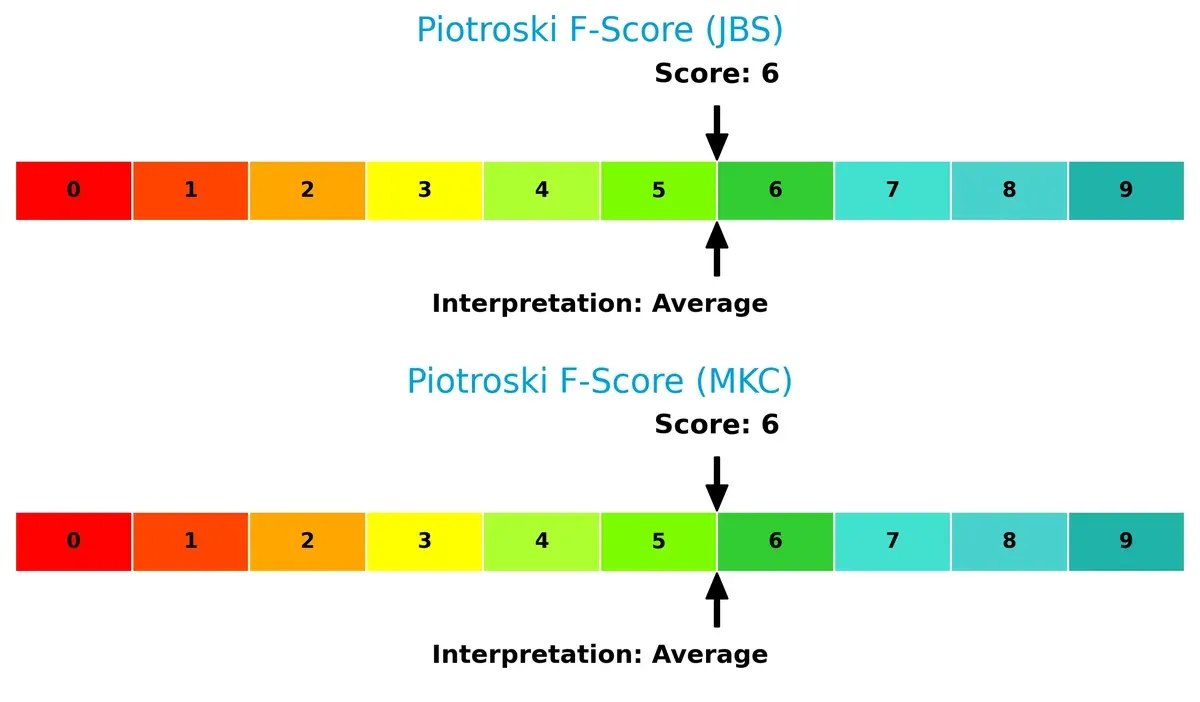
A score of 6 suggests each firm maintains decent profitability, leverage, and operational efficiency, but neither demonstrates peak internal financial strength. Investors should watch for improvements in internal metrics to elevate confidence in sustained value creation.
How are the two companies positioned?
This section dissects the operational DNA of JBS and McCormick by comparing their revenue distribution by segment and analyzing their internal strengths and weaknesses. The goal is to confront their economic moats and identify which model delivers the most resilient, sustainable competitive advantage today.
Revenue Segmentation: The Strategic Mix
This comparison dissects how JBS N.V. and McCormick & Company diversify their income streams and where their primary sector bets lie:
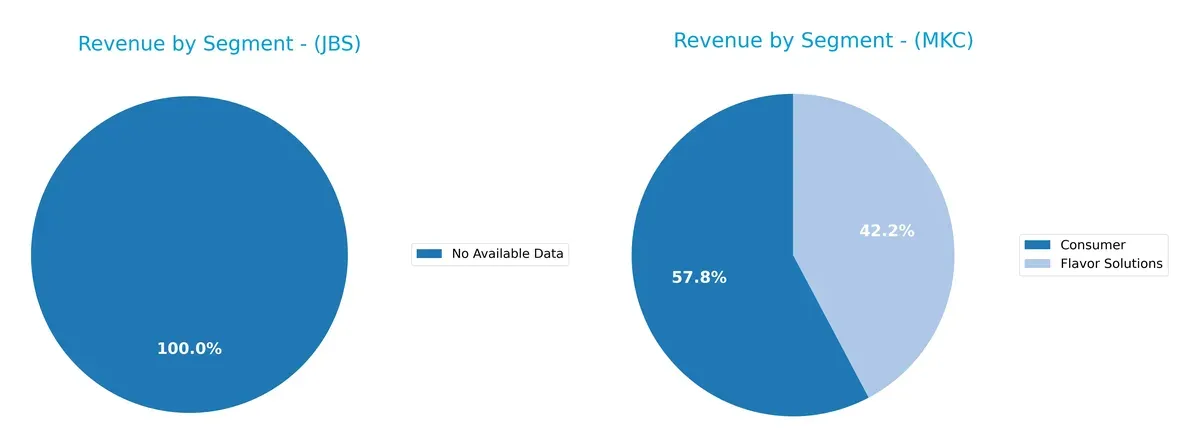
McCormick leans on two strong segments: Consumer at $3.95B and Flavor Solutions at $2.89B in 2025. This mix shows moderate diversification, balancing consumer products with specialized flavor solutions. JBS offers no segment data, so I cannot assess its revenue spread. McCormick’s dual-segment approach mitigates concentration risk and supports ecosystem lock-in through product innovation and brand loyalty. This contrasts with firms anchored by single dominant segments, which face higher cyclicality and competitive pressure.
Strengths and Weaknesses Comparison
This table compares the Strengths and Weaknesses of JBS and McCormick based on diversification, profitability, financials, innovation, global presence, and market share:
JBS Strengths
- Strong return on equity at 21.47%
- Favorable WACC at 4.62% supports capital efficiency
- Low PE of 3.2 indicates valuation upside
- High asset turnover of 1.65 improves operational efficiency
- Robust fixed asset turnover at 4.85 enhances productivity
- High interest coverage ratio of 15.6 reduces financial risk
McCormick Strengths
- Solid net margin of 11.54% reflects operational profitability
- Favorable WACC at 6.17% underpins cost of capital
- Strong fixed asset turnover of 4.72 supports asset utilization
- Favorable dividend yield at 2.71% attracts income investors
- Geographic diversification across Americas, EMEA, Asia Pacific
- Balanced revenue from Consumer and Flavor Solutions segments
JBS Weaknesses
- Low net margin at 2.31% signals thin profitability
- High debt-to-equity of 3.01 increases leverage risk
- Elevated debt-to-assets ratio of 53.56% pressures balance sheet
- Quick ratio at 0.9 indicates moderate liquidity constraints
- Lack of disclosed geographic and product diversification data
McCormick Weaknesses
- Low current ratio at 0.7 signals liquidity risk
- Very low quick ratio at 0.28 highlights short-term solvency issues
- High price-to-book of 3.11 may imply overvaluation
- Neutral return on equity of 13.76% limits shareholder returns
- Asset turnover of 0.52 indicates less efficient asset use
Overall, JBS shows operational efficiency and strong capital returns but carries financial leverage and profitability concerns. McCormick benefits from product and geographic diversification with superior margin metrics but faces liquidity challenges and valuation risks. These contrasts shape their strategic priorities around balance sheet management and growth focus.
The Moat Duel: Analyzing Competitive Defensibility
A structural moat is the only barrier protecting long-term profits from relentless competition erosion. Let’s examine how these moats shape JBS and McCormick & Company:
JBS N.V.: Scale-Driven Cost Advantage
JBS leverages vast global scale and integrated supply chains to maintain a cost advantage. This manifests in solid revenue growth and improving net margins. New plant-based and expanded protein lines could deepen its moat in 2026.
McCormick & Company, Incorporated: Brand-Driven Intangible Assets
McCormick’s moat rests on powerful brand recognition and consumer loyalty, sustaining high margins unlike JBS’s cost-driven model. Its expanding global seasoning portfolio fuels growing ROIC, signaling rising competitive strength.
Scale Cost Advantage vs. Brand Intangibles
JBS holds a wider moat through scale and cost efficiency, creating value despite a slight ROIC decline. McCormick’s narrower but deepening brand moat shows improving profitability. JBS remains better equipped to defend market share amid commoditized food sectors.
Which stock offers better returns?
JBS N.V. shows a strong upward trajectory over the past 12 months, while McCormick & Company, Incorporated experiences a notable decline in stock price.
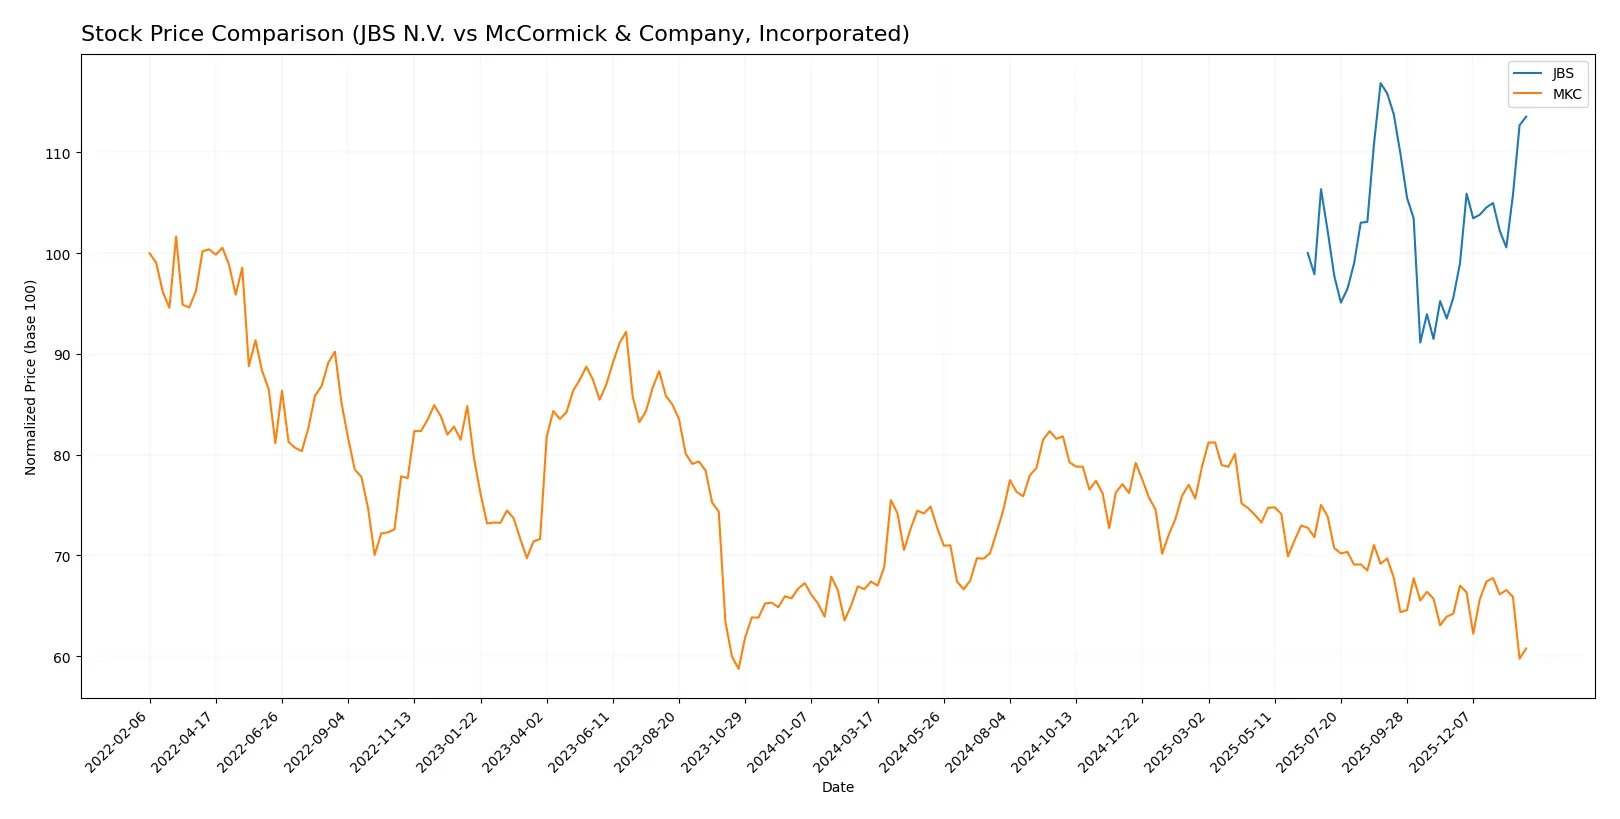
Trend Comparison
JBS N.V. posts a 13.55% price increase over the past year, marking a bullish trend with accelerating momentum and a low 0.95 volatility. The stock hit a high of 16.21 and a low of 12.64 during this period.
McCormick & Company, Incorporated declines 9.84% over the same timeframe, showing a bearish trend with deceleration and higher volatility at 5.29. The stock peaked at 83.76 and bottomed at 60.79.
JBS outperforms McCormick clearly, delivering the highest market returns and stronger positive momentum over the last 12 months.
Target Prices
Analysts show a moderately bullish consensus for both JBS N.V. and McCormick & Company, Incorporated.
| Company | Target Low | Target High | Consensus |
|---|---|---|---|
| JBS N.V. | 17 | 20 | 18.5 |
| McCormick & Company, Inc. | 67 | 85 | 73.57 |
JBS’s consensus target of 18.5 suggests a 17.5% upside from the current 15.75 price. McCormick’s 73.57 target implies a 19% gain over today’s 61.83 price.

Don’t Let Luck Decide Your Entry Point
Optimize your entry points with our advanced ProRealTime indicators. You’ll get efficient buy signals with precise price targets for maximum performance. Start outperforming now!
How do institutions grade them?
Here is a summary of recent institutional grades for JBS N.V. and McCormick & Company, Incorporated:
JBS N.V. Grades
The following table shows recent grades from reputable financial institutions for JBS N.V.:
| Grading Company | Action | New Grade | Date |
|---|---|---|---|
| JP Morgan | Maintain | Overweight | 2025-10-14 |
| JP Morgan | Maintain | Overweight | 2025-09-03 |
| Stephens & Co. | Maintain | Overweight | 2025-08-15 |
| Stephens & Co. | Maintain | Overweight | 2025-06-26 |
McCormick & Company, Incorporated Grades
Below are recent grades from established grading firms for McCormick & Company, Incorporated:
| Grading Company | Action | New Grade | Date |
|---|---|---|---|
| Barclays | Maintain | Equal Weight | 2026-01-26 |
| UBS | Maintain | Neutral | 2026-01-23 |
| Stifel | Maintain | Hold | 2026-01-23 |
| Barclays | Maintain | Equal Weight | 2025-10-08 |
| Jefferies | Maintain | Buy | 2025-10-08 |
| Deutsche Bank | Maintain | Hold | 2025-10-08 |
| Stifel | Maintain | Hold | 2025-10-08 |
| UBS | Maintain | Neutral | 2025-10-08 |
| Bernstein | Maintain | Outperform | 2025-10-08 |
| UBS | Maintain | Neutral | 2025-10-01 |
Which company has the best grades?
McCormick shows a broader range of grades, including Buy and Outperform, while JBS consistently receives Overweight ratings. McCormick’s varied grades may indicate mixed analyst views, potentially impacting investor confidence differently than JBS’s steady outlook.
Risks specific to each company
The following categories identify the critical pressure points and systemic threats facing both firms in the 2026 market environment:
1. Market & Competition
JBS N.V.
- Faces intense global competition in protein and food sectors, pressured by commodity price volatility and shifting consumer preferences.
McCormick & Company, Incorporated
- Competes in a niche spice and seasoning market with strong brand loyalty but faces innovation pressure and retailer consolidation.
2. Capital Structure & Debt
JBS N.V.
- High leverage with debt-to-equity of 3.01 signals elevated financial risk despite strong interest coverage of 15.6x.
McCormick & Company, Incorporated
- Moderate leverage with debt-to-equity of 0.7 presents manageable risk; however, weak liquidity ratios raise short-term solvency concerns.
3. Stock Volatility
JBS N.V.
- Low beta at 0.48 indicates lower stock volatility, which may appeal to risk-averse investors.
McCormick & Company, Incorporated
- Slightly higher beta of 0.62 suggests moderate sensitivity to market swings, reflecting sector cyclicality.
4. Regulatory & Legal
JBS N.V.
- Exposed to complex environmental and food safety regulations globally, with potential legal risks from supply chain practices.
McCormick & Company, Incorporated
- Faces regulatory scrutiny primarily related to food safety and labeling, with fewer broad environmental risks.
5. Supply Chain & Operations
JBS N.V.
- Large, diversified operations create complexity and exposure to raw material price swings and logistics disruptions.
McCormick & Company, Incorporated
- Relies on select raw materials; supply chain risks include commodity price inflation and sourcing from politically unstable regions.
6. ESG & Climate Transition
JBS N.V.
- Significant ESG challenges due to environmental impact of meat production and pressure to reduce carbon footprint.
McCormick & Company, Incorporated
- ESG risks moderate but increasing focus on sustainable sourcing and reducing environmental impact in flavor solutions.
7. Geopolitical Exposure
JBS N.V.
- Operates globally with exposure to emerging market instability and trade tensions impacting supply and sales.
McCormick & Company, Incorporated
- More US-centric with limited geopolitical risk, but global sourcing exposes it to tariffs and trade policy changes.
Which company shows a better risk-adjusted profile?
JBS’s most impactful risk lies in its high leverage, raising financial vulnerability despite operational scale. McCormick faces critical short-term liquidity risks, impairing flexibility despite moderate debt levels. Overall, JBS’s lower stock volatility and strong interest coverage grant it a somewhat better risk-adjusted profile. Notably, JBS’s Altman Z-Score in the safe zone contrasts with McCormick’s grey zone, underscoring its stronger financial stability despite leverage concerns.
Final Verdict: Which stock to choose?
JBS N.V. stands out as a robust cash generator with a strong operational efficiency that fuels its growth trajectory. Its ability to create value above its cost of capital marks a strategic advantage. However, its elevated leverage is a point of vigilance, implying higher financial risk. JBS suits an Aggressive Growth portfolio willing to embrace volatility for outsized returns.
McCormick & Company commands a strategic moat rooted in premium brand equity and steady recurring revenues. Its improving profitability and conservative debt levels offer greater safety compared to JBS. Despite a pricier valuation, McCormick fits well in a GARP (Growth at a Reasonable Price) portfolio seeking sustainable growth with moderate risk.
If you prioritize aggressive expansion and value creation dynamics, JBS outshines with superior cash flow generation and operational momentum. However, if you seek better stability and brand-driven durability, McCormick offers a safer profile with a growing competitive edge. Each appeals to distinct investor avatars balancing risk and growth preferences.
Disclaimer: Investment carries a risk of loss of initial capital. The past performance is not a reliable indicator of future results. Be sure to understand risks before making an investment decision.
Go Further
I encourage you to read the complete analyses of JBS N.V. and McCormick & Company, Incorporated to enhance your investment decisions: