Investors seeking opportunities in the packaged foods sector often compare JBS N.V. and Lamb Weston Holdings, Inc., two prominent players with overlapping markets yet distinct product focuses. JBS excels in diversified protein and food products globally, while Lamb Weston specializes in value-added frozen potato offerings. This article will analyze their innovation strategies, market positions, and financial dynamics to help you decide which company presents the most compelling investment case in 2026.

Table of contents
Companies Overview
I will begin the comparison between JBS N.V. and Lamb Weston Holdings, Inc. by providing an overview of these two companies and their main differences.
JBS N.V. Overview
JBS N.V. operates globally as a protein and food company offering a wide range of meat products including beef, pork, chicken, and fish, alongside plant-based foods and various by-products such as leather and biodiesel. Founded in 1953 and based in Amstelveen, Netherlands, it holds a significant position in the packaged foods industry with a workforce of 280K employees and a market cap of $31.7B.
Lamb Weston Holdings, Inc. Overview
Lamb Weston Holdings, Inc. specializes in the production, distribution, and marketing of value-added frozen potato products worldwide. Founded in 1950 and headquartered in Eagle, Idaho, the company operates through segments like Global, Foodservice, and Retail, serving various customers including retailers and restaurants. It employs 10.7K people and has a market capitalization of $5.8B.
Key similarities and differences
Both companies operate in the packaged foods sector and serve global markets with consumer-focused products. JBS concentrates on a broad protein portfolio and related by-products, while Lamb Weston focuses primarily on frozen potato products and value-added food items. JBS is considerably larger in scale and employee count, reflecting a more diversified product range compared to Lamb Weston’s specialized frozen foods business.
Income Statement Comparison
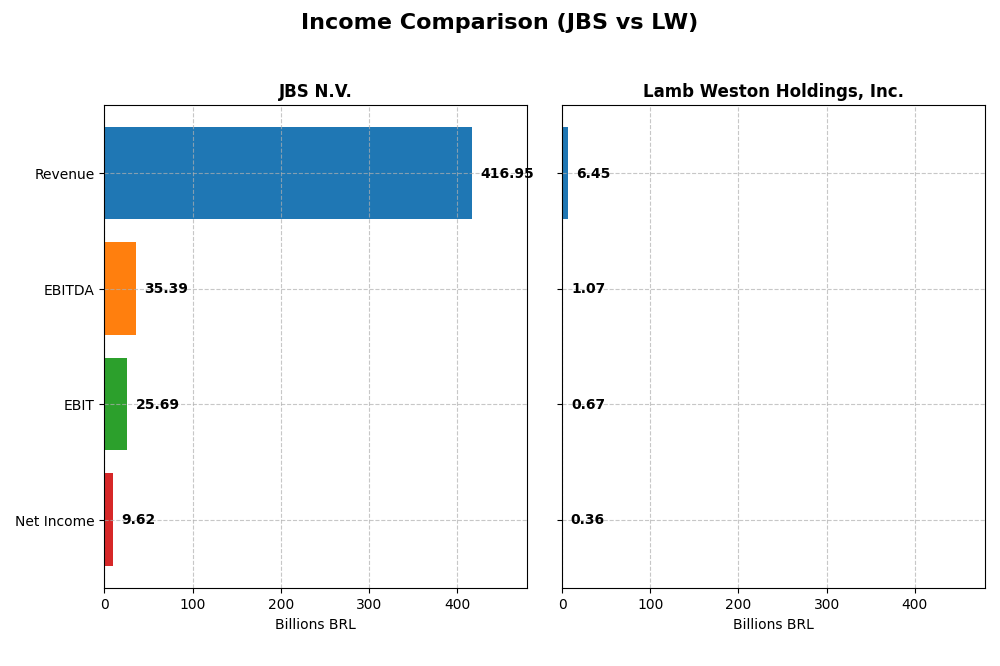
This table compares the most recent fiscal year income statement metrics for JBS N.V. and Lamb Weston Holdings, Inc., providing a clear view of their financial scale and profitability.
| Metric | JBS N.V. | Lamb Weston Holdings, Inc. |
|---|---|---|
| Market Cap | 31.7B BRL | 5.77B USD |
| Revenue | 417B BRL | 6.45B USD |
| EBITDA | 35.4B BRL | 1.07B USD |
| EBIT | 25.7B BRL | 665M USD |
| Net Income | 9.62B BRL | 357M USD |
| EPS | 30.55 BRL | 2.51 USD |
| Fiscal Year | 2024 | 2025 |
Income Statement Interpretations
JBS N.V.
JBS showed strong revenue growth of 14.61% in 2024, continuing a favorable trend with 54.31% growth over five years. Net income rebounded sharply from a loss in 2023 to a positive 9.6B BRL in 2024, supported by improved margins. Gross margin remained stable at 15.06%, while EBIT margin and net margin showed neutral but steady performance, reflecting operational resilience.
Lamb Weston Holdings, Inc.
Lamb Weston experienced a slight revenue decline of 0.25% in 2025 after steady growth since 2021. Net income dropped significantly by 50.64% in the latest year, with net margin falling to 5.54%. Despite favorable gross and EBIT margins above 10%, the recent contraction in profitability and margins signals some operational challenges despite solid long-term revenue growth of 75.74%.
Which one has the stronger fundamentals?
JBS displays stronger fundamentals with consistent revenue and net income growth, favorable margin stability, and a recovery from previous losses. Lamb Weston’s fundamentals are mixed, marked by solid margins but recent declines in profitability and revenue. The overall income statement evaluation rates JBS favorably, while Lamb Weston receives a neutral assessment due to recent unfavorable trends.
Financial Ratios Comparison
The table below presents a side-by-side comparison of key financial ratios for JBS N.V. and Lamb Weston Holdings, Inc., based on their most recent fiscal year data.
| Ratios | JBS N.V. (2024) | Lamb Weston Holdings, Inc. (2025) |
|---|---|---|
| ROE | 21.5% | 20.6% |
| ROIC | 8.6% | 7.4% |
| P/E | 3.2 | 22.2 |
| P/B | 0.69 | 4.56 |
| Current Ratio | 1.47 | 1.38 |
| Quick Ratio | 0.90 | 0.68 |
| D/E (Debt-to-Equity) | 3.01 | 2.39 |
| Debt-to-Assets | 53.6% | 56.2% |
| Interest Coverage | 2.33 | 3.70 |
| Asset Turnover | 1.65 | 0.87 |
| Fixed Asset Turnover | 4.85 | 1.68 |
| Payout Ratio | 46.1% | 57.9% |
| Dividend Yield | 14.4% | 2.61% |
Interpretation of the Ratios
JBS N.V.
JBS shows a solid return on equity at 21.47% and a favorable price-to-earnings ratio of 3.2, indicating attractive valuation. However, concerns arise from its high debt-to-equity ratio of 3.01 and a debt-to-assets ratio exceeding 53%, signaling elevated leverage risk. The dividend yield is substantial at 14.42%, supported by steady payouts, though the leverage may pose sustainability risks.
Lamb Weston Holdings, Inc.
Lamb Weston demonstrates a healthy return on equity of 20.56%, but its net margin and asset turnover ratios are only neutral, reflecting moderate profitability and efficiency. The company’s price-to-book ratio is high at 4.56, suggesting overvaluation, while leverage ratios remain unfavorable with a debt-to-equity of 2.39. Its dividend yield of 2.61% is modest but consistent, with no excessive payout concerns.
Which one has the best ratios?
JBS presents a more favorable overall ratio profile, balancing strong returns and valuation despite leverage concerns. Lamb Weston’s profitability and efficiency metrics are more moderate, coupled with higher valuation and leverage risks. Therefore, JBS holds a slightly more advantageous position based on the ratio evaluations provided.
Strategic Positioning
This section compares the strategic positioning of JBS and LW, focusing on market position, key segments, and exposure to disruption:
JBS
- Leading global protein and food company with diversified product range, facing competitive pressure in packaged foods.
- Diverse segments including beef, pork, poultry, plant-based products, leather, biodiesel, and logistics services.
- Exposure includes traditional meat and food processing, leather, biodiesel, and some industrial waste management.
LW
- Specialized producer of value-added frozen potato products, operating mainly in packaged foods with moderate pressure.
- Four segments: Global, Foodservice, Retail, and Other, driven by frozen potatoes and foodservice growth.
- Focused on frozen potato products and some vegetable and dairy businesses, with limited technological disruption.
JBS vs LW Positioning
JBS pursues a diversified strategy across proteins, food, and industrial products, offering broad market exposure but complexity. LW concentrates on frozen potato products and foodservice, presenting focused expertise but narrower diversification.
Which has the best competitive advantage?
Both companies create value with ROIC above WACC but face declining profitability. Their economic moats are slightly favorable, indicating moderate competitive advantages without clear superiority.
Stock Comparison
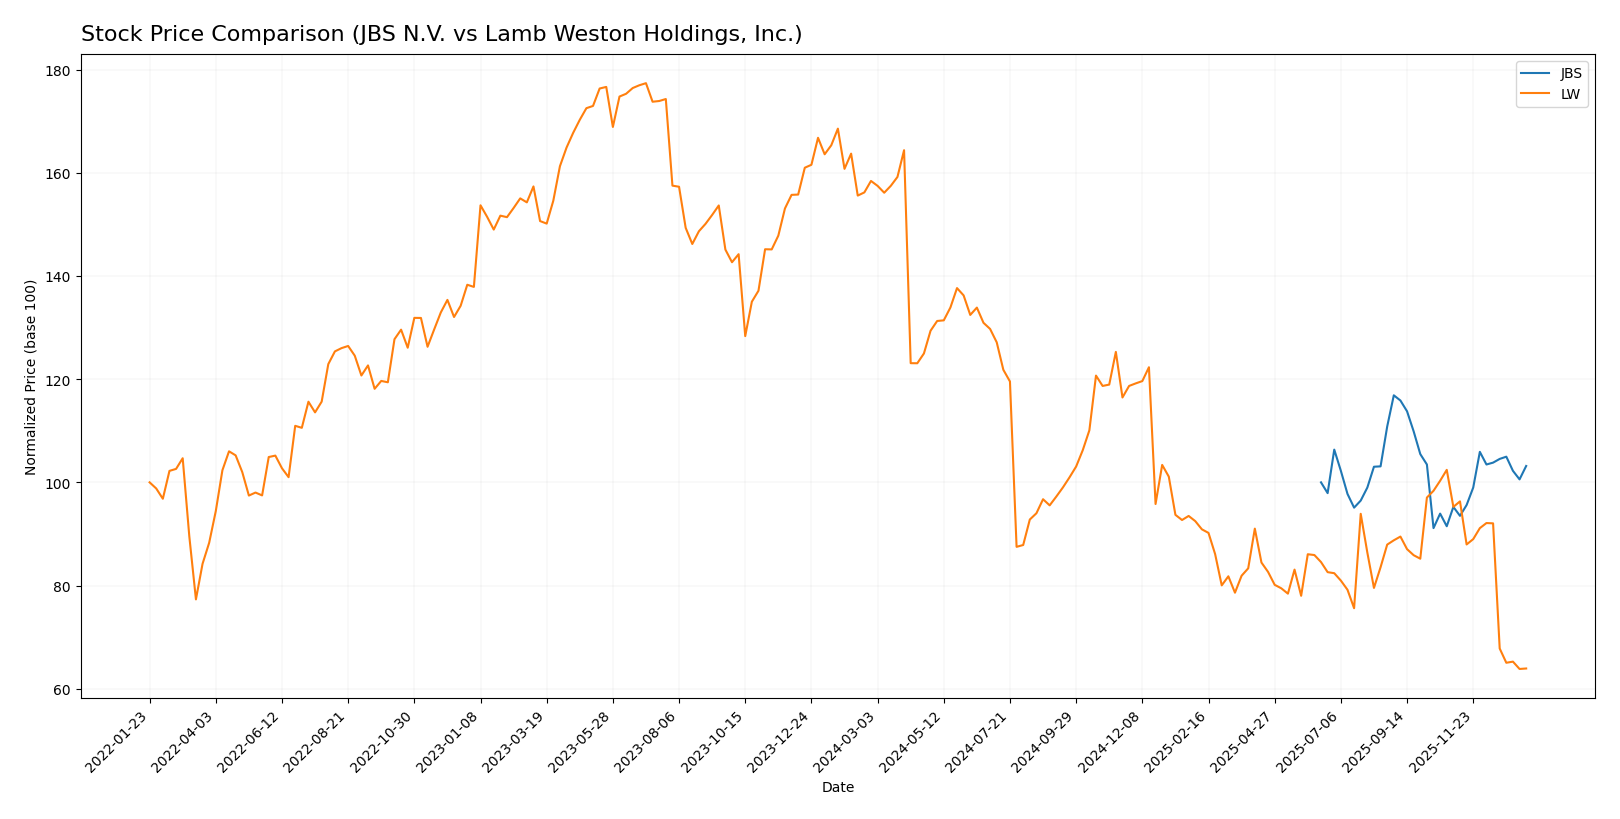
The stock price movements over the past year reveal contrasting dynamics, with JBS N.V. exhibiting a modest bullish trend marked by acceleration, while Lamb Weston Holdings, Inc. faces a pronounced bearish trend with deceleration and heightened volatility.
Trend Analysis
JBS N.V. showed a 3.17% price increase over the past 12 months, indicating a bullish trend with accelerating momentum and moderate volatility (0.9 std deviation). The stock ranged from 12.64 to 16.21 in price.
Lamb Weston Holdings, Inc. experienced a significant 59.65% decline in the same period, signaling a bearish trend with deceleration and high volatility (15.2 std deviation). Prices fluctuated between 41.37 and 106.53.
Comparing the two, JBS N.V. delivered the highest market performance with positive gains, whereas Lamb Weston Holdings, Inc. suffered steep losses throughout the period.
Target Prices
Analysts present a clear consensus on target prices for JBS N.V. and Lamb Weston Holdings, Inc.
| Company | Target High | Target Low | Consensus |
|---|---|---|---|
| JBS N.V. | 20 | 17 | 18.5 |
| Lamb Weston Holdings, Inc. | 68 | 46 | 52.67 |
The target consensus for JBS N.V. suggests an upside potential from the current price of $14.31 to around $18.5, indicating moderate growth expectations. Lamb Weston’s consensus target of $52.67 is significantly above its current price of $41.43, reflecting stronger bullish sentiment among analysts.
Analyst Opinions Comparison
This section compares analysts’ ratings and grades for JBS N.V. and Lamb Weston Holdings, Inc.:
Rating Comparison
JBS Rating
- Rating: A, categorized as Very Favorable.
- Discounted Cash Flow Score: 4, indicating a Favorable valuation based on future cash flows.
- ROE Score: 5, a Very Favorable indicator of profit generation efficiency from equity.
- ROA Score: 5, showing Very Favorable asset utilization to generate earnings.
- Debt To Equity Score: 1, marked as Very Unfavorable due to higher financial risk.
- Overall Score: 4, rated as Favorable reflecting strong financial standing.
LW Rating
- Rating: B, categorized as Very Favorable.
- Discounted Cash Flow Score: 4, also Favorable for undervaluation potential.
- ROE Score: 5, equally Very Favorable on shareholder equity profit efficiency.
- ROA Score: 4, Favorable but slightly below JBS’s efficiency in asset use.
- Debt To Equity Score: 1, similarly Very Unfavorable, indicating comparable financial risk levels.
- Overall Score: 3, Moderate, suggesting less favorable overall financial health compared to JBS.
Which one is the best rated?
Based on the provided data, JBS holds a superior overall rating (A vs. B) and scores higher on key financial metrics such as ROA and overall score. Both share identical debt risk concerns, but JBS’s stronger asset efficiency and overall assessment make it better rated.
Scores Comparison
Here is a comparison of the Altman Z-Score and Piotroski Score for JBS and LW:
JBS Scores
- Altman Z-Score: 10.7, indicating a safe zone with low bankruptcy risk.
- Piotroski Score: 8, classified as very strong financial health.
LW Scores
- Altman Z-Score: 2.75, in the grey zone indicating moderate bankruptcy risk.
- Piotroski Score: 9, classified as very strong financial health.
Which company has the best scores?
JBS has a significantly higher Altman Z-Score, placing it in the safe zone, while LW’s score is in the grey zone. LW has a marginally higher Piotroski Score, both very strong, reflecting slightly better financial strength.
Grades Comparison
Here is a comparison of the latest reliable grades assigned to JBS N.V. and Lamb Weston Holdings, Inc.:
JBS N.V. Grades
The following table summarizes recent grades from reputable grading companies for JBS N.V.:
| Grading Company | Action | New Grade | Date |
|---|---|---|---|
| JP Morgan | Maintain | Overweight | 2025-10-14 |
| JP Morgan | Maintain | Overweight | 2025-09-03 |
| Stephens & Co. | Maintain | Overweight | 2025-08-15 |
| Stephens & Co. | Maintain | Overweight | 2025-06-26 |
JBS N.V. consistently received “Overweight” ratings with maintained buy sentiment from leading firms.
Lamb Weston Holdings, Inc. Grades
Recent grades from established grading companies for Lamb Weston Holdings, Inc. are shown below:
| Grading Company | Action | New Grade | Date |
|---|---|---|---|
| Wells Fargo | Maintain | Overweight | 2025-12-23 |
| Barclays | Maintain | Overweight | 2025-12-23 |
| B of A Securities | Maintain | Neutral | 2025-12-22 |
| Stifel | Maintain | Hold | 2025-12-22 |
| Deutsche Bank | Maintain | Hold | 2025-12-22 |
| Wells Fargo | Maintain | Overweight | 2025-10-01 |
| B of A Securities | Maintain | Neutral | 2025-10-01 |
| Barclays | Maintain | Overweight | 2025-07-25 |
| Wells Fargo | Maintain | Overweight | 2025-07-24 |
| Wells Fargo | Maintain | Overweight | 2025-07-09 |
Lamb Weston displays a mix of ratings, predominantly “Overweight,” but also “Neutral” and “Hold,” suggesting varied analyst views.
Which company has the best grades?
JBS N.V. holds a clearer and more consistent “Overweight” grade trend compared to Lamb Weston’s mixed ratings, potentially indicating stronger analyst confidence for JBS. Investors might interpret JBS’s uniform positive grades as a sign of steadier optimism.
Strengths and Weaknesses
Below is a comparison table highlighting the key strengths and weaknesses of JBS N.V. and Lamb Weston Holdings, Inc. based on their recent financial and operational data:
| Criterion | JBS N.V. | Lamb Weston Holdings, Inc. |
|---|---|---|
| Diversification | Broad product portfolio in meat processing | Focused on frozen potato products with expanding global segments |
| Profitability | Moderate net margin (2.31%, unfavorable); strong ROE (21.47%, favorable) | Better net margin (5.54%, neutral); strong ROE (20.56%, favorable) |
| Innovation | Stable asset turnover and fixed asset efficiency | Moderate asset turnover; innovation in global expansion |
| Global presence | Strong global footprint, but profitability trend declining | Growing global segment revenue; expanding international presence |
| Market Share | Large market share in protein sector | Leading player in frozen potato market with steady segment growth |
Key takeaways: Both companies create value with ROIC above WACC but face declining profitability trends. JBS benefits from diversification and operational efficiency, while Lamb Weston has stronger margins and is expanding globally but shows weaker liquidity and higher debt risks. Investors should weigh stability versus growth and monitor profitability trends closely.
Risk Analysis
Below is a comparative table of key risks for JBS N.V. and Lamb Weston Holdings, Inc. based on the most recent data from 2024-2025:
| Metric | JBS N.V. | Lamb Weston Holdings, Inc. |
|---|---|---|
| Market Risk | Moderate (Beta 0.48) | Moderate (Beta 0.44) |
| Debt level | High (D/E 3.01, 54% debt/assets) | High (D/E 2.39, 56% debt/assets) |
| Regulatory Risk | Elevated (Global meat processing, environmental scrutiny) | Moderate (Food safety regulations) |
| Operational Risk | High (Complex global supply chain, large workforce) | Moderate (Focused frozen potato products) |
| Environmental Risk | High (Meat industry emissions, deforestation concerns) | Moderate (Agricultural sourcing impact) |
| Geopolitical Risk | Elevated (Exposure to multiple countries, trade tensions) | Moderate (Primarily US-based operations) |
JBS faces significant debt and environmental risks given its global meat processing scale and regulatory scrutiny. Lamb Weston has moderate debt concerns and operational risks but benefits from a narrower product focus and US-centric operations. Investors should weigh JBS’s high leverage and geopolitical exposure against Lamb Weston’s stable but less diversified profile.
Which Stock to Choose?
JBS N.V. shows favorable income growth with a 14.61% revenue increase in 2024 and strong profitability metrics, including a 21.47% ROE and a slightly favorable overall ratio evaluation, despite a high debt ratio and mixed liquidity. Its rating is very favorable, supported by strong Altman Z and Piotroski scores, indicating financial stability.
Lamb Weston Holdings, Inc. presents a neutral income statement evaluation with declining recent growth and a 5.54% net margin. It has moderate financial ratios with several unfavorable leverage and liquidity indicators, reflected in a slightly unfavorable global ratio opinion. Its rating is very favorable but with a grey zone Altman Z-score, suggesting moderate financial risk.
For investors prioritizing financial stability and robust income growth, JBS might appear more favorable given its stronger rating and income performance. Conversely, those with a tolerance for volatility and a focus on medium-term value creation might find Lamb Weston’s profile more aligned, considering its decent profitability despite recent setbacks.
Disclaimer: Investment carries a risk of loss of initial capital. The past performance is not a reliable indicator of future results. Be sure to understand risks before making an investment decision.
Go Further
I encourage you to read the complete analyses of JBS N.V. and Lamb Weston Holdings, Inc. to enhance your investment decisions: