Home > Comparison > Technology > WIT vs JKHY
The strategic rivalry between Wipro Limited and Jack Henry & Associates defines the current trajectory of the global technology services sector. Wipro, a capital-intensive, diversified IT services giant with a vast employee base, contrasts sharply with Jack Henry, a specialized, high-margin provider focused on financial technology solutions. This head-to-head reflects a broader battle between scale-driven diversification and niche market specialization. This analysis will determine which corporate model offers superior risk-adjusted returns for a diversified portfolio.

Table of contents
Companies Overview
Wipro Limited and Jack Henry & Associates, Inc. are pivotal players in the global IT services sector, shaping distinct market niches.
Wipro Limited: Global IT Services Powerhouse
Wipro Limited stands as a leader in IT, consulting, and business process services worldwide. Its revenue flows predominantly from IT Services, including cloud, analytics, and digital strategy advisory. In 2026, Wipro’s strategic focus lies in expanding its India State Run Enterprise Services alongside reinforcing its broad industry reach across healthcare, banking, and manufacturing.
Jack Henry & Associates, Inc.: Specialized Financial Tech Provider
Jack Henry & Associates excels as a technology solutions provider for U.S. financial institutions. It monetizes through core data processing, payments, and complementary products for banks and credit unions. Its 2026 strategy centers on enhancing integrated applications and digital payment solutions, emphasizing scalability for community to multi-billion-dollar banks under distinct brands like Jack Henry Banking and Symitar.
Strategic Collision: Similarities & Divergences
Both firms deliver technology services but diverge sharply in scope and client focus. Wipro pursues a broad global IT services model, while Jack Henry commits to a narrow, specialized financial technology ecosystem in the U.S. Their primary battleground is digital innovation, yet Wipro competes on scale and diversity whereas Jack Henry leverages niche expertise. This shapes distinct investment profiles: Wipro offers diversified exposure, Jack Henry targets specialized financial tech growth.
Income Statement Comparison
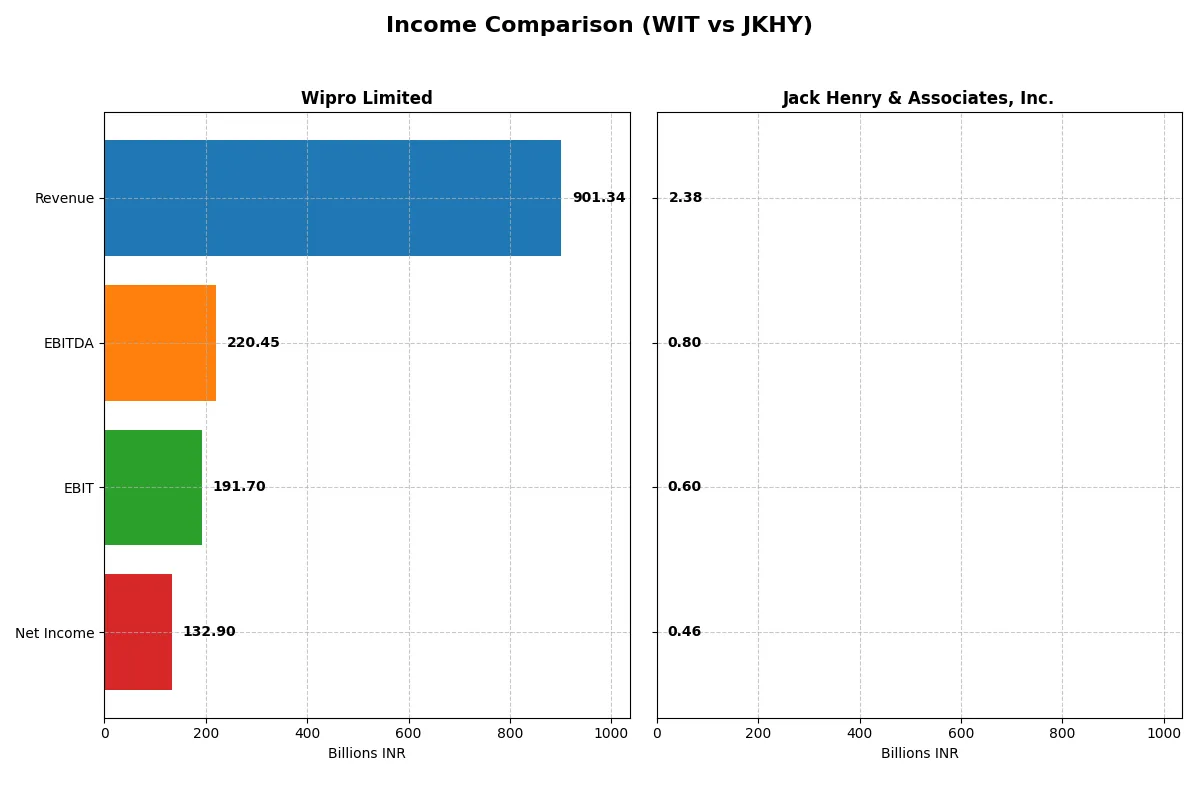
The following data dissects the core profitability and scalability of both corporate engines to reveal who dominates the bottom line:
| Metric | Wipro Limited (WIT) | Jack Henry & Associates, Inc. (JKHY) |
|---|---|---|
| Revenue | 901.3B INR | 2.38B USD |
| Cost of Revenue | 625.1B INR | 1.36B USD |
| Operating Expenses | 122.7B INR | 446M USD |
| Gross Profit | 276.3B INR | 1.01B USD |
| EBITDA | 220.5B INR | 801M USD |
| EBIT | 191.7B INR | 596M USD |
| Interest Expense | 14.9B INR | 10.4M USD |
| Net Income | 132.9B INR | 456M USD |
| EPS | 12.56 INR | 6.24 USD |
| Fiscal Year | 2025 | 2025 |
Income Statement Analysis: The Bottom-Line Duel
This income statement comparison reveals which company converts revenue into profit with superior efficiency and momentum.
Wipro Limited Analysis
Wipro’s revenue slightly declined by 0.24% to 901B INR in FY 2025, yet net income rose 19.6% to 133B INR. Gross margin improved to a healthy 30.65%, and net margin expanded to 14.74%, reflecting better cost control. Operating income surged 19%, signaling enhanced efficiency despite flat top-line growth.
Jack Henry & Associates, Inc. Analysis
Jack Henry’s revenue grew 7.2% to $2.38B in FY 2025, with net income increasing 19.4% to $456M. The company maintains a robust gross margin of 42.7% and a net margin of 19.2%, outperforming Wipro in profitability. EBIT margin rose to 25.1%, showing strong operating leverage and consistent margin expansion.
Margin Strength vs. Growth Trajectory
Jack Henry commands higher margins and stronger net income growth, outpacing Wipro in profitability and efficiency. Wipro shows resilience with improved margins amid revenue stagnation but lags behind Jack Henry’s scale and margin expansion. For investors, Jack Henry’s profile offers superior margin power and growth momentum.
Financial Ratios Comparison
These vital ratios act as a diagnostic tool to expose the underlying fiscal health, valuation premiums, and capital efficiency of the companies compared below:
| Ratios | Wipro Limited (WIT) | Jack Henry & Associates, Inc. (JKHY) |
|---|---|---|
| ROE | 16.0% | 21.4% |
| ROIC | 10.5% | 17.6% |
| P/E | 20.6 | 28.9 |
| P/B | 3.3 | 6.2 |
| Current Ratio | 2.72 | 1.27 |
| Quick Ratio | 2.71 | 1.27 |
| D/E | 0.23 | 0.00 |
| Debt-to-Assets | 14.9% | 0.0% |
| Interest Coverage | 10.3 | 54.5 |
| Asset Turnover | 0.70 | 0.78 |
| Fixed Asset Turnover | 8.48 | 10.75 |
| Payout Ratio | 47.2% | 36.1% |
| Dividend Yield | 2.29% | 1.25% |
| Fiscal Year | 2025 | 2025 |
Efficiency & Valuation Duel: The Vital Signs
Financial ratios act as a company’s DNA, exposing hidden risks and operational excellence that shape investor confidence and portfolio decisions.
Wipro Limited
Wipro posts a solid ROE of 16.04% and a net margin near 15%, reflecting steady profitability. Its P/E of 20.6 suggests a fairly valued stock, though its P/B of 3.3 is less attractive. The company balances growth and returns with a 2.29% dividend yield, signaling reliable shareholder income alongside reinvestment into operations.
Jack Henry & Associates, Inc.
Jack Henry commands a higher ROE at 21.39% and a strong net margin of 19.19%, showcasing operational efficiency. However, its P/E of 28.88 flags an expensive valuation. With no debt and robust interest coverage, it sustains operational safety. Dividend yield sits modestly at 1.25%, reflecting a cautious shareholder payout approach.
Premium Valuation vs. Operational Safety
Wipro offers a very favorable overall ratio profile with balanced valuation and consistent dividends. Jack Henry delivers superior profitability but at a stretched valuation with lower yield. Wipro suits investors valuing steady income and risk control; Jack Henry fits those chasing growth with tolerance for premium pricing.
Which one offers the Superior Shareholder Reward?
I contrast Wipro Limited (WIT) and Jack Henry & Associates, Inc. (JKHY) on dividends and buybacks. WIT yields 2.3%, with a 47% payout ratio, supported by strong FCF coverage (2.18x). JKHY delivers 1.25% yield, a 36% payout, and robust FCF coverage (2.94x). WIT’s buybacks appear modest, while JKHY’s active repurchase program significantly boosts total returns. WIT retains a higher current ratio (2.7 vs. 1.27), indicating better liquidity. Historically, JKHY’s disciplined capital allocation and buybacks drive superior shareholder value, despite a lower yield. I find JKHY’s balanced distribution and aggressive buybacks offer a more attractive total return profile in 2026.
Comparative Score Analysis: The Strategic Profile
The radar chart reveals the fundamental DNA and trade-offs of Wipro Limited and Jack Henry & Associates, Inc., highlighting their strategic strengths and balance:
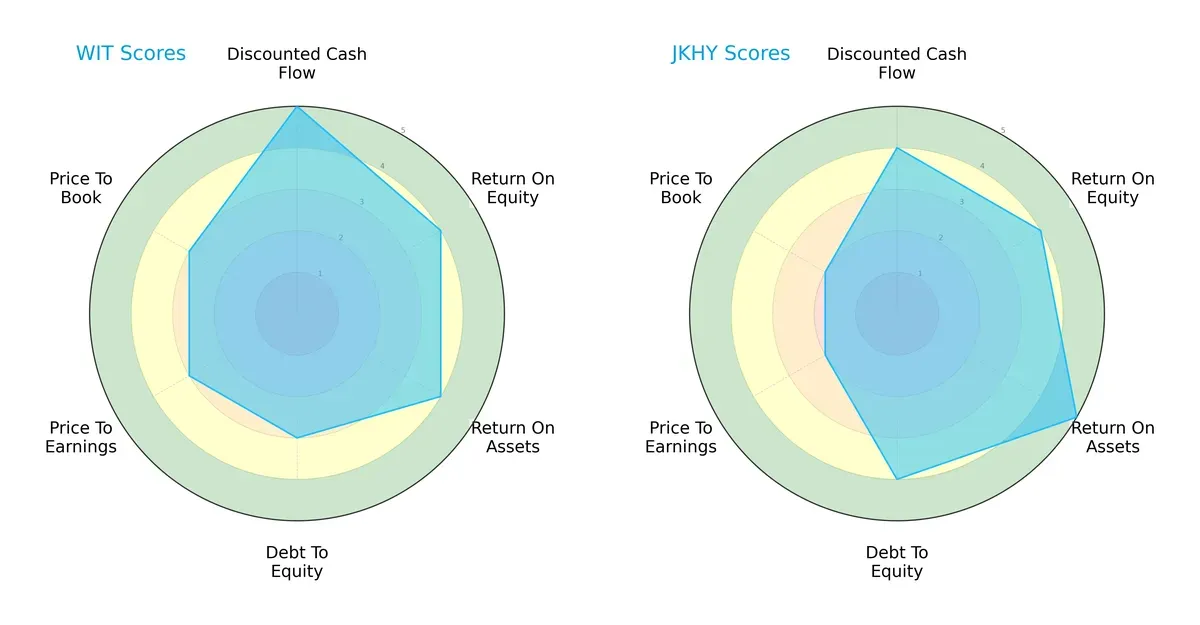
Wipro excels in discounted cash flow (5 vs. 4), showing strong valuation metrics, while Jack Henry leads in return on assets (5 vs. 4) and debt-to-equity (4 vs. 3), indicating more efficient asset use and stronger balance sheet. Both tie on return on equity (4) and overall score (4). Wipro’s profile leans on valuation strength; Jack Henry presents a more balanced operational and financial risk profile.
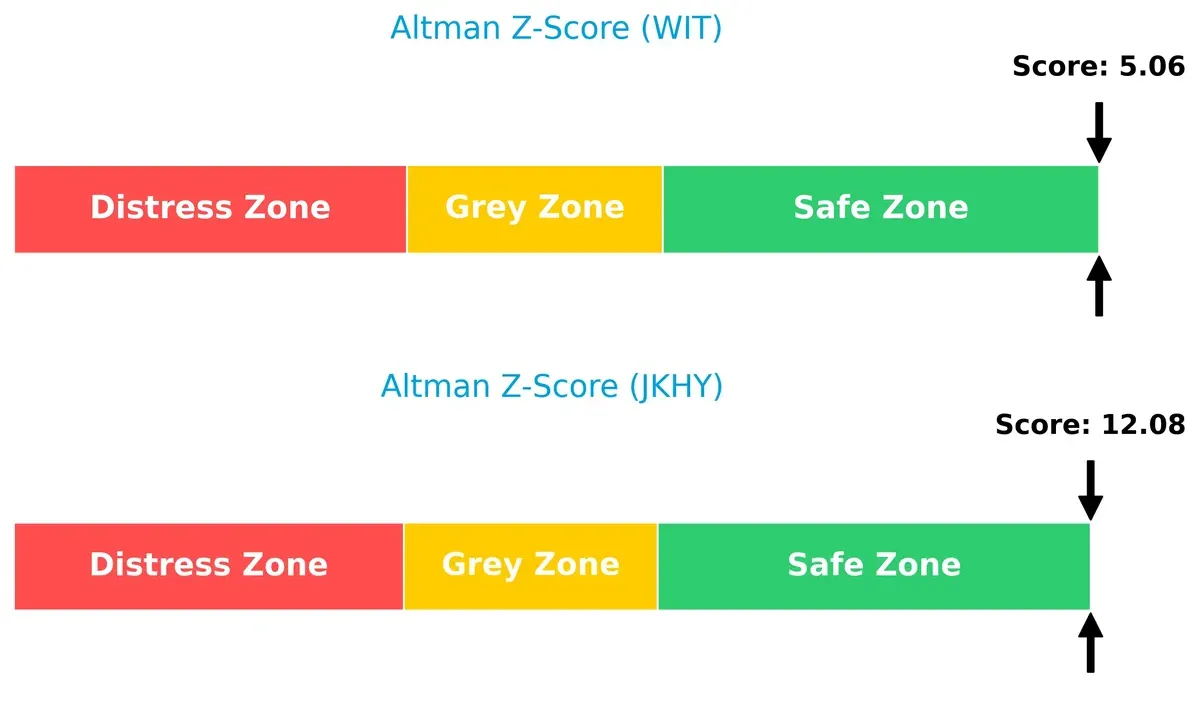
Bankruptcy Risk: Solvency Showdown
Jack Henry’s Altman Z-Score of 12.08 vastly outpaces Wipro’s 5.06, both securely in the safe zone, signaling superior long-term solvency and lower bankruptcy risk for Jack Henry in the current cycle:
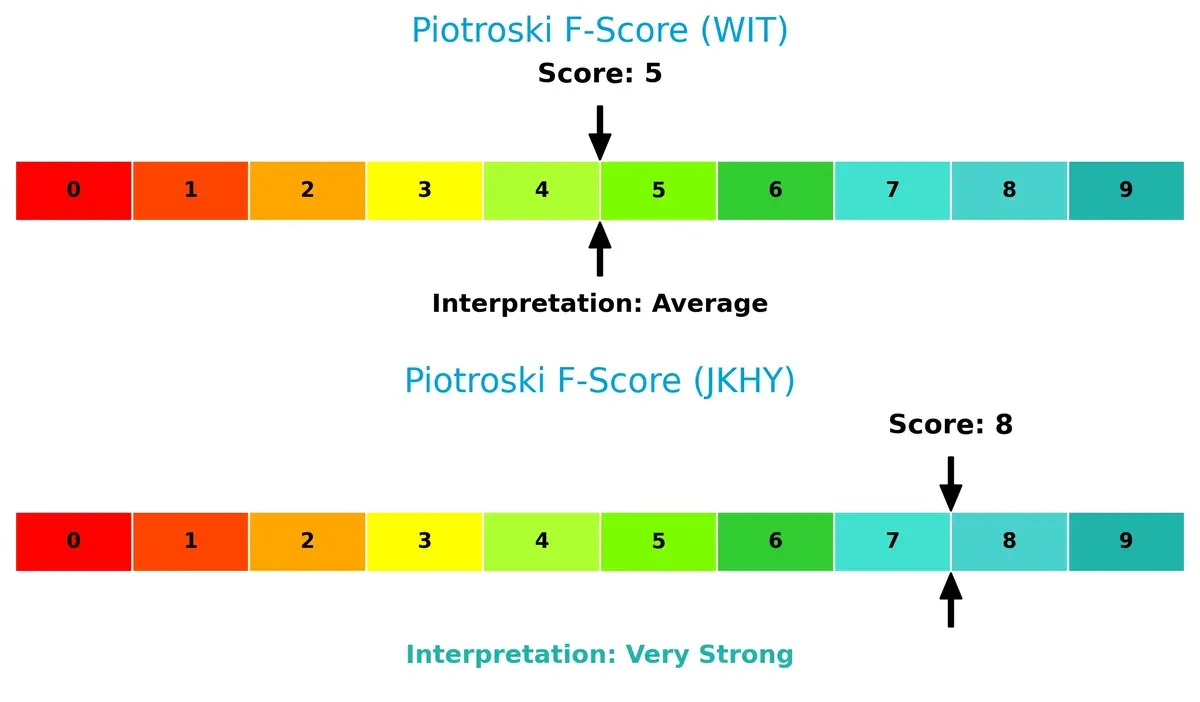
Financial Health: Quality of Operations
Jack Henry scores 8 on the Piotroski F-Score, demonstrating very strong financial health supported by robust internal operations. Wipro’s score of 5 indicates average health, suggesting potential red flags in operational efficiency or profitability compared to Jack Henry:
How are the two companies positioned?
This section dissects the operational DNA of Wipro and Jack Henry by comparing their revenue distribution and internal strengths and weaknesses. The goal is to confront their economic moats to identify the most resilient and sustainable competitive advantage today.
Revenue Segmentation: The Strategic Mix
This visual comparison dissects how both firms diversify their income streams and where their primary sector bets lie:
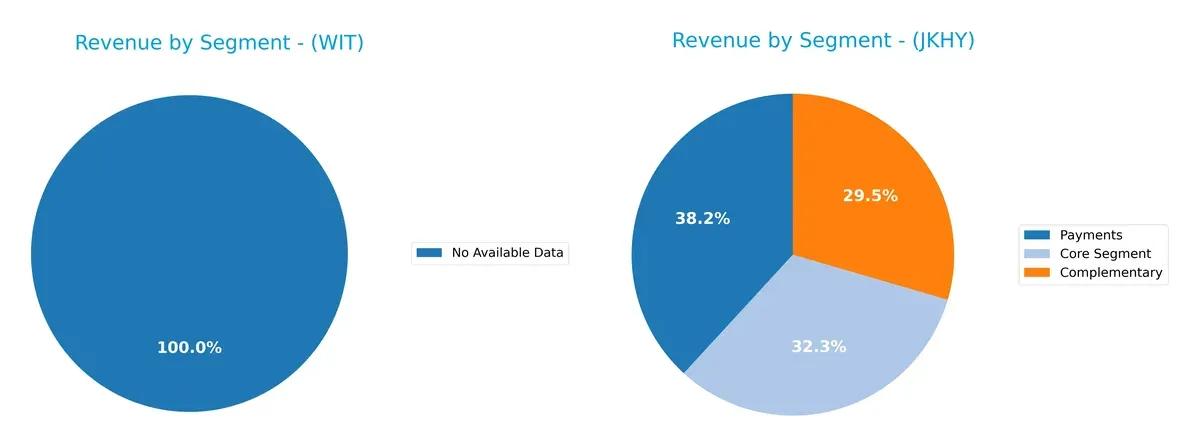
Wipro Limited lacks available segment data, so I cannot analyze its revenue mix. Jack Henry & Associates, however, shows a balanced portfolio in 2025: Payments lead with $873M, followed by Core Segment at $739M and Complementary at $675M. This diversified mix reduces concentration risk and anchors Jack Henry’s ecosystem lock-in, contrasting with companies relying heavily on a single dominant segment.
Strengths and Weaknesses Comparison
This table compares the Strengths and Weaknesses of Wipro Limited and Jack Henry & Associates, Inc.:
Wipro Limited Strengths
- Favorable profitability ratios including net margin 14.74% and ROE 16.04%
- Strong liquidity with current and quick ratios above 2.7
- Low debt levels with debt-to-assets below 15% and strong interest coverage
Jack Henry & Associates Strengths
- Higher profitability metrics with net margin 19.19% and ROE 21.39%
- Zero debt and excellent interest coverage of 57.14
- Diversified revenue streams across Complementary, Core, and Payments segments
Wipro Limited Weaknesses
- Unfavorable price-to-book ratio at 3.3 indicating potential overvaluation
- Neutral asset turnover at 0.7 suggests moderate operational efficiency
Jack Henry & Associates Weaknesses
- Unfavorable valuation metrics with PE 28.88 and PB 6.18 indicating high price multiples
- Current ratio at 1.27 signals lower short-term liquidity compared to peers
Both companies exhibit strong profitability and prudent debt management, but Jack Henry’s higher valuation multiples and lower liquidity pose caution. Wipro shows solid liquidity and valuation stability but lower operational efficiency by asset turnover. These factors shape their strategic financial positioning.
The Moat Duel: Analyzing Competitive Defensibility
A structural moat is the only reliable shield protecting long-term profits from relentless competitive pressure. Let’s dissect how each company defends its turf:
Wipro Limited: Scale and Cost Advantage in IT Services
Wipro leverages a vast global workforce and cost-efficient delivery to maintain stable margins and a solid 4.1% ROIC premium over WACC. However, its declining ROIC trend signals rising margin pressure in 2026.
Jack Henry & Associates, Inc.: Niche Focus and Switching Costs in Financial Tech
Jack Henry’s moat stems from deep integration and high switching costs within U.S. financial institutions. With a 10.5% ROIC premium and rising profitability, it strengthens its grip through digital payment innovations in 2026.
Verdict: Cost Leadership vs. Sticky Customer Relationships
Jack Henry’s growing and wider moat, backed by superior ROIC and margin expansion, outmatches Wipro’s scale-based cost advantage with shrinking returns. Jack Henry is better positioned to defend and expand its market share.
Which stock offers better returns?
Over the past year, Wipro Limited’s shares declined steadily, while Jack Henry & Associates, Inc. showed moderate gains with accelerating momentum and higher volatility.
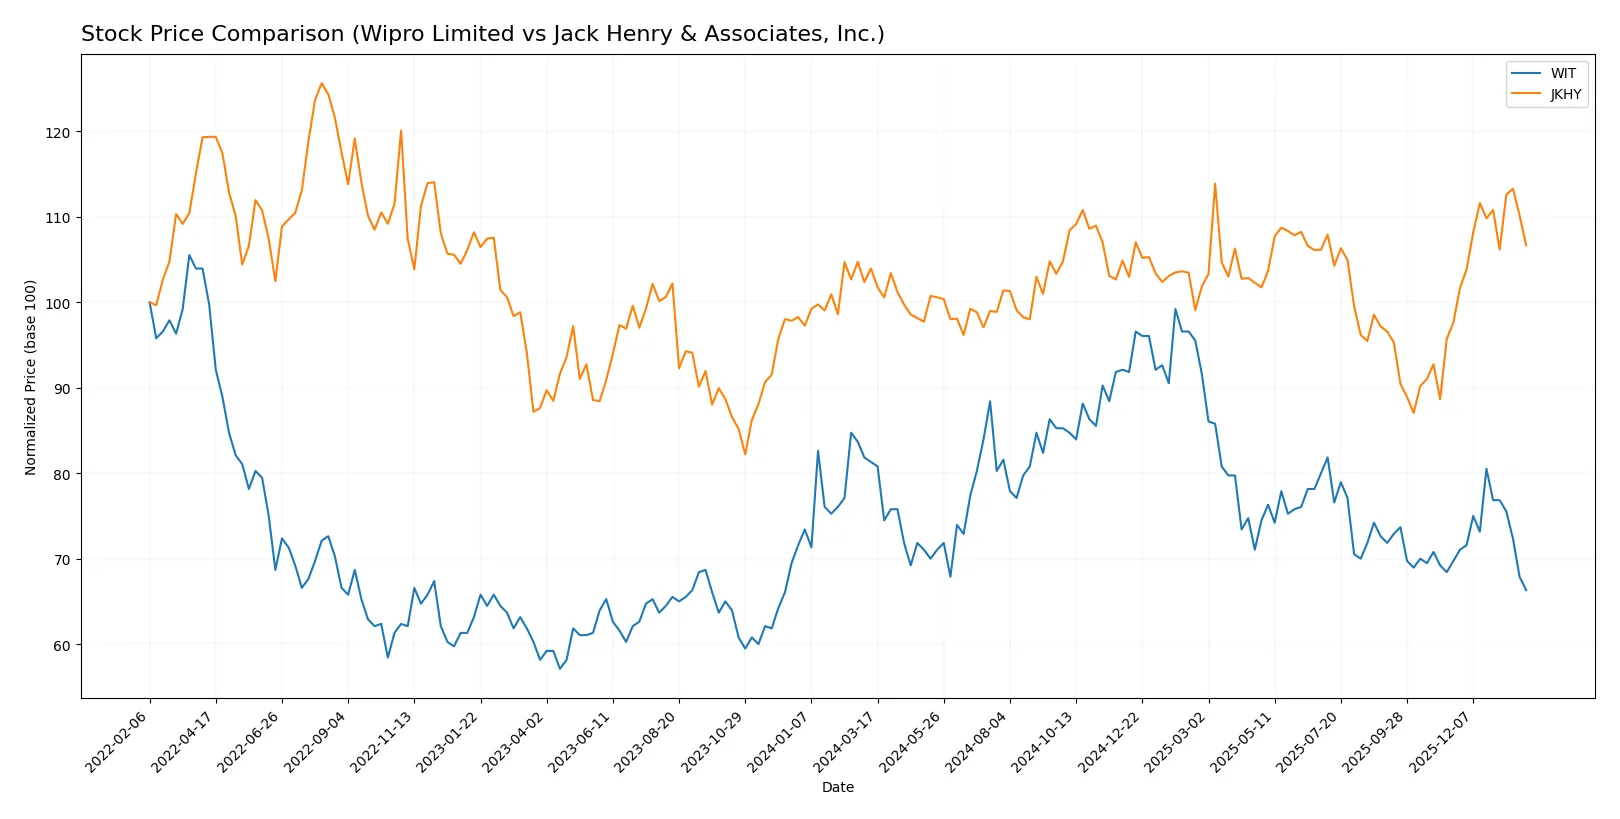
Trend Comparison
Wipro Limited’s stock fell 18.45% over the past 12 months, reflecting a bearish trend with decelerating losses and a low volatility of 0.31. The price ranged between 3.77 and 2.52.
Jack Henry & Associates, Inc. recorded a 2.61% gain over the same period, indicating a bullish trend with accelerating momentum and significant volatility at 9.21. Prices fluctuated from 146.26 to 191.28.
Jack Henry & Associates outperformed Wipro Limited, delivering positive returns and stronger price acceleration compared to Wipro’s sustained decline.
Target Prices
Analysts present a clear bullish consensus for Wipro Limited and Jack Henry & Associates, Inc.
| Company | Target Low | Target High | Consensus |
|---|---|---|---|
| Wipro Limited | 7.0 | 7.7 | 7.35 |
| Jack Henry & Associates, Inc. | 181 | 220 | 203.14 |
The target consensus for Wipro at 7.35 vastly exceeds its current price near 2.52, signaling strong upside potential. Jack Henry’s consensus target of 203.14 also sits well above its current 179.21, reflecting solid growth expectations from analysts.

Don’t Let Luck Decide Your Entry Point
Optimize your entry points with our advanced ProRealTime indicators. You’ll get efficient buy signals with precise price targets for maximum performance. Start outperforming now!
How do institutions grade them?
Wipro Limited Grades
The following table summarizes recent grades from major financial institutions for Wipro Limited.
| Grading Company | Action | New Grade | Date |
|---|---|---|---|
| UBS | Upgrade | Neutral | 2025-01-02 |
| Wedbush | Maintain | Underperform | 2024-01-16 |
| JP Morgan | Maintain | Underweight | 2023-05-24 |
| Bernstein | Downgrade | Underperform | 2023-03-22 |
| Bernstein | Downgrade | Underperform | 2023-03-21 |
| Goldman Sachs | Upgrade | Buy | 2022-09-13 |
| Goldman Sachs | Upgrade | Buy | 2022-09-12 |
| Morgan Stanley | Downgrade | Underweight | 2022-07-14 |
| Morgan Stanley | Downgrade | Underweight | 2022-07-13 |
| Macquarie | Upgrade | Outperform | 2022-06-02 |
Jack Henry & Associates, Inc. Grades
Below is a summary of recent institutional grades for Jack Henry & Associates, Inc.
| Grading Company | Action | New Grade | Date |
|---|---|---|---|
| Wells Fargo | Maintain | Equal Weight | 2026-01-30 |
| DA Davidson | Maintain | Buy | 2026-01-29 |
| DA Davidson | Maintain | Buy | 2026-01-28 |
| Wolfe Research | Upgrade | Outperform | 2026-01-08 |
| UBS | Maintain | Neutral | 2026-01-08 |
| RBC Capital | Upgrade | Outperform | 2025-12-16 |
| Baird | Maintain | Neutral | 2025-12-15 |
| Keefe, Bruyette & Woods | Upgrade | Outperform | 2025-12-08 |
| Goldman Sachs | Maintain | Neutral | 2025-11-07 |
| Compass Point | Upgrade | Buy | 2025-11-06 |
Which company has the best grades?
Jack Henry & Associates holds generally stronger grades with multiple Outperform and Buy ratings in 2025-2026. Wipro Limited shows mixed signals, with upgrades offset by several downgrades and Underperform ratings. Investors may see Jack Henry as favored by analysts currently, potentially signaling greater confidence.
Risks specific to each company
The following categories identify the critical pressure points and systemic threats facing both firms in the 2026 market environment:
1. Market & Competition
Wipro Limited
- Faces intense global IT services competition with pressure on pricing and margins in India and emerging markets.
Jack Henry & Associates, Inc.
- Operates in a niche US financial technology market but faces rising competition from fintech disruptors and evolving client demands.
2. Capital Structure & Debt
Wipro Limited
- Maintains modest leverage (D/E 0.23) with favorable interest coverage, reflecting prudent capital structure.
Jack Henry & Associates, Inc.
- Zero debt, very strong interest coverage, reflecting a conservative and low-risk financial profile.
3. Stock Volatility
Wipro Limited
- Low beta (0.555) signals defensive trading behavior and lower sensitivity to market swings.
Jack Henry & Associates, Inc.
- Moderate beta (0.71) indicates somewhat higher stock volatility but still below market average.
4. Regulatory & Legal
Wipro Limited
- Exposure to regulatory risks in India, including government contracts and data privacy laws.
Jack Henry & Associates, Inc.
- Regulatory compliance complexity in US financial services sector, including payment processing and data security.
5. Supply Chain & Operations
Wipro Limited
- Global delivery model subject to geopolitical and operational disruptions, especially in India.
Jack Henry & Associates, Inc.
- Primarily US-focused operations reduce global supply chain risks but increase dependency on domestic market stability.
6. ESG & Climate Transition
Wipro Limited
- Increasing pressure to meet ESG standards amid rising global scrutiny on Indian IT sector sustainability.
Jack Henry & Associates, Inc.
- Faces growing ESG demands in financial services technology, particularly data privacy and environmental impact.
7. Geopolitical Exposure
Wipro Limited
- High exposure to India’s geopolitical environment and global trade tensions affecting IT outsourcing.
Jack Henry & Associates, Inc.
- Limited geopolitical risk due to US-centric operations and diversified financial services client base.
Which company shows a better risk-adjusted profile?
Wipro’s main risk lies in geopolitical and operational exposure across emerging markets. Jack Henry’s key risk is competitive pressure from fintech innovation in a mature US market. Jack Henry’s zero debt and very strong Piotroski score underpin a stronger risk-adjusted profile. Wipro’s broad scale and favorable capital structure mitigate risks but market volatility and ESG pressures warrant caution. Recent data confirms Jack Henry’s superior financial resilience and operational focus.
Final Verdict: Which stock to choose?
Wipro Limited’s superpower lies in its robust capital efficiency and strong liquidity, reflecting disciplined cash management. However, its slightly declining ROIC trend is a point of vigilance for value-focused investors. It suits portfolios seeking steady, quality growth with moderate risk tolerance.
Jack Henry & Associates commands a durable moat through its niche software solutions and recurring revenue model. Its rising ROIC trend and superior profitability metrics offer better stability compared to Wipro. It aligns well with GARP investors aiming for growth balanced with financial strength.
If you prioritize resilient cash flow and operational efficiency, Wipro presents a compelling scenario due to its conservative balance sheet and attractive dividend yield. However, if you seek durable competitive advantages and accelerating profitability, Jack Henry outshines with a stronger moat and growth momentum, though at a premium valuation.
Disclaimer: Investment carries a risk of loss of initial capital. The past performance is not a reliable indicator of future results. Be sure to understand risks before making an investment decision.
Go Further
I encourage you to read the complete analyses of Wipro Limited and Jack Henry & Associates, Inc. to enhance your investment decisions: