Leidos Holdings, Inc. (LDOS) and Jack Henry & Associates, Inc. (JKHY) are key players in the Information Technology Services sector, each specializing in distinct yet overlapping markets. Leidos focuses on defense, civil, and health solutions with a strong emphasis on national security and government contracts, while Jack Henry excels in technology and payment processing services tailored for financial institutions. This article will analyze both companies to help you identify which presents the most compelling investment opportunity in 2026.

Table of contents
Companies Overview
I will begin the comparison between Leidos Holdings, Inc. and Jack Henry & Associates, Inc. by providing an overview of these two companies and their main differences.
Leidos Holdings, Inc. Overview
Leidos Holdings, Inc. operates in the information technology services sector, focusing on defense, intelligence, civil, and health markets. Its mission centers on providing advanced technology solutions and systems for national security and government agencies in the U.S. and internationally. The company delivers services including cybersecurity, data analytics, and health information management, positioning itself as a key player in government-related IT services.
Jack Henry & Associates, Inc. Overview
Jack Henry & Associates, Inc. also operates in the information technology services industry but targets primarily financial services organizations in the U.S. The company offers technology solutions and payment processing through four segments, including core data processing for banks and credit unions. Its focus lies in integrated financial software, risk management, and electronic payment solutions, serving a broad range of financial institutions.
Key similarities and differences
Both companies operate within the technology services sector but serve distinct markets—Leidos targets government and health sectors, while Jack Henry focuses on financial services. Each provides specialized IT solutions, with Leidos emphasizing national security and health-related technologies, and Jack Henry concentrating on banking and payment processing systems. Their business models differ in client base and service scope, reflecting varied strategic priorities within the tech services industry.
Income Statement Comparison
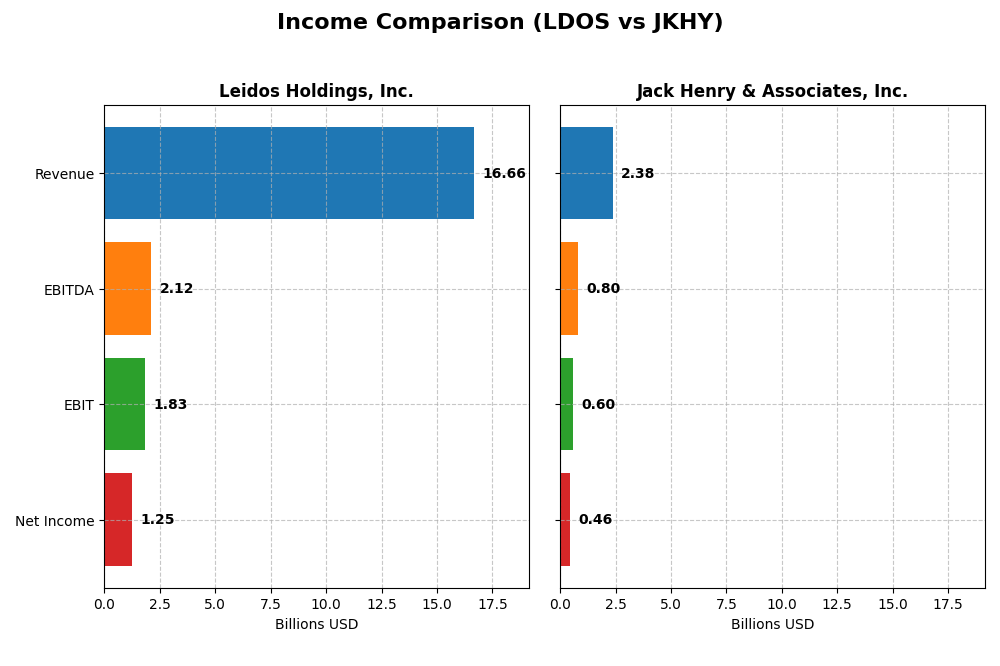
This table presents a side-by-side comparison of the latest fiscal year income statement metrics for Leidos Holdings, Inc. and Jack Henry & Associates, Inc.
| Metric | Leidos Holdings, Inc. | Jack Henry & Associates, Inc. |
|---|---|---|
| Market Cap | 24.4B | 14B |
| Revenue | 16.7B (2024) | 2.38B (2025) |
| EBITDA | 2.12B | 801M |
| EBIT | 1.83B | 596M |
| Net Income | 1.25B | 456M |
| EPS | 9.36 | 6.24 |
| Fiscal Year | 2024 | 2025 |
Income Statement Interpretations
Leidos Holdings, Inc.
Leidos Holdings experienced steady revenue growth from 12.3B in 2020 to 16.7B in 2024, nearly a 35.5% increase. Net income surged significantly, from 628M in 2020 to 1.25B in 2024, almost doubling. Margins improved notably, with net margin rising to 7.53% in 2024. The latest year showed strong profitability acceleration, with EBIT margin at 11% and EPS growth exceeding 500%.
Jack Henry & Associates, Inc.
Jack Henry & Associates grew revenue from 1.76B in 2021 to 2.38B in 2025, a 35.1% increase. Net income climbed from 311M to 456M in the same period, with net margin at 19.19% in 2025. Gross and EBIT margins remained robust and improving. The most recent year reflected steady growth in revenue and net income, with EPS growth near 20% and favorable operating expense control relative to revenue.
Which one has the stronger fundamentals?
Both companies show favorable income statement trends with solid revenue and net income growth over their respective periods. Leidos demonstrates higher absolute scale and exceptional recent margin expansion, while Jack Henry boasts stronger margin levels, particularly net margin above 19%. Jack Henry’s greater margin stability contrasts with Leidos’ faster bottom-line growth. Each presents distinct strengths in profitability and growth metrics.
Financial Ratios Comparison
The table below compares key financial ratios for Leidos Holdings, Inc. (LDOS) and Jack Henry & Associates, Inc. (JKHY) based on the most recent fiscal year data available, providing a clear view of their performance metrics.
| Ratios | Leidos Holdings, Inc. (2024) | Jack Henry & Associates, Inc. (2025) |
|---|---|---|
| ROE | 28.4% | 21.4% |
| ROIC | 13.9% | 17.6% |
| P/E | 15.7 | 28.9 |
| P/B | 4.47 | 6.18 |
| Current Ratio | 1.21 | 1.27 |
| Quick Ratio | 1.13 | 1.27 |
| D/E | 1.20 | 0 |
| Debt-to-Assets | 40.4% | 0 |
| Interest Coverage | 9.47 | 54.5 |
| Asset Turnover | 1.27 | 0.78 |
| Fixed Asset Turnover | 10.74 | 10.75 |
| Payout Ratio | 16.6% | 36.1% |
| Dividend Yield | 1.05% | 1.25% |
Interpretation of the Ratios
Leidos Holdings, Inc.
Leidos Holdings shows a generally solid ratio profile with favorable returns on equity (28.42%) and invested capital (13.85%), supported by a reasonable weighted average cost of capital (5.87%). However, concerns arise from its relatively high price-to-book ratio (4.47) and debt-to-equity ratio (1.2), which are unfavorable. The company offers a dividend yield of 1.05%, reflecting a moderate payout with neutral market valuation metrics.
Jack Henry & Associates, Inc.
Jack Henry & Associates exhibits strong profitability with a favorable net margin of 19.19%, return on equity at 21.39%, and return on invested capital of 17.63%. The company maintains a debt-free balance sheet and excellent interest coverage (57.14), which are positive signs. Despite an elevated price-to-earnings ratio (28.88) and price-to-book ratio (6.18), it offers a dividend yield of 1.25%, indicating stable shareholder returns.
Which one has the best ratios?
Jack Henry & Associates holds a more favorable overall ratio profile with 64.29% of metrics rated favorable, especially excelling in profitability and capital structure with no debt. Leidos Holdings, while slightly favorable, shows mixed signals with higher leverage and valuation concerns. Both companies maintain dividend payments, but Jack Henry’s stronger fundamentals suggest a more robust financial position.
Strategic Positioning
This section compares the strategic positioning of Leidos Holdings, Inc. and Jack Henry & Associates, Inc. across market position, key segments, and exposure to technological disruption:
Leidos Holdings, Inc.
- Large market cap of 24.4B; operates under moderate competitive pressure in IT services.
- Key segments: Defense Solutions, Civil, Health; driven by national security and government contracts.
- Exposure includes cybersecurity and cloud computing in national security and IT modernization.
Jack Henry & Associates, Inc.
- Market cap of 14B; focused competitive environment in financial tech services.
- Key segments: Core, Payments, Complementary; driven by banking and financial institutions.
- Exposure centers on digital payments, security, and risk management for financial sector.
Leidos Holdings, Inc. vs Jack Henry & Associates, Inc. Positioning
Leidos exhibits a diversified strategy across defense, civil, and health markets, leveraging government and commercial contracts. Jack Henry is more concentrated in financial technology, focusing on banking and payment solutions. Diversification may mitigate risks but also requires managing multiple sectors.
Which has the best competitive advantage?
Both companies demonstrate a very favorable economic moat with growing ROIC above WACC, indicating durable competitive advantages and efficient capital use based on their respective market focuses.
Stock Comparison
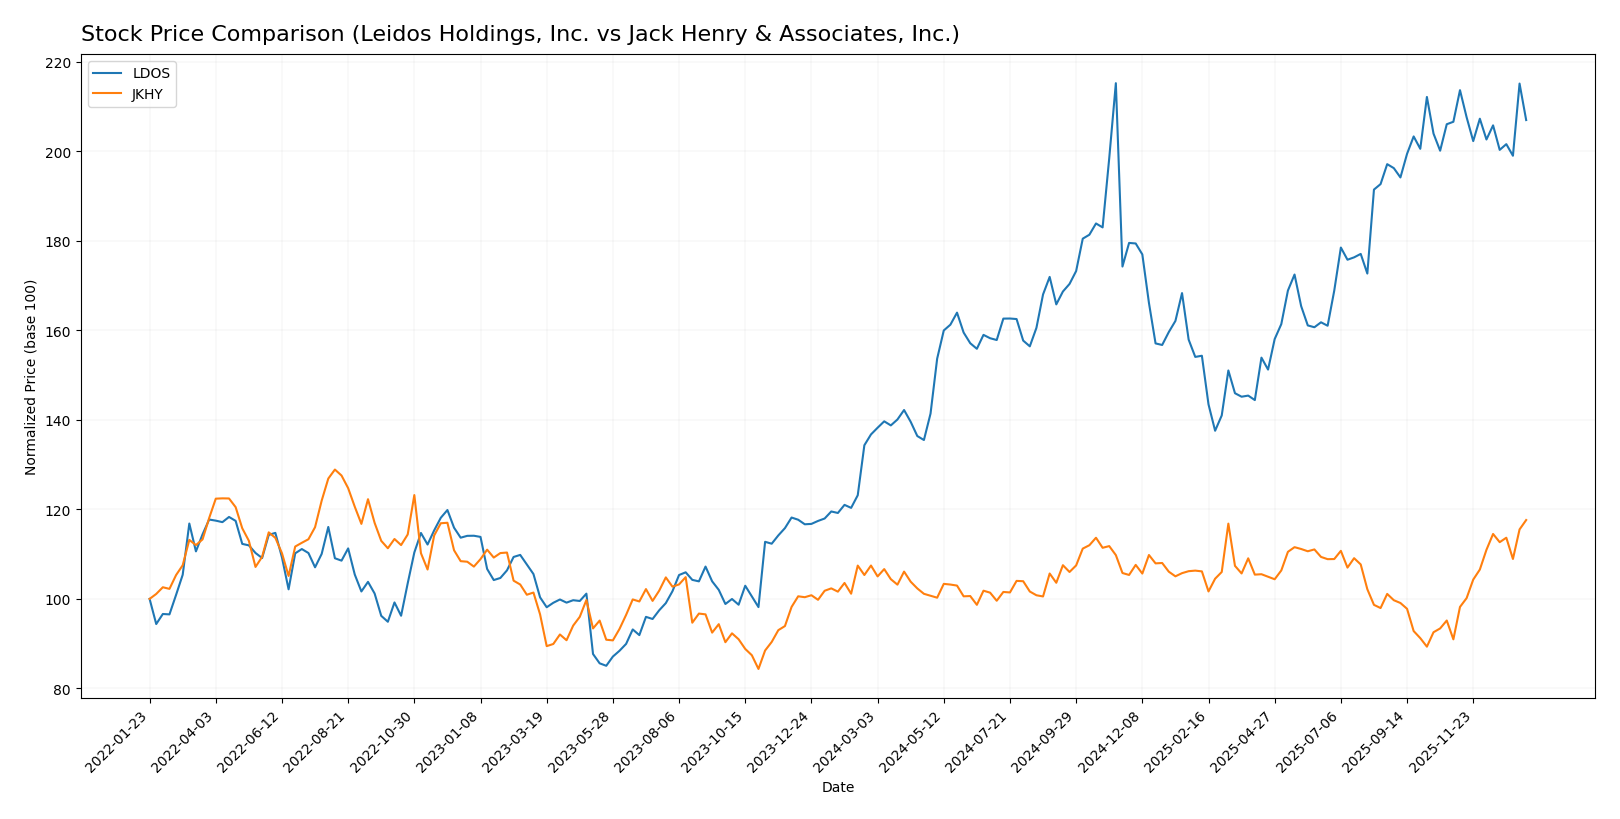
The stock price chart highlights significant bullish trends for both Leidos Holdings, Inc. (LDOS) and Jack Henry & Associates, Inc. (JKHY) over the past 12 months, with notable differences in trend acceleration and recent trading momentum.
Trend Analysis
Leidos Holdings, Inc. (LDOS) exhibited a strong bullish trend over the past year with a 51.37% price increase, though the trend showed deceleration. The stock reached a high of 198.42 and maintained high volatility with a 20.61 std deviation.
Jack Henry & Associates, Inc. (JKHY) also recorded a bullish trend with a 9.46% price rise and accelerating momentum. The volatility was moderate at 9.15 std deviation, peaking at 192.6, and recent gains accelerated sharply by 29.31%.
Comparing both, LDOS delivered the highest overall market performance with a 51.37% increase, while JKHY demonstrated stronger recent acceleration and buyer dominance despite a smaller annual gain.
Target Prices
The consensus analyst target prices for Leidos Holdings, Inc. and Jack Henry & Associates, Inc. indicate moderate upside potential.
| Company | Target High | Target Low | Consensus |
|---|---|---|---|
| Leidos Holdings, Inc. | 230 | 216 | 222.2 |
| Jack Henry & Associates, Inc. | 220 | 161 | 196 |
Analysts expect Leidos Holdings’ stock price to rise above its current 190.82 USD, with a consensus target of 222.2 USD. Jack Henry & Associates also shows upside potential from its current 192.6 USD price, with a target consensus of 196 USD.
Analyst Opinions Comparison
This section compares the analysts’ ratings and grades for Leidos Holdings, Inc. and Jack Henry & Associates, Inc.:
Rating Comparison
Leidos Holdings, Inc. Rating
- Rating: A- indicating a very favorable overall evaluation.
- Discounted Cash Flow Score: 5, very favorable for valuation.
- ROE Score: 5, very favorable showing efficient equity use.
- ROA Score: 4, favorable asset utilization.
- Debt To Equity Score: 1, very unfavorable high leverage.
- Overall Score: 4, favorable overall financial standing.
Jack Henry & Associates, Inc. Rating
- Rating: A- indicating a very favorable overall evaluation.
- Discounted Cash Flow Score: 4, favorable but lower than Leidos.
- ROE Score: 4, favorable but less efficient than Leidos.
- ROA Score: 5, very favorable, better asset efficiency.
- Debt To Equity Score: 4, favorable lower leverage than Leidos.
- Overall Score: 4, favorable overall financial standing.
Which one is the best rated?
Both companies have an overall rating of A- and an overall score of 4, indicating favorable financial standing. Leidos scores higher on discounted cash flow and ROE, while Jack Henry excels on ROA and has a stronger debt-to-equity profile.
Scores Comparison
Here is a comparison of the Altman Z-Score and Piotroski Score for Leidos Holdings and Jack Henry & Associates:
Leidos Holdings Scores
- Altman Z-Score: 4.15, indicating a safe zone with low bankruptcy risk.
- Piotroski Score: 8, classified as very strong financial health.
Jack Henry & Associates Scores
- Altman Z-Score: 12.58, indicating a safe zone with very low bankruptcy risk.
- Piotroski Score: 8, classified as very strong financial health.
Which company has the best scores?
Jack Henry & Associates has a higher Altman Z-Score of 12.58 compared to Leidos Holdings’ 4.15, both in the safe zone. Both companies share the same very strong Piotroski Score of 8.
Grades Comparison
Here is the comparison of recent reliable grades for Leidos Holdings, Inc. and Jack Henry & Associates, Inc.:
Leidos Holdings, Inc. Grades
The table below summarizes recent grades from reputable grading companies for Leidos Holdings, Inc.:
| Grading Company | Action | New Grade | Date |
|---|---|---|---|
| Citigroup | Maintain | Buy | 2026-01-13 |
| Stifel | Downgrade | Hold | 2026-01-08 |
| B of A Securities | Maintain | Buy | 2025-11-07 |
| Truist Securities | Maintain | Buy | 2025-11-05 |
| UBS | Maintain | Neutral | 2025-11-05 |
| Cantor Fitzgerald | Maintain | Overweight | 2025-10-31 |
| Argus Research | Maintain | Buy | 2025-09-24 |
| B of A Securities | Maintain | Buy | 2025-09-04 |
| RBC Capital | Upgrade | Outperform | 2025-09-04 |
| UBS | Maintain | Neutral | 2025-08-07 |
Leidos Holdings shows a majority of buy and outperform ratings with some neutrality and a few downgrades, indicating mixed but generally positive sentiment.
Jack Henry & Associates, Inc. Grades
The table below summarizes recent grades from reputable grading companies for Jack Henry & Associates, Inc.:
| Grading Company | Action | New Grade | Date |
|---|---|---|---|
| Wolfe Research | Upgrade | Outperform | 2026-01-08 |
| UBS | Maintain | Neutral | 2026-01-08 |
| RBC Capital | Upgrade | Outperform | 2025-12-16 |
| Baird | Maintain | Neutral | 2025-12-15 |
| Keefe, Bruyette & Woods | Upgrade | Outperform | 2025-12-08 |
| Goldman Sachs | Maintain | Neutral | 2025-11-07 |
| Wells Fargo | Maintain | Equal Weight | 2025-11-06 |
| Compass Point | Upgrade | Buy | 2025-11-06 |
| DA Davidson | Maintain | Buy | 2025-10-29 |
| Goldman Sachs | Maintain | Neutral | 2025-10-13 |
Jack Henry & Associates has a balanced mix of outperform and buy upgrades alongside neutral ratings, suggesting cautious optimism among analysts.
Which company has the best grades?
Both companies hold a consensus “Buy” rating, but Leidos has more consistent buy and outperform grades, while Jack Henry shows a higher number of neutral ratings. Investors may interpret Leidos’ grades as stronger endorsement, potentially reflecting greater confidence from analysts.
Strengths and Weaknesses
Below is a comparative overview of key strengths and weaknesses for Leidos Holdings, Inc. (LDOS) and Jack Henry & Associates, Inc. (JKHY) based on the most recent data.
| Criterion | Leidos Holdings, Inc. (LDOS) | Jack Henry & Associates, Inc. (JKHY) |
|---|---|---|
| Diversification | Highly diversified across National Security, Defense, Civil, and Health segments with strong revenue streams (e.g., $9.55B in National Security Solutions for 2024). | Diversified in Core, Payments, and Complementary services, with steady growth in each segment (Payments $873M in 2025). |
| Profitability | Moderate net margin (7.53%), strong ROE (28.42%) and ROIC (13.85%), indicating efficient capital use but slightly subdued profitability. | Strong profitability with high net margin (19.19%), ROE (21.39%), and ROIC (17.63%), reflecting robust earnings and capital efficiency. |
| Innovation | Demonstrates a very favorable economic moat with growing ROIC (7.98% above WACC, 67% ROIC growth), signaling durable competitive advantage and innovation in defense tech. | Also holds a very favorable moat (10.46% above WACC, 8% ROIC growth), supported by innovation in fintech and payments technology. |
| Global presence | Operates globally with significant contracts in national security and defense sectors; strong presence in government markets. | Primarily focused on U.S. financial services sector with limited global footprint, emphasizing domestic market strength. |
| Market Share | Strong market position in defense and government IT solutions, backed by large-scale contracts and diversified clientele. | Leading niche player in financial technology, especially in banking and payments sectors, with steady market share growth. |
Key takeaways: Leidos excels in diversification and global government contracts, with a strong innovation-driven moat in defense technology. Jack Henry shines in profitability and fintech innovation, sustaining a solid moat and focused domestic market dominance. Both companies present durable competitive advantages but cater to distinct markets and risk profiles.
Risk Analysis
The following table outlines key risk factors for Leidos Holdings, Inc. (LDOS) and Jack Henry & Associates, Inc. (JKHY) based on the most recent financial and operational data available for 2025-2026.
| Metric | Leidos Holdings, Inc. (LDOS) | Jack Henry & Associates, Inc. (JKHY) |
|---|---|---|
| Market Risk | Moderate (Beta 0.59; defense sector exposure) | Moderate (Beta 0.73; financial tech exposure) |
| Debt level | Elevated (Debt-to-Equity 1.2; unfavorable) | Very Low (Debt-to-Equity 0; favorable) |
| Regulatory Risk | High (Government contracts, defense regulations) | Moderate (Financial services compliance) |
| Operational Risk | Moderate (Large-scale system integration complexity) | Low (Focused tech solutions, fewer employees) |
| Environmental Risk | Moderate (Infrastructure and energy services impact) | Low (Primarily software services) |
| Geopolitical Risk | High (Global defense and intelligence contracts) | Low (Domestic financial institutions focus) |
The most significant risks for LDOS arise from its elevated debt levels and high geopolitical exposure due to its defense and intelligence contracts globally. JKHY shows strong financial stability with no debt and lower geopolitical risk but faces moderate regulatory challenges in the financial services sector. Investors should weigh LDOS’s riskier balance sheet and sector exposure against its favorable profitability, while JKHY’s stable financials and strong operational focus provide a more conservative profile.
Which Stock to Choose?
Leidos Holdings, Inc. (LDOS) shows a favorable income evolution with a 7.93% revenue growth last year and strong profitability, including a 28.42% ROE and 13.85% ROIC. However, its debt level is relatively high with a 1.2 debt-to-equity ratio, and the overall rating is very favorable at A-.
Jack Henry & Associates, Inc. (JKHY) demonstrates solid income growth with a 7.21% revenue increase last year and robust profitability metrics, including a 21.39% ROE and 17.63% ROIC. It maintains a debt-free position, reflected in a favorable debt rating, and holds a very favorable overall rating of A-.
Investors focused on value creation and durable competitive advantages might find both companies appealing. LDOS could be seen as suitable for those accepting moderate leverage with strong returns, while JKHY may appear more favorable for risk-averse investors preferring lower debt and consistent profitability.
Disclaimer: Investment carries a risk of loss of initial capital. The past performance is not a reliable indicator of future results. Be sure to understand risks before making an investment decision.
Go Further
I encourage you to read the complete analyses of Leidos Holdings, Inc. and Jack Henry & Associates, Inc. to enhance your investment decisions: