In the rapidly evolving technology sector, Jabil Inc. and Trimble Inc. stand out as influential players in hardware and equipment manufacturing. Jabil excels in comprehensive electronics design and manufacturing services, while Trimble focuses on advanced technology solutions for construction, agriculture, and transportation. Their overlapping markets and innovation strategies make this comparison essential for investors seeking promising opportunities. Join me as we explore which company holds the most potential for your portfolio.

Table of contents
Companies Overview
I will begin the comparison between Jabil Inc. and Trimble Inc. by providing an overview of these two companies and their main differences.
Jabil Overview
Jabil Inc. operates globally in manufacturing services and solutions, focusing on Electronics Manufacturing Services and Diversified Manufacturing Services. It offers a broad range of design, production, and product management services, including electronic and mechanical design, rapid prototyping, and manufacturing test solutions. Headquartered in Saint Petersburg, Florida, Jabil serves multiple industries such as 5G, automotive, healthcare, and packaging.
Trimble Overview
Trimble Inc. provides technology solutions designed to optimize work processes for professionals and field mobile workers worldwide. Its offerings span software and systems for construction, geospatial, agriculture, and transportation sectors. Headquartered in Westminster, California, Trimble delivers precision agriculture products, construction management software, and transportation fleet solutions that integrate data sharing, asset tracking, and project collaboration.
Key similarities and differences
Both companies operate in the Hardware, Equipment & Parts industry within the technology sector and serve diverse markets with technology-driven solutions. Jabil focuses primarily on manufacturing services, including electronic and mechanical design and production, while Trimble centers on software and systems aimed at enhancing workflow efficiency in specific sectors such as construction and agriculture. Jabil employs significantly more staff, reflecting its broader manufacturing scope, compared to Trimble’s emphasis on integrated technology solutions.
Income Statement Comparison
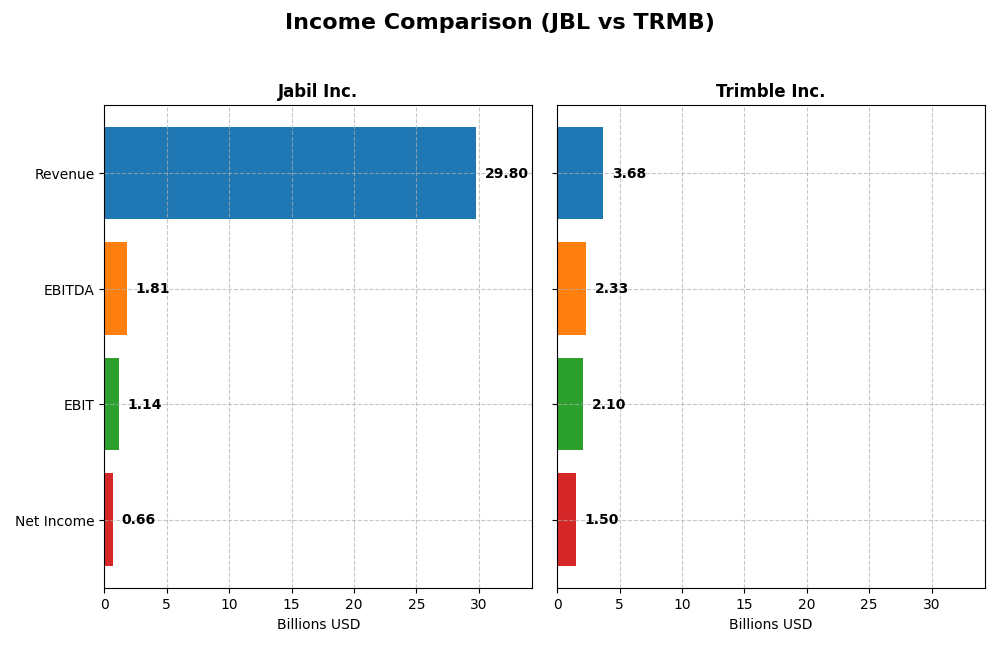
The table below compares the most recent fiscal year income statement metrics for Jabil Inc. and Trimble Inc., highlighting key financial performance indicators.
| Metric | Jabil Inc. | Trimble Inc. |
|---|---|---|
| Market Cap | 25.5B | 19.1B |
| Revenue | 29.8B | 3.68B |
| EBITDA | 1.81B | 2.33B |
| EBIT | 1.14B | 2.10B |
| Net Income | 657M | 1.50B |
| EPS | 6.00 | 6.13 |
| Fiscal Year | 2025 | 2024 |
Income Statement Interpretations
Jabil Inc.
Jabil Inc. showed modest revenue growth at 3.18% in the latest year but experienced a decline in net income by 54.13%, reflecting pressure on profitability. Margins remained mostly stable, with gross margin neutral at 8.88% and net margin at 2.2%. The 2025 fiscal year revealed unfavorable trends in EBIT and net margin, indicating margin compression despite revenue gains.
Trimble Inc.
Trimble Inc. reported a slight revenue decline of 3.04% in 2024 but achieved significant improvements in profitability, with EBIT margin at a favorable 56.92% and net margin at 40.84%. The company posted strong growth in EBIT (305%) and net margin (398%) year-over-year, suggesting enhanced operational efficiency and margin expansion despite the small revenue drop.
Which one has the stronger fundamentals?
Trimble Inc. exhibits stronger fundamentals with predominantly favorable income statement metrics, including high margins and robust growth in net income and earnings per share. Conversely, Jabil Inc. faces unfavorable net income and margin growth, with only limited favorable indicators. Trimble’s consistent margin expansion and income growth position it more positively overall.
Financial Ratios Comparison
This table presents the most recent financial ratios for Jabil Inc. (JBL) and Trimble Inc. (TRMB) based on their latest fiscal year data, allowing for a straightforward comparison.
| Ratios | Jabil Inc. (2025) | Trimble Inc. (2024) |
|---|---|---|
| ROE | 43.42% | 26.18% |
| ROIC | 16.06% | 4.49% |
| P/E | 34.14 | 11.52 |
| P/B | 14.82 | 3.02 |
| Current Ratio | 1.00 | 1.27 |
| Quick Ratio | 0.66 | 1.16 |
| D/E (Debt-to-Equity) | 2.22 | 0.26 |
| Debt-to-Assets | 18.15% | 15.96% |
| Interest Coverage | 4.84 | 5.08 |
| Asset Turnover | 1.61 | 0.39 |
| Fixed Asset Turnover | 9.01 | 11.81 |
| Payout ratio | 5.48% | 0% |
| Dividend yield | 0.16% | 0% |
Interpretation of the Ratios
Jabil Inc.
Jabil displays a mixed ratio profile with strong returns on equity (43.4%) and invested capital (16.1%), but weak net margin (2.2%) and elevated valuation multiples (P/E 34.1, P/B 14.8). Liquidity ratios are neutral to unfavorable, and leverage is concerning with a debt/equity of 2.22. Dividend yield is low at 0.16%, reflecting modest shareholder returns with potential payout risks.
Trimble Inc.
Trimble shows mostly favorable ratios, including a high net margin of 40.8%, solid ROE of 26.2%, and low debt-to-equity at 0.26. However, its return on invested capital is weak at 4.5%, and WACC is high at 10.8%. The company does not pay dividends, seemingly prioritizing reinvestment and growth, supported by strong interest coverage and a quick ratio of 1.16.
Which one has the best ratios?
Trimble holds the advantage with a higher proportion of favorable ratios (57.1%) compared to Jabil’s 35.7%, driven by superior profitability, lower leverage, and liquidity. Jabil’s high leverage, weak net margin, and valuation multiples weigh on its profile despite strong returns. Trimble’s reinvestment focus and solid fundamentals present a more favorable ratio landscape overall.
Strategic Positioning
This section compares the strategic positioning of Jabil Inc. and Trimble Inc. in terms of market position, key segments, and exposure to technological disruption:
Jabil Inc.
- Large market cap of 25.5B USD with moderate competitive pressure in manufacturing services.
- Diversified manufacturing services with Electronics and Diversified segments driving revenue.
- Exposure through electronics manufacturing and product design services in various industries.
Trimble Inc.
- Market cap 19.1B USD, facing higher beta and competitive pressure in technology solutions.
- Focused on technology solutions for Buildings, Geospatial, Resources, and Transportation sectors.
- Exposure via software and hardware solutions in construction, agriculture, and transportation.
Jabil Inc. vs Trimble Inc. Positioning
Jabil adopts a diversified approach with multiple manufacturing segments serving broad industries, offering scale advantages. Trimble concentrates on technology solutions for professional markets, emphasizing specialized software and hardware offerings, which may limit diversification.
Which has the best competitive advantage?
Jabil shows a very favorable moat with growing ROIC and value creation, indicating durable competitive advantage. Trimble displays a very unfavorable moat with declining ROIC and value destruction, suggesting weaker competitive positioning.
Stock Comparison
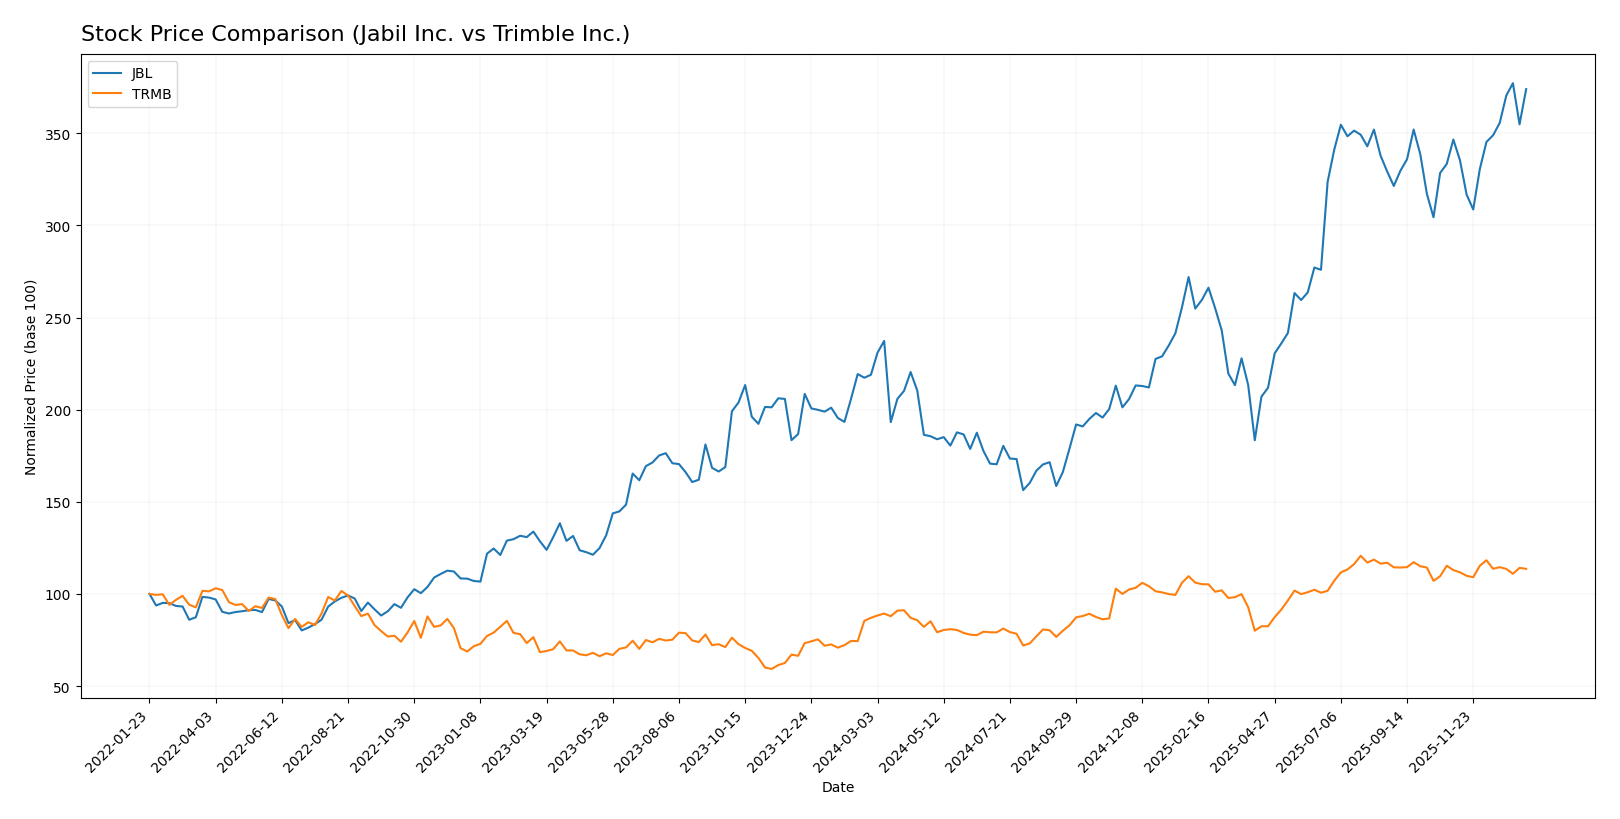
The stock prices of Jabil Inc. (JBL) and Trimble Inc. (TRMB) have displayed notable bullish trends over the past year, with JBL showing stronger acceleration and higher volatility compared to TRMB’s more moderate upward movement.
Trend Analysis
Jabil Inc. (JBL) experienced a 70.84% price increase over the past 12 months, indicating a strong bullish trend with acceleration. The stock showed significant volatility, with a standard deviation of 42.66, reaching a high of 240.39 and a low of 99.62.
Trimble Inc. (TRMB) recorded a 30.56% price increase over the same period, marking a bullish trend with deceleration. The stock exhibited lower volatility, with a standard deviation of 9.8, and fluctuated between 50.86 and 85.24.
Comparing the two, JBL delivered the highest market performance with a larger percentage gain and accelerated upward momentum, whereas TRMB showed a steady but slower bullish trend.
Target Prices
Analysts present a cautiously optimistic target consensus for both Jabil Inc. and Trimble Inc.
| Company | Target High | Target Low | Consensus |
|---|---|---|---|
| Jabil Inc. | 283 | 244 | 260.5 |
| Trimble Inc. | 102 | 94 | 98.2 |
For Jabil Inc., the consensus target price of 260.5 USD suggests upside potential from the current price of 238.35 USD. Trimble Inc.’s consensus target of 98.2 USD also indicates expected growth above its current 80.24 USD market price.
Analyst Opinions Comparison
This section compares analysts’ ratings and grades for Jabil Inc. and Trimble Inc.:
Rating Comparison
JBL Rating
- Rating: B- with a very favorable status
- Discounted Cash Flow Score: 3 (Moderate)
- ROE Score: 5 (Very Favorable)
- ROA Score: 3 (Moderate)
- Debt To Equity Score: 1 (Very Unfavorable)
- Overall Score: 3 (Moderate)
TRMB Rating
- Rating: B- with a very favorable status
- Discounted Cash Flow Score: 3 (Moderate)
- ROE Score: 3 (Moderate)
- ROA Score: 3 (Moderate)
- Debt To Equity Score: 2 (Moderate)
- Overall Score: 2 (Moderate)
Which one is the best rated?
Based on the data, JBL holds higher scores in return on equity and overall score, but a weaker debt-to-equity rating compared to TRMB. Both have the same overall rating of B- with very favorable status.
Scores Comparison
Here is a comparison of the financial health scores for Jabil Inc. and Trimble Inc.:
JBL Scores
- Altman Z-Score: 3.09, indicating a safe zone with low bankruptcy risk.
- Piotroski Score: 8, classified as very strong financial health.
TRMB Scores
- Altman Z-Score: 4.56, indicating a safe zone with very low bankruptcy risk.
- Piotroski Score: 6, classified as average financial health.
Which company has the best scores?
Trimble has a higher Altman Z-Score, signaling stronger bankruptcy safety, while Jabil has a higher Piotroski Score, indicating better overall financial strength. Both show financial stability but excel in different aspects.
Grades Comparison
Here is a detailed comparison of the latest grades and ratings for Jabil Inc. and Trimble Inc.:
Jabil Inc. Grades
The following table summarizes recent grades assigned to Jabil Inc. by reputable grading companies:
| Grading Company | Action | New Grade | Date |
|---|---|---|---|
| JP Morgan | Maintain | Overweight | 2025-12-18 |
| UBS | Maintain | Neutral | 2025-12-18 |
| Barclays | Maintain | Overweight | 2025-12-18 |
| B of A Securities | Maintain | Buy | 2025-12-10 |
| Barclays | Maintain | Overweight | 2025-09-26 |
| B of A Securities | Maintain | Buy | 2025-09-26 |
| JP Morgan | Maintain | Overweight | 2025-07-17 |
| B of A Securities | Maintain | Buy | 2025-06-20 |
| UBS | Maintain | Neutral | 2025-06-18 |
| JP Morgan | Maintain | Overweight | 2025-06-18 |
Jabil’s grades predominantly reflect an overweight or buy stance, with some neutral ratings, indicating cautious optimism among analysts.
Trimble Inc. Grades
The following table summarizes recent grades assigned to Trimble Inc. by reputable grading companies:
| Grading Company | Action | New Grade | Date |
|---|---|---|---|
| Barclays | Maintain | Overweight | 2026-01-12 |
| Keybanc | Upgrade | Overweight | 2025-12-16 |
| Piper Sandler | Maintain | Overweight | 2025-11-07 |
| JP Morgan | Maintain | Overweight | 2025-09-19 |
| JP Morgan | Maintain | Overweight | 2025-08-07 |
| Oppenheimer | Maintain | Outperform | 2025-08-07 |
| Raymond James | Maintain | Outperform | 2025-08-07 |
| Oppenheimer | Maintain | Outperform | 2025-07-17 |
| JP Morgan | Maintain | Overweight | 2025-07-10 |
| JP Morgan | Maintain | Overweight | 2025-05-14 |
Trimble’s grades show a consistent overweight and outperform rating trend, with a recent upgrade from Keybanc, signaling positive analyst sentiment.
Which company has the best grades?
Trimble Inc. has received generally stronger and more consistent grades, including multiple outperform ratings and a recent upgrade, compared to Jabil Inc.’s mix of overweight, buy, and neutral ratings. For investors, this may suggest a more favorable analyst outlook for Trimble, potentially impacting portfolio decisions based on growth expectations and risk appetite.
Strengths and Weaknesses
Below is a comparison of key strengths and weaknesses for Jabil Inc. (JBL) and Trimble Inc. (TRMB) based on the latest financial and operational data.
| Criterion | Jabil Inc. (JBL) | Trimble Inc. (TRMB) |
|---|---|---|
| Diversification | Highly diversified across Connected Living, Intelligent Infrastructure, and Regulated Industries with revenues above $30B in 2025. | Moderate diversification with products and services in various segments, total revenue around $3.7B in 2024. |
| Profitability | ROIC 16.06% (favorable), ROE 43.42% (favorable), but low net margin at 2.2% (unfavorable). | High net margin at 40.84% (favorable), ROE 26.18% (favorable), but ROIC 4.49% below WACC (unfavorable). |
| Innovation | Strong asset turnover (9.01 fixed asset turnover), indicating efficient use of resources; positive ROIC trend (+25%). | High fixed asset turnover (11.81) but declining ROIC (-37%) and value destruction indicate innovation challenges. |
| Global presence | Large scale with broad market reach in multiple industries globally. | Global presence with specialized markets but smaller scale compared to JBL. |
| Market Share | Large market share in electronic manufacturing services and diversified industries. | Smaller market share focused on geospatial and infrastructure technology. |
Key takeaways: Jabil demonstrates a durable competitive advantage with strong capital efficiency and broad diversification, though profitability margins remain thin. Trimble shows strong profitability metrics but faces challenges with declining ROIC and value destruction risks, making it a riskier investment choice.
Risk Analysis
Below is a comparative table outlining key risks for Jabil Inc. (JBL) and Trimble Inc. (TRMB) based on the most recent data available:
| Metric | Jabil Inc. (JBL) | Trimble Inc. (TRMB) |
|---|---|---|
| Market Risk | Moderate (Beta 1.25) | Higher (Beta 1.59) |
| Debt level | High (D/E 2.22, unfavorable) | Low (D/E 0.26, favorable) |
| Regulatory Risk | Moderate (Tech sector exposure) | Moderate (Tech and agriculture) |
| Operational Risk | Moderate (Complex manufacturing) | Moderate (Diverse tech solutions) |
| Environmental Risk | Moderate (Manufacturing footprint) | Moderate (Agriculture and construction tech) |
| Geopolitical Risk | Moderate (Global supply chains) | Moderate (Global operations) |
The most impactful and likely risk for Jabil is its high debt level, which could pressure financial stability despite strong returns on equity. Trimble’s higher market risk due to a more volatile beta contrasts with its healthier debt profile, reducing financial distress risk. Both face moderate operational and regulatory risks tied to their technology-driven industries and global exposure.
Which Stock to Choose?
Jabil Inc. (JBL) shows a mixed income evolution with a slight revenue growth of 3.18% in 2025 but unfavorable profitability trends, including a net margin decline of 54.13%. Its financial ratios present strengths in ROE (43.42%) and ROIC (16.06%), though offset by high debt-to-equity and weak liquidity ratios. The company holds a very favorable rating of B- and a very favorable moat status due to a growing ROIC above WACC, suggesting durable competitive advantages.
Trimble Inc. (TRMB) displays robust income metrics, with a favorable net margin of 40.84% and strong income growth over the period, despite a minor revenue decline of 3.04% in 2024. Its financial ratios reflect strengths in net margin, debt management, and interest coverage, balanced by some unfavorable metrics like ROIC below WACC. TRMB holds a very favorable rating of B- but a very unfavorable moat rating owing to declining ROIC and value destruction.
For investors prioritizing durable profitability and value creation, JBL’s very favorable moat and strong ROE may appear more attractive, while those focused on high current profitability and income growth might find TRMB’s favorable income statement and financial ratios compelling despite its weaker competitive moat. Overall, the choice could depend on the investor’s tolerance for risk and preference for stability versus growth.
Disclaimer: Investment carries a risk of loss of initial capital. The past performance is not a reliable indicator of future results. Be sure to understand risks before making an investment decision.
Go Further
I encourage you to read the complete analyses of Jabil Inc. and Trimble Inc. to enhance your investment decisions: