Home > Comparison > Technology > JBL vs TDY
The strategic rivalry between Jabil Inc. and Teledyne Technologies defines the current trajectory of the technology hardware sector. Jabil operates as a capital-intensive electronics manufacturing services provider, while Teledyne excels in precision instrumentation and aerospace electronics. This head-to-head pits scale-driven manufacturing against high-technology specialization. This analysis aims to identify which company’s path offers superior risk-adjusted returns for a diversified portfolio in today’s evolving industrial landscape.
Table of contents
Companies Overview
Jabil Inc. and Teledyne Technologies Incorporated both command critical roles in the industrial hardware and technology sectors.
Jabil Inc.: Global Manufacturing Powerhouse
Jabil Inc. dominates the electronics manufacturing services space by providing design, production, and product management worldwide. Its core revenue engine revolves around integrated manufacturing solutions, from PCB design to assembly and testing. In 2026, Jabil sharpens its strategic focus on diversified manufacturing to serve cutting-edge industries like 5G, automotive, and healthcare.
Teledyne Technologies Incorporated: High-Tech Industrial Enabler
Teledyne Technologies excels in enabling technologies for industrial growth through instrumentation, digital imaging, aerospace, and engineered systems. Its revenue derives from sophisticated sensor networks, imaging, and defense electronics. The company’s 2026 strategy prioritizes expanding high-precision instrumentation and aerospace electronics for defense and space applications.
Strategic Collision: Similarities & Divergences
Jabil and Teledyne share a technology-driven industrial focus but diverge in business philosophy—Jabil emphasizes contract manufacturing, while Teledyne invests in proprietary high-tech instrumentation. Their battlefront centers on advanced hardware components across industrial and defense markets. This creates distinct investment profiles: Jabil offers broad manufacturing scale, whereas Teledyne provides niche technological expertise.
Income Statement Comparison
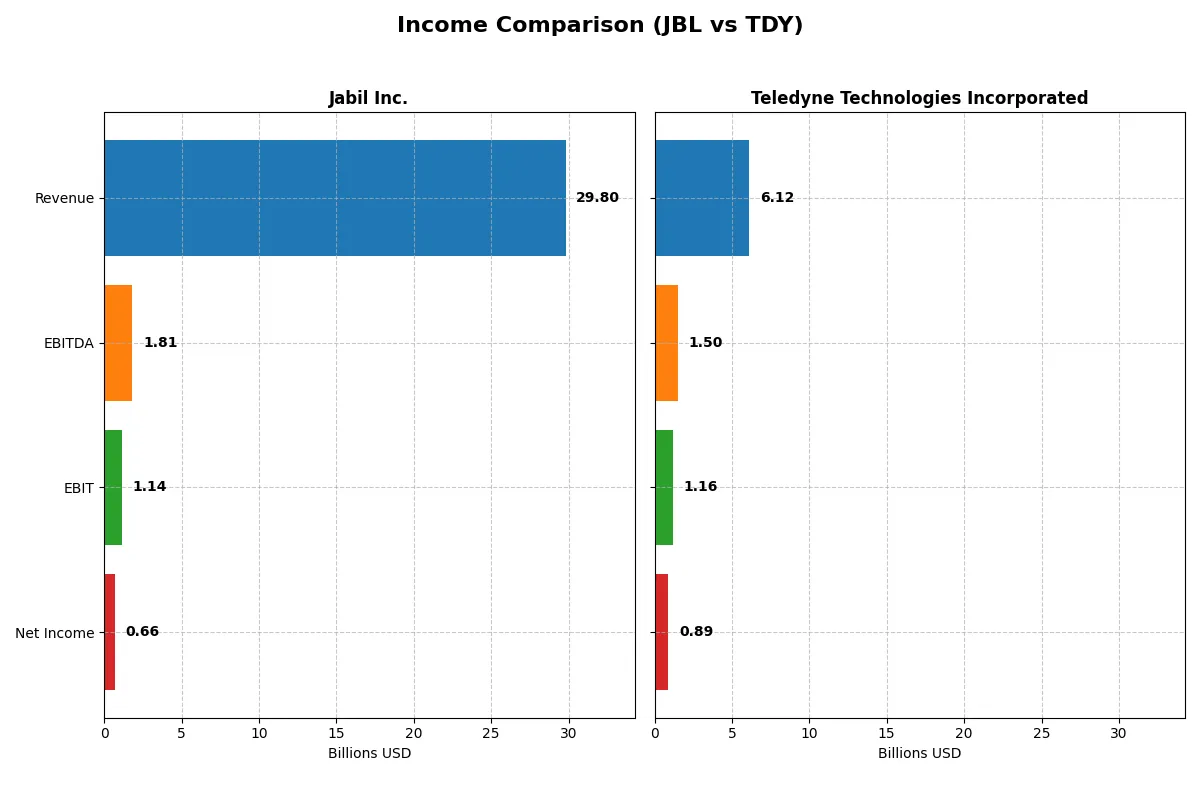
The following data dissects the core profitability and scalability of both corporate engines to reveal who dominates the bottom line:
| Metric | Jabil Inc. (JBL) | Teledyne Technologies Incorporated (TDY) |
|---|---|---|
| Revenue | 29.8B | 6.12B |
| Cost of Revenue | 27.2B | 3.72B |
| Operating Expenses | 1.46B | 1.25B |
| Gross Profit | 2.65B | 2.40B |
| EBITDA | 1.81B | 1.50B |
| EBIT | 1.14B | 1.16B |
| Interest Expense | 244M | 60M |
| Net Income | 657M | 895M |
| EPS | 6.00 | 18.88 |
| Fiscal Year | 2025 | 2025 |
Income Statement Analysis: The Bottom-Line Duel
This income statement comparison reveals which company runs a more efficient and profitable business engine through their revenue and net income performance.
Jabil Inc. Analysis
Jabil Inc. shows a mixed revenue trend with a slight 3.2% growth in 2025, but net income dropped sharply by 54.1% year-over-year. Gross margin remains weak at 8.9%, and net margin is slim at 2.2%, reflecting margin pressure and operational inefficiencies. The latest year’s declining EBIT and net income highlight deteriorating profitability momentum.
Teledyne Technologies Incorporated Analysis
Teledyne Technologies exhibits strong and consistent revenue growth of 7.9% in 2025, with net income rising modestly by 1.3%. Its gross margin impresses at 39.2%, and net margin holds robust at 14.6%, signaling excellent cost control and pricing power. The company’s EBIT margin of 19% confirms operational strength and momentum in profitability expansion.
Margin Strength vs. Profitability Momentum
Teledyne clearly outperforms Jabil with superior margins and sustained profit growth over the period. Jabil’s declining net income and margin contraction contrast with Teledyne’s robust earnings expansion and operational efficiency. For investors prioritizing profitability and margin resilience, Teledyne’s profile offers a stronger fundamental appeal.
Financial Ratios Comparison
These vital ratios act as a diagnostic tool to expose the underlying fiscal health, valuation premiums, and capital efficiency of the companies compared below:
| Ratios | Jabil Inc. (JBL) | Teledyne Technologies (TDY) |
|---|---|---|
| ROE | 43.4% | 8.5% |
| ROIC | 16.1% | 6.8% |
| P/E | 34.1 | 27.3 |
| P/B | 14.8 | 2.3 |
| Current Ratio | 1.00 | 1.64 |
| Quick Ratio | 0.66 | 1.08 |
| D/E | 2.22 | 0.24 |
| Debt-to-Assets | 18.2% | 16.2% |
| Interest Coverage | 4.8 | 19.3 |
| Asset Turnover | 1.61 | 0.40 |
| Fixed Asset Turnover | 9.01 | 7.29 |
| Payout Ratio | 5.5% | 0% |
| Dividend Yield | 0.16% | 0% |
| Fiscal Year | 2025 | 2025 |
Efficiency & Valuation Duel: The Vital Signs
Financial ratios act as a company’s DNA, exposing hidden risks and operational strengths that shape investor decisions.
Jabil Inc.
Jabil Inc. delivers a high return on equity at 43.42%, signaling strong profitability, yet its net margin is weak at 2.2%. The stock trades at a stretched P/E of 34.14 and an expensive P/B of 14.82. Dividend yield is minimal at 0.16%, suggesting limited shareholder payback and possible reinvestment focus.
Teledyne Technologies Incorporated
Teledyne posts a solid net margin of 14.63%, though its ROE of 8.51% lags behind Jabil’s. Valuation appears less stretched with a P/E of 27.35 and a reasonable P/B of 2.33. The company offers no dividend, implying reinvestment into growth or R&D to fuel future returns.
Premium Valuation vs. Operational Safety
Jabil commands higher profitability but at a premium valuation with modest shareholder returns. Teledyne exhibits greater operational stability and a more balanced valuation. Investors seeking growth might prefer Jabil’s aggressive profile; those prioritizing financial safety may lean toward Teledyne’s steadier metrics.
Which one offers the Superior Shareholder Reward?
I observe that Jabil Inc. (JBL) pays a modest dividend yield of 0.16% with a payout ratio near 5.5%, supported by solid free cash flow coverage around 70%. Its buyback activity appears limited given the high debt leverage (debt-to-equity above 2.2). Teledyne Technologies (TDY) pays no dividends but aggressively returns capital through buybacks, with free cash flow coverage exceeding 90%. TDY’s lower leverage (debt-to-equity ~0.24) and higher operating margins support this. I view TDY’s reinvestment and buyback model as more sustainable and likely to deliver superior total returns in 2026, especially given its consistent FCF generation and conservative capital structure. JBL’s dividend yield is negligible, and its high leverage raises risk. Therefore, I favor TDY for superior shareholder reward over Jabil.
Comparative Score Analysis: The Strategic Profile
The radar chart reveals the fundamental DNA and trade-offs of both firms, highlighting their distinctive financial strengths and weaknesses:
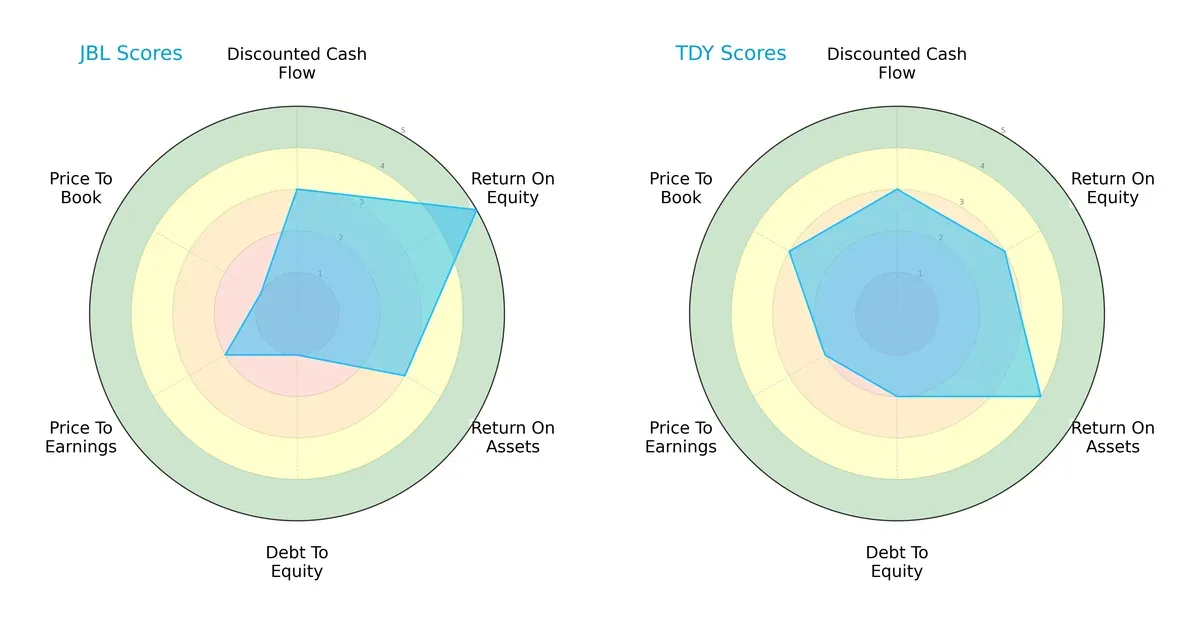
Jabil Inc. (JBL) excels in Return on Equity with a very favorable score of 5, signaling strong profit generation from shareholders’ equity. However, it struggles with leverage, showing a very unfavorable debt-to-equity score of 1 and valuation metrics (P/B at 1). Teledyne Technologies (TDY) presents a more balanced profile with moderate to favorable scores across ROA (4) and debt-to-equity (2), indicating better asset efficiency and financial stability. TDY’s valuation scores (P/B at 3) reflect a relatively fair market price. JBL relies heavily on its ROE advantage but carries significant balance sheet risks, while TDY offers steadier financial health with less pronounced extremes.
Bankruptcy Risk: Solvency Showdown
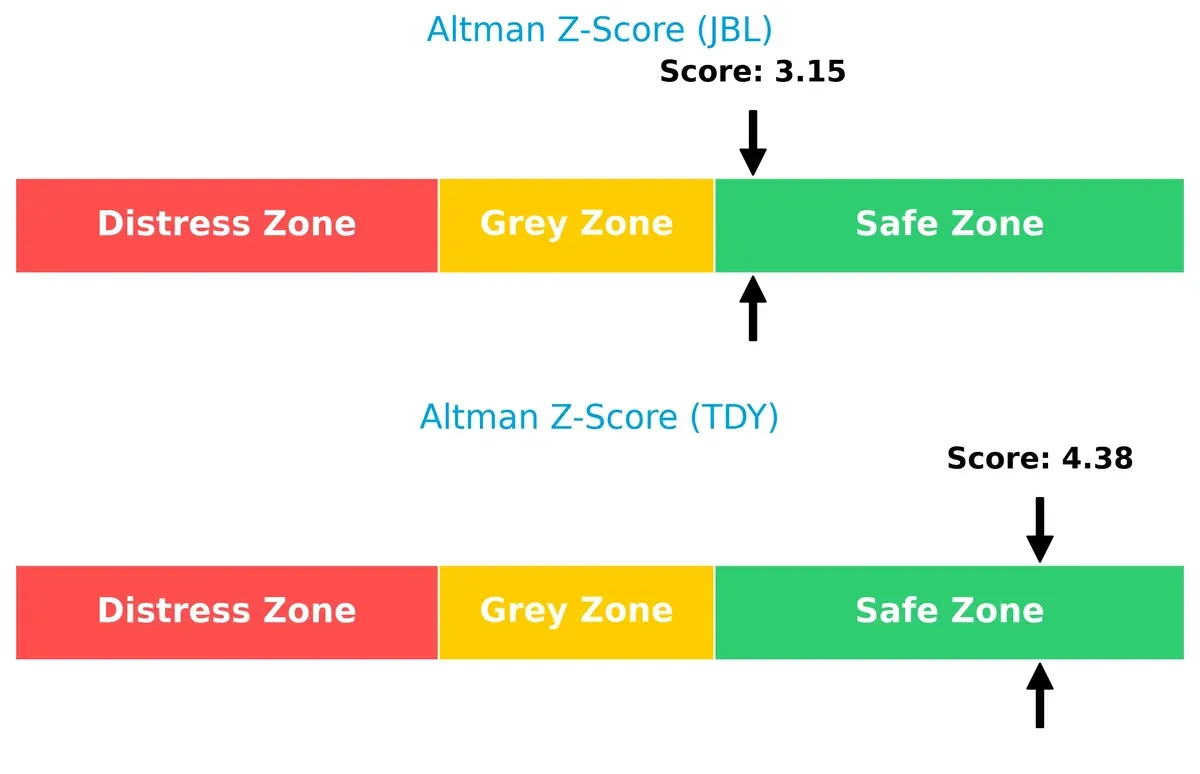
The Altman Z-Scores place both companies securely in the safe zone, yet TDY’s higher score (4.38) versus JBL’s 3.15 implies stronger long-term solvency and lower bankruptcy risk in this market cycle:
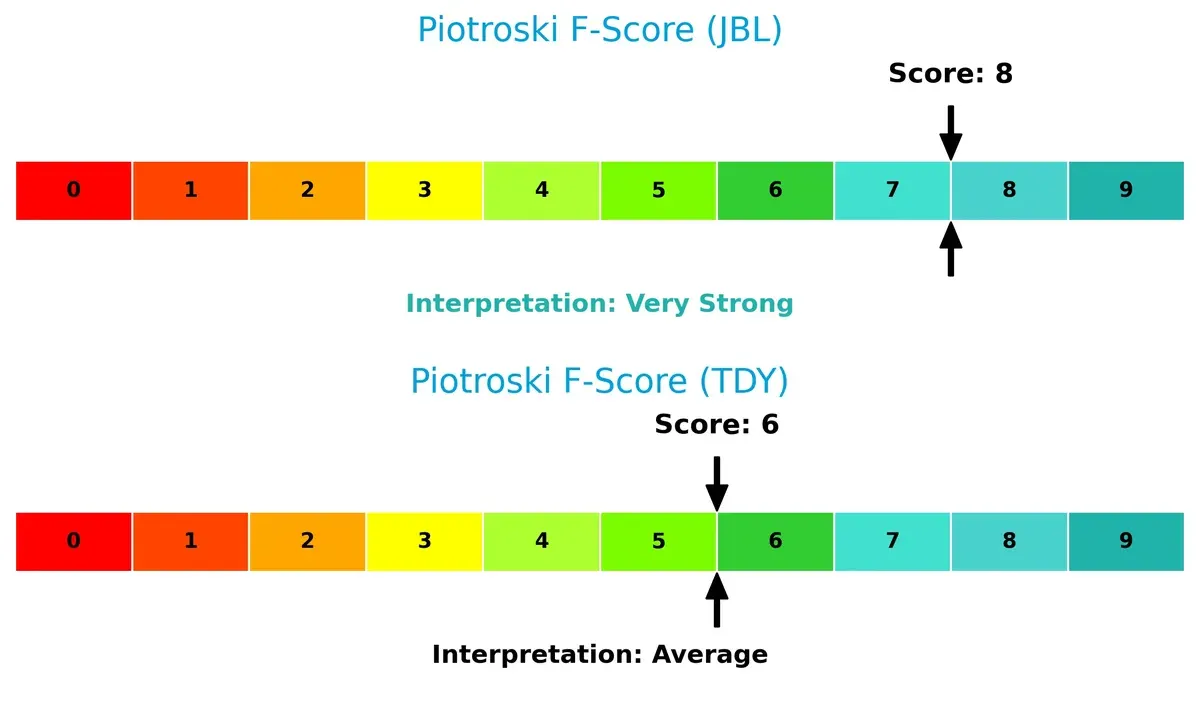
Financial Health: Quality of Operations
JBL’s Piotroski F-Score of 8 indicates very strong financial health, reflecting robust profitability, liquidity, and operational efficiency. TDY’s score of 6, while solid, suggests average financial strength with potential internal metric weaknesses relative to JBL:
How are the two companies positioned?
This section dissects the operational DNA of JBL and TDY by comparing their revenue distribution and internal dynamics, including strengths and weaknesses. The final objective confronts their economic moats to reveal which business model delivers the most resilient, sustainable competitive advantage today.
Revenue Segmentation: The Strategic Mix
This visual comparison dissects how Jabil Inc. and Teledyne Technologies diversify their income streams and where their primary sector bets lie:
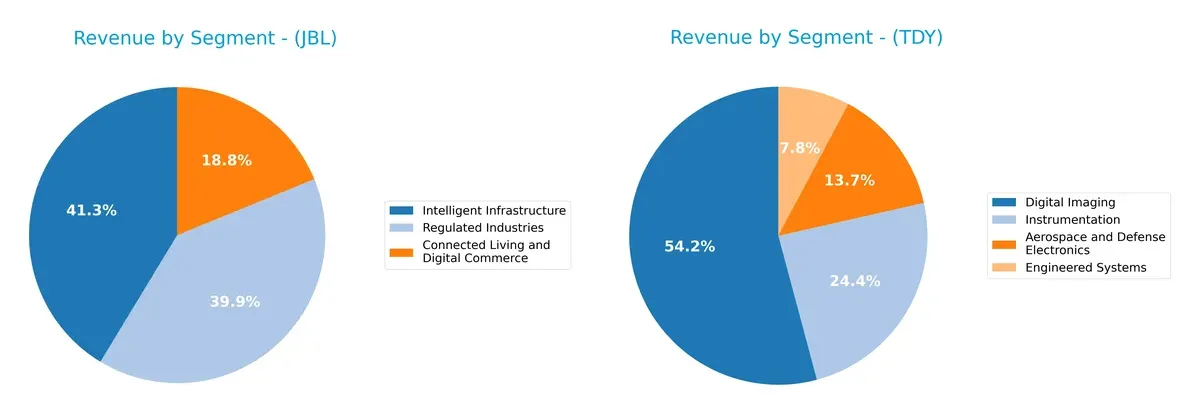
Jabil Inc. anchors its revenue in three large segments: Intelligent Infrastructure at $12.3B, Regulated Industries at $11.9B, and Connected Living at $5.6B, showing a balanced yet concentrated portfolio. Teledyne pivots around Digital Imaging at $3.1B, with smaller contributions from Instrumentation ($1.4B), Aerospace and Defense Electronics ($0.8B), and Engineered Systems ($0.4B), indicating a more diversified but lower scale mix. Jabil’s concentration suggests ecosystem dominance, while Teledyne’s spread mitigates single-segment risk.
Strengths and Weaknesses Comparison
This table compares the strengths and weaknesses of Jabil Inc. and Teledyne Technologies Incorporated:
Jabil Inc. Strengths
- Diverse revenue streams across Connected Living, Intelligent Infrastructure, Regulated Industries
- Strong ROE and ROIC indicate effective capital allocation
- Favorable asset turnover ratios suggest operational efficiency
- Significant global presence including US, China, Mexico, Malaysia
- Well-diversified geographic sales mitigate country risk
Teledyne Technologies Strengths
- High net margin reflects strong profitability
- Favorable current and quick ratios show solid liquidity
- Low debt-to-equity and strong interest coverage indicate financial stability
- Presence in Aerospace, Digital Imaging, Instrumentation sectors
- Significant US and European market exposure supports growth
Jabil Inc. Weaknesses
- Low net margin signals pressure on profitability
- High debt-to-equity ratio raises financial risk
- Unfavorable PE and PB ratios suggest overvaluation concerns
- Low quick ratio implies potential short-term liquidity issues
- Minimal dividend yield may deter income-focused investors
Teledyne Technologies Weaknesses
- Lower ROE and neutral ROIC highlight moderate returns on capital
- Unfavorable PE ratio indicates possible valuation concerns
- Lower asset turnover suggests less efficient asset use
- Absence of dividend yield may limit appeal to yield investors
Both companies show strengths in diversification and global reach but differ in profitability and capital efficiency. Jabil excels in return metrics but faces liquidity and valuation challenges. Teledyne’s profitability and financial stability stand out, though with less efficient asset use. These factors influence how each firm can leverage its strategy in competitive markets.
The Moat Duel: Analyzing Competitive Defensibility
A structural moat is the only true shield protecting long-term profits from relentless competition erosion:
Jabil Inc.: Operational Scale & Cost Advantage Moat
Jabil’s competitive edge stems from its vast manufacturing scale and cost efficiency. It posts a strong ROIC exceeding WACC by nearly 7%, signaling value creation. Expansion into emerging markets and diversified manufacturing deepens this moat in 2026.
Teledyne Technologies Incorporated: Innovation-Driven Intangible Assets
Teledyne relies on high-tech innovation and specialized product lines. Unlike Jabil, it struggles with ROIC below WACC, indicating value destruction despite growing profitability. Continued R&D and aerospace sector growth could restore its moat strength.
Scale Efficiency vs. Innovation Leadership
Jabil’s wider moat reflects consistent value creation through scale and cost control. Teledyne’s narrower moat hinges on innovation but currently sheds value. Jabil is better positioned to defend market share amid competitive pressures.
Which stock offers better returns?
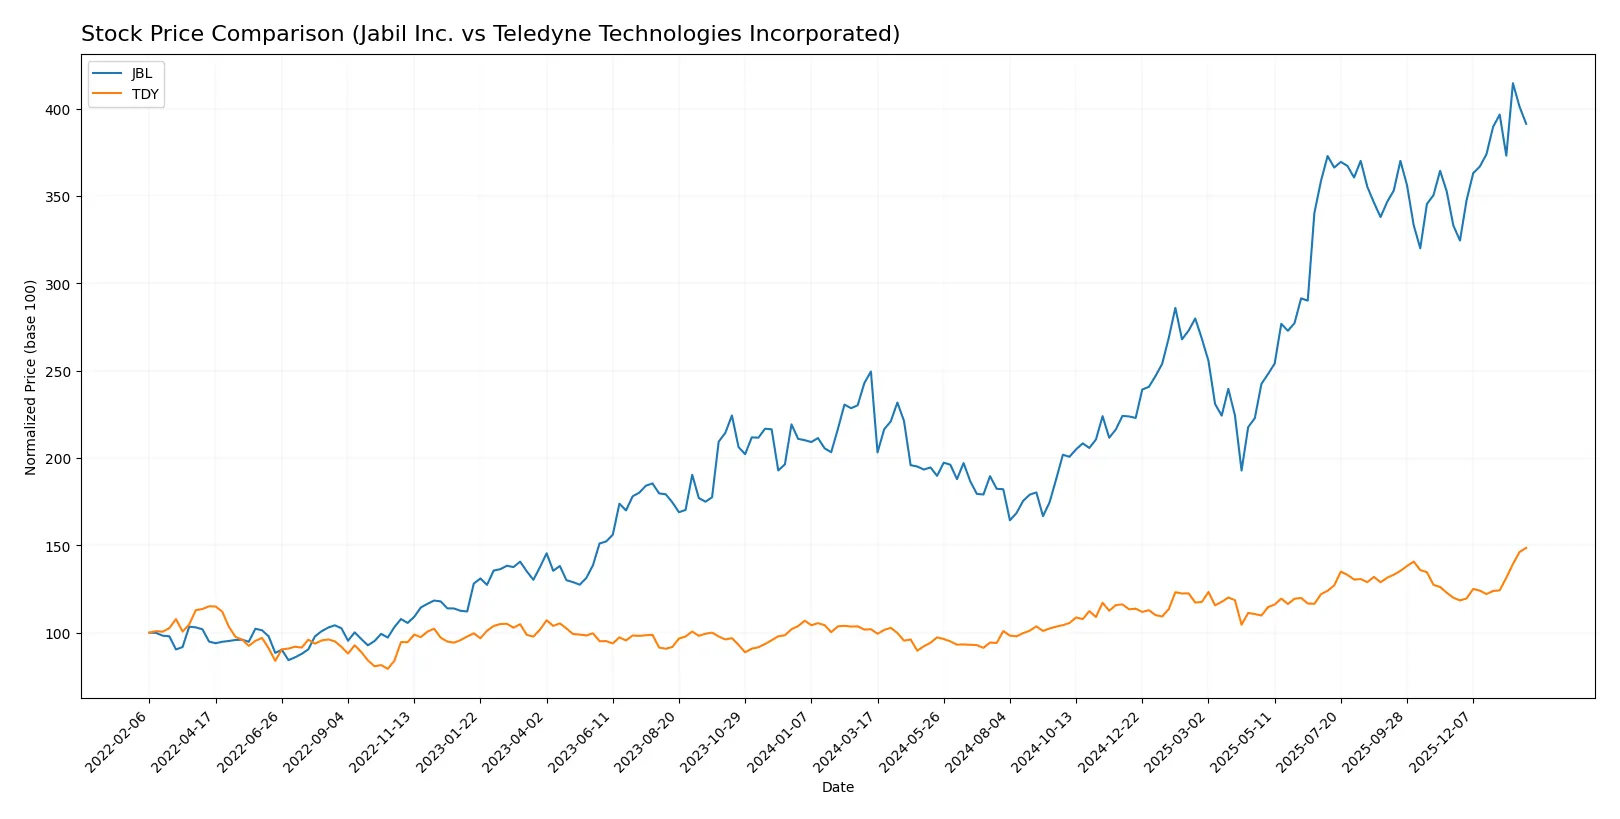
The past year shows clear bullish momentum for both stocks, with Jabil Inc. leading in price appreciation and Teledyne Technologies demonstrating stronger recent acceleration.
Trend Comparison
Jabil Inc. gained 56.83% over the past 12 months, showing a bullish trend with accelerating momentum and a high volatility of 44.31%. The stock hit a low of 99.62 and peaked at 251.29.
Teledyne Technologies rose 45.62% over the same period, also bullish with acceleration. It experienced greater volatility at 58.2%, ranging from 374.64 to 620.3, and showed stronger recent slope growth.
Jabil’s higher total return of 56.83% surpasses Teledyne’s 45.62%, indicating superior market performance despite Teledyne’s higher recent acceleration.
Target Prices
Analysts show confident upside potential for Jabil Inc. and Teledyne Technologies.
| Company | Target Low | Target High | Consensus |
|---|---|---|---|
| Jabil Inc. | 244 | 283 | 267.25 |
| Teledyne Technologies Incorporated | 599 | 720 | 638.5 |
The consensus targets for JBL and TDY exceed their current prices by roughly 12.6% and 3%, respectively, signaling moderate growth expectations.

Don’t Let Luck Decide Your Entry Point
Optimize your entry points with our advanced ProRealTime indicators. You’ll get efficient buy signals with precise price targets for maximum performance. Start outperforming now!
How do institutions grade them?
Jabil Inc. Grades
The following table summarizes recent grades from key financial institutions for Jabil Inc.:
| Grading Company | Action | New Grade | Date |
|---|---|---|---|
| UBS | Maintain | Neutral | 2025-12-18 |
| Barclays | Maintain | Overweight | 2025-12-18 |
| JP Morgan | Maintain | Overweight | 2025-12-18 |
| B of A Securities | Maintain | Buy | 2025-12-10 |
| B of A Securities | Maintain | Buy | 2025-09-26 |
| Barclays | Maintain | Overweight | 2025-09-26 |
| JP Morgan | Maintain | Overweight | 2025-07-17 |
| B of A Securities | Maintain | Buy | 2025-06-20 |
| UBS | Maintain | Neutral | 2025-06-18 |
| B of A Securities | Maintain | Buy | 2025-06-18 |
Teledyne Technologies Incorporated Grades
The following table summarizes recent grades from key financial institutions for Teledyne Technologies Incorporated:
| Grading Company | Action | New Grade | Date |
|---|---|---|---|
| Barclays | Maintain | Equal Weight | 2026-01-22 |
| Needham | Maintain | Buy | 2026-01-22 |
| Stifel | Maintain | Buy | 2026-01-22 |
| Citigroup | Maintain | Neutral | 2026-01-13 |
| Barclays | Maintain | Equal Weight | 2026-01-12 |
| Needham | Maintain | Buy | 2025-10-23 |
| Barclays | Maintain | Equal Weight | 2025-10-23 |
| Stifel | Maintain | Buy | 2025-10-23 |
| Morgan Stanley | Maintain | Equal Weight | 2025-10-15 |
| UBS | Maintain | Buy | 2025-07-24 |
Which company has the best grades?
Jabil Inc. consistently earns “Buy” and “Overweight” grades, indicating strong institutional confidence. Teledyne Technologies mostly receives “Buy” and “Equal Weight,” reflecting moderate optimism. Investors may interpret Jabil’s higher grades as a stronger endorsement, potentially signaling better near-term prospects.
Risks specific to each company
The following categories identify the critical pressure points and systemic threats facing both firms in the 2026 market environment:
1. Market & Competition
Jabil Inc.
- Faces intense competition in Electronics Manufacturing Services with pressure on margins.
Teledyne Technologies Incorporated
- Operates in specialized tech niches, benefiting from less direct competition but exposed to industrial demand cycles.
2. Capital Structure & Debt
Jabil Inc.
- High debt-to-equity ratio of 2.22 signals elevated financial leverage risk.
Teledyne Technologies Incorporated
- Maintains conservative leverage with debt-to-equity at 0.24, reflecting a stronger balance sheet.
3. Stock Volatility
Jabil Inc.
- Beta of 1.246 indicates above-market volatility, increasing risk during downturns.
Teledyne Technologies Incorporated
- Beta near 1.027 suggests stock moves closely with the market, lower relative volatility.
4. Regulatory & Legal
Jabil Inc.
- Exposure to global regulatory compliance in electronics manufacturing may increase costs.
Teledyne Technologies Incorporated
- Aerospace and defense segments face strict regulatory scrutiny and potential export controls.
5. Supply Chain & Operations
Jabil Inc.
- Complex global supply chains are vulnerable to component shortages and geopolitical disruptions.
Teledyne Technologies Incorporated
- Operates diversified manufacturing with some reliance on specialized components, moderately exposed.
6. ESG & Climate Transition
Jabil Inc.
- Pressure to reduce carbon footprint and enhance sustainability in manufacturing processes.
Teledyne Technologies Incorporated
- Increasing demand for environmentally compliant aerospace and defense products but faces transition costs.
7. Geopolitical Exposure
Jabil Inc.
- Significant international operations expose it to trade tensions and tariff risks.
Teledyne Technologies Incorporated
- Global defense contracts subject to geopolitical shifts and government spending variability.
Which company shows a better risk-adjusted profile?
Jabil’s most impactful risk lies in its elevated financial leverage, which heightens bankruptcy risk despite strong operational metrics. Teledyne’s primary risk stems from regulatory and geopolitical exposure in defense markets, though it maintains a stronger balance sheet and lower stock volatility. Overall, Teledyne offers a better risk-adjusted profile, supported by its safe-zone Altman Z-score of 4.38 and moderate Piotroski score of 6, compared to Jabil’s higher leverage and weaker liquidity ratios.
Final Verdict: Which stock to choose?
Jabil Inc. (JBL) stands out with its superpower of generating extraordinary returns on equity and invested capital. It demonstrates a durable competitive advantage through growing profitability. However, its leverage and liquidity ratios remain points of vigilance. JBL suits investors eyeing aggressive growth with tolerance for financial risks.
Teledyne Technologies Incorporated (TDY) boasts a strategic moat rooted in its robust gross margins and strong cash flow quality. Its conservative balance sheet offers better financial stability compared to JBL. TDY fits well in a GARP (Growth at a Reasonable Price) portfolio, appealing to those favoring steady income and moderate risk.
If you prioritize high returns driven by operational efficiency and are comfortable with leverage, JBL is the compelling choice due to its durable value creation. However, if you seek better financial stability and consistent income growth, TDY offers superior safety and margin resilience, commanding a premium for lower risk.
Disclaimer: Investment carries a risk of loss of initial capital. The past performance is not a reliable indicator of future results. Be sure to understand risks before making an investment decision.
Go Further
I encourage you to read the complete analyses of Jabil Inc. and Teledyne Technologies Incorporated to enhance your investment decisions: