Home > Comparison > Technology > TEL vs JBL
The strategic rivalry between TE Connectivity Ltd. and Jabil Inc. shapes the competitive landscape of the Technology sector’s Hardware, Equipment & Parts industry. TE Connectivity operates as a global manufacturer of connectivity and sensor solutions, emphasizing diversified industrial applications. In contrast, Jabil focuses on electronics manufacturing services and design, leveraging scale across multiple end markets. This analysis will assess which company offers a superior risk-adjusted return for a diversified portfolio amid evolving sector dynamics.
Table of contents
Companies Overview
TE Connectivity Ltd. and Jabil Inc. are pivotal players in the global hardware and equipment sector, shaping technology infrastructure worldwide.
TE Connectivity Ltd.: Global Leader in Connectivity Solutions
TE Connectivity Ltd. excels as a manufacturer of connectivity and sensor solutions, generating revenue through its Transportation, Industrial, and Communications segments. Its diversified product range spans automotive, aerospace, and data communications markets. In 2026, the company emphasizes expanding its industrial and communication solutions to capture growth in emerging technology applications.
Jabil Inc.: Manufacturing Powerhouse in Electronics Services
Jabil Inc. stands out as a provider of manufacturing services and solutions, focusing on electronics design, production, and product management. It serves diverse industries including 5G, automotive, healthcare, and cloud computing. In 2026, Jabil prioritizes innovation in electronics manufacturing and system assembly to enhance its footprint across high-growth sectors.
Strategic Collision: Similarities & Divergences
Both firms operate in hardware and equipment but diverge in approach: TE Connectivity focuses on integrated product manufacturing, while Jabil emphasizes flexible electronics manufacturing services. Their primary battleground lies in industrial and automotive technology markets. Investors should note TE’s strength in proprietary components contrasts with Jabil’s scale and service diversity, defining distinct risk and growth profiles.
Income Statement Comparison
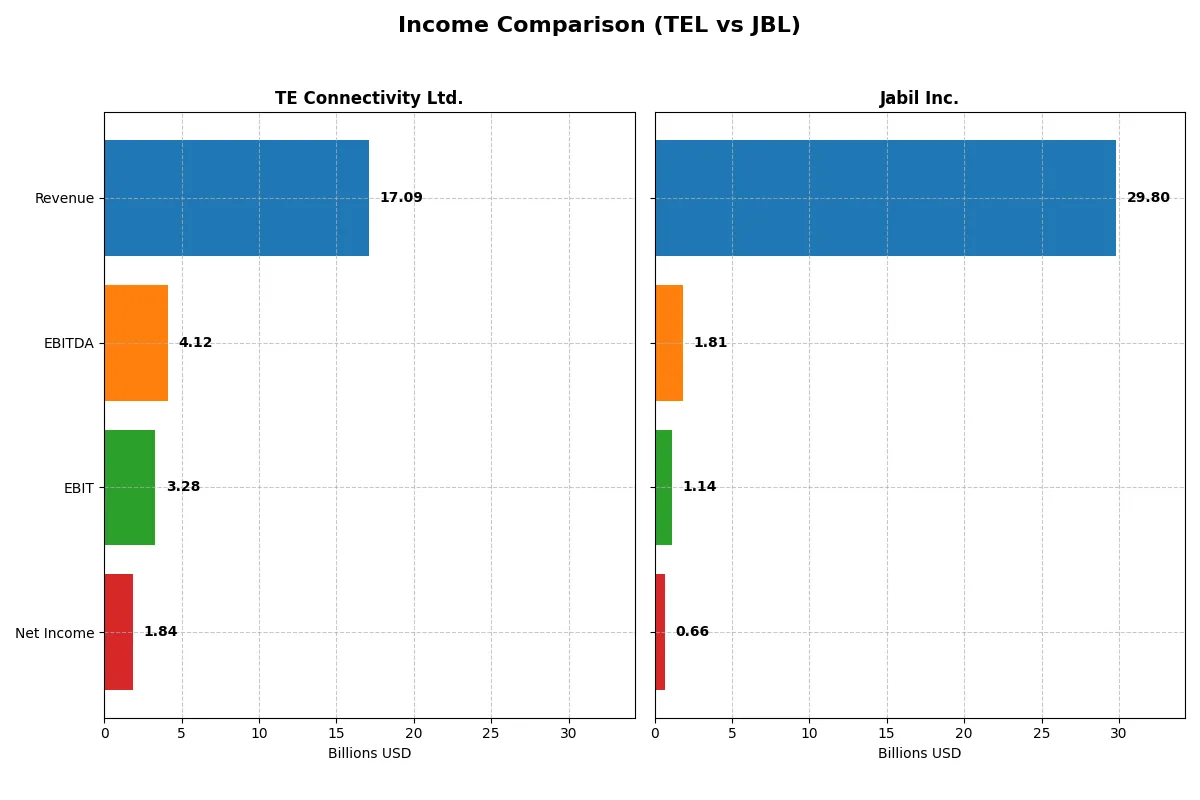
This data dissects the core profitability and scalability of both corporate engines to reveal who dominates the bottom line:
| Metric | TE Connectivity Ltd. (TEL) | Jabil Inc. (JBL) |
|---|---|---|
| Revenue | 17.1B | 29.8B |
| Cost of Revenue | 11.2B | 27.2B |
| Operating Expenses | 2.7B | 1.5B |
| Gross Profit | 5.9B | 2.6B |
| EBITDA | 4.1B | 1.8B |
| EBIT | 3.3B | 1.1B |
| Interest Expense | 77M | 244M |
| Net Income | 1.8B | 657M |
| EPS | 6.20 | 6.00 |
| Fiscal Year | 2025 | 2025 |
Income Statement Analysis: The Bottom-Line Duel
This income statement comparison exposes which company drives its business model more efficiently through revenue and profit dynamics.
TE Connectivity Ltd. Analysis
TE Connectivity shows a solid revenue growth trajectory, reaching $17.1B in 2025, up 7.85% from 2024. Its gross margin remains healthy at 34.56%, and the net margin holds favorable ground at 10.78%. Despite a sharp net income decline in 2025 to $1.84B, operational efficiency improved with EBIT margin climbing to 19.2%, signaling strong core profitability momentum.
Jabil Inc. Analysis
Jabil’s revenue grew modestly by 3.18% to $29.8B in 2025, but its gross margin fell to 8.88%, reflecting tighter cost control challenges. Net income dropped sharply to $657M, pulling the net margin down to 2.2%. EBIT margin of 3.81% also shrank, highlighting weakening operating efficiency and significant margin compression amid rising expenses.
Margin Power vs. Revenue Scale
TE Connectivity outperforms Jabil in profitability and margin sustainability despite lower revenue scale. TE’s superior gross and EBIT margins reflect better cost management and operational leverage. Jabil’s higher top-line is offset by thin margins and declining net income. For investors, TE’s profile offers stronger fundamental earnings quality over Jabil’s volume-driven but less efficient model.
Financial Ratios Comparison
These vital ratios act as a diagnostic tool to expose the underlying fiscal health, valuation premiums, and capital efficiency of the companies compared below:
| Ratios | TE Connectivity Ltd. (TEL) | Jabil Inc. (JBL) |
|---|---|---|
| ROE | 14.6% | 43.4% |
| ROIC | 8.8% | 16.1% |
| P/E | 35.0 | 34.1 |
| P/B | 5.12 | 14.82 |
| Current Ratio | 1.56 | 1.00 |
| Quick Ratio | 1.03 | 0.66 |
| D/E | 0.52 | 2.22 |
| Debt-to-Assets | 26.1% | 18.2% |
| Interest Coverage | 41.7 | 4.8 |
| Asset Turnover | 0.68 | 1.61 |
| Fixed Asset Turnover | 3.96 | 9.01 |
| Payout ratio | 43.6% | 5.5% |
| Dividend yield | 1.25% | 0.16% |
| Fiscal Year | 2025 | 2025 |
Efficiency & Valuation Duel: The Vital Signs
Ratios act as a company’s DNA, exposing hidden risks and operational strengths that shape long-term investor outcomes.
TE Connectivity Ltd.
TE Connectivity shows solid profitability with a 14.6% ROE and healthy 10.8% net margin, signaling efficient operations. However, its valuation appears stretched, with a P/E of 35 and P/B above 5. The company balances shareholder returns with a modest 1.25% dividend yield, supporting growth through steady R&D investment.
Jabil Inc.
Jabil delivers a striking 43.4% ROE but struggles with a low 2.2% net margin, highlighting margin pressure despite high capital efficiency. Its P/E near 34 and elevated P/B of 14.8 mark it expensive relative to earnings quality. Minimal dividend yield (0.16%) suggests reinvestment aims at growth amid operational challenges.
Premium Valuation vs. Operational Safety
TE Connectivity offers a safer operational profile with balanced profitability and modest risk, while Jabil’s high ROE masks thin margins and financial leverage. Investors prioritizing stable returns and moderate risk lean toward TE; those seeking aggressive growth under higher risk may prefer Jabil’s profile.
Which one offers the Superior Shareholder Reward?
TE Connectivity Ltd. (TEL) and Jabil Inc. (JBL) have contrasting shareholder reward strategies. TEL delivers a steady dividend yield near 1.6% with a moderate payout ratio around 24%, supported by strong free cash flow (FCF) coverage above 80%. Its disciplined buyback program adds meaningful value. JBL, with a negligible dividend yield under 0.4% and payout below 6%, prioritizes reinvestment, but suffers thin FCF conversion and weaker operating margins. Despite JBL’s aggressive leverage and high asset turnover, TEL’s balanced dividend and buyback approach offers a more sustainable, superior total return profile for 2026 investors. I favor TEL for consistent income and capital return backed by robust cash flows.
Comparative Score Analysis: The Strategic Profile
The radar chart reveals the fundamental DNA and trade-offs of TE Connectivity Ltd. and Jabil Inc., highlighting their financial strengths and weaknesses across key metrics:
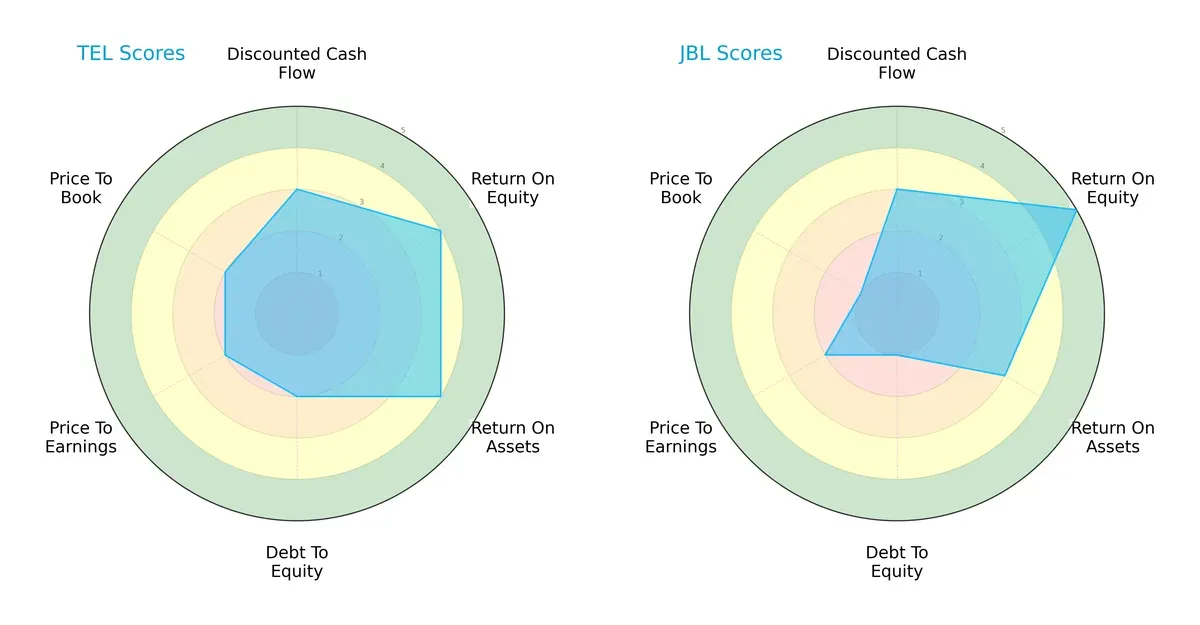
Both companies score equally on overall and discounted cash flow metrics, signaling moderate valuation and cash flow outlooks. Jabil excels in return on equity (5 vs. 4) but lags in debt-to-equity (1 vs. 2) and price-to-book scores (1 vs. 2), indicating higher financial risk and less favorable valuation. TE Connectivity presents a more balanced profile with solid returns and moderate leverage, while Jabil relies heavily on superior equity returns, accepting greater financial risk.
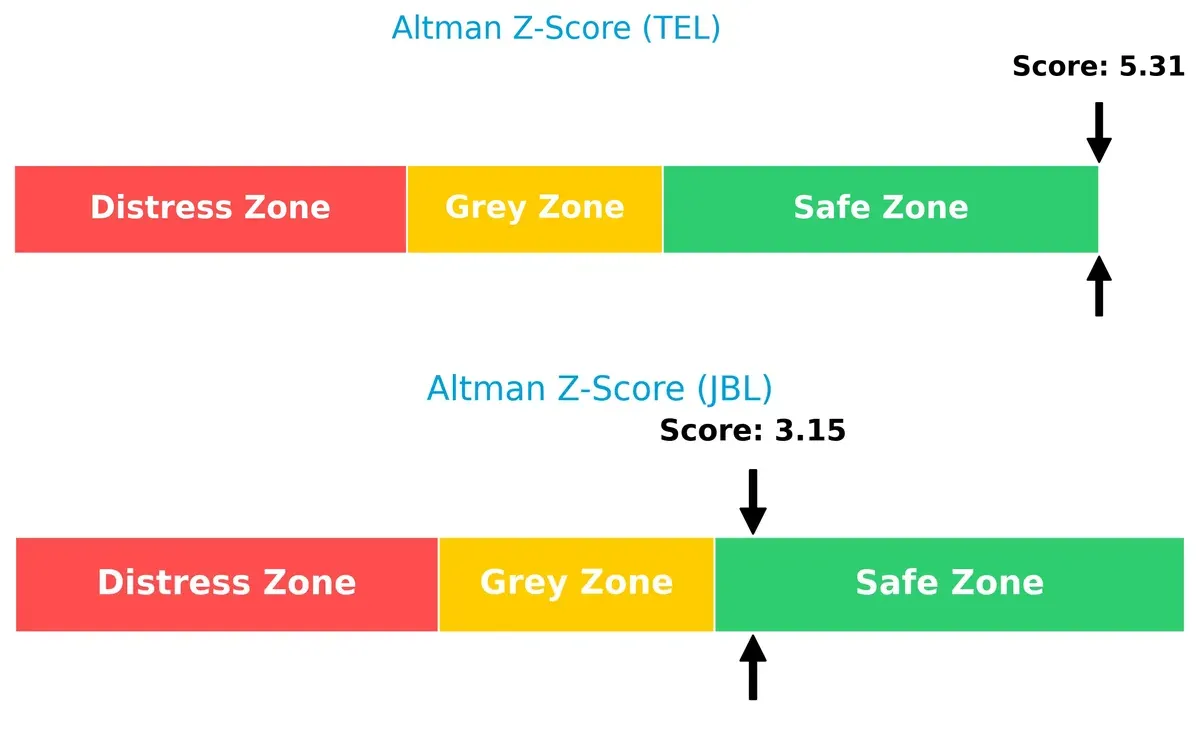
Bankruptcy Risk: Solvency Showdown
TE Connectivity’s Altman Z-Score of 5.3 significantly outpaces Jabil’s 3.15, both safely above the distress threshold but indicating TE’s stronger solvency and lower bankruptcy risk in this cycle:
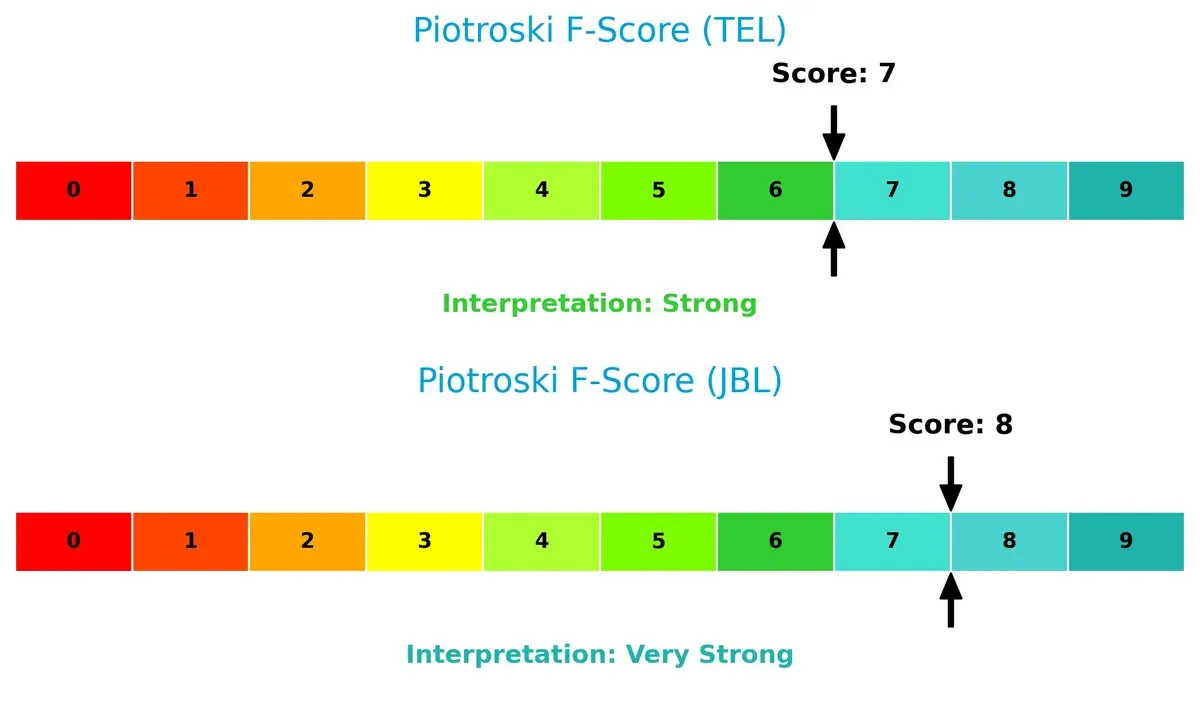
Financial Health: Quality of Operations
Jabil’s Piotroski F-Score of 8 edges out TE Connectivity’s 7, placing it in very strong financial health territory. Both firms show robust operational quality, but TE’s slightly lower score flags minor internal efficiency gaps compared to Jabil:
How are the two companies positioned?
This section dissects TEL and JBL’s operational DNA by comparing their revenue distribution across segments and analyzing internal strengths and weaknesses. The goal is to confront their economic moats and identify which model offers the most resilient, sustainable competitive advantage today.
Revenue Segmentation: The Strategic Mix
This comparison dissects how TE Connectivity Ltd. and Jabil Inc. diversify their income streams and reveals where each places its primary sector bets:
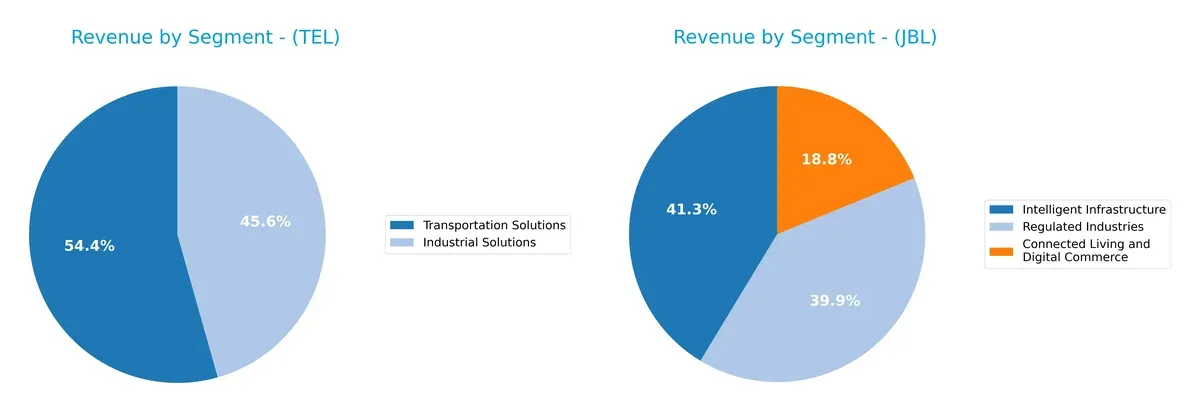
TE Connectivity leans heavily on Transportation Solutions at $9.39B and Industrial Solutions at $7.87B, showing moderate diversification. Jabil, however, balances revenues across Intelligent Infrastructure ($12.32B), Regulated Industries ($11.88B), and Connected Living ($5.61B), revealing a broader portfolio. TE’s concentration in transportation signals reliance on infrastructure dominance but raises concentration risks. Jabil’s spread suggests ecosystem lock-in with diversified market exposure, reducing sector-specific volatility.
Strengths and Weaknesses Comparison
This table compares the Strengths and Weaknesses of TE Connectivity Ltd. (TEL) and Jabil Inc. (JBL):
TEL Strengths
- Strong diversification across Industrial and Transportation Solutions
- Favorable net margin at 10.78%
- Solid liquidity with current ratio of 1.56
- Low debt-to-assets ratio at 26.12%
- High interest coverage at 42.61
- Balanced global revenue distribution including China and U.S.
JBL Strengths
- High profitability with ROE of 43.42% and ROIC of 16.06%
- Favorable asset turnover and fixed asset turnover
- Broad geographic footprint including Mexico and Singapore
- Diverse product segments in Intelligent Infrastructure and Regulated Industries
- Consistent revenue growth in DMS and EMS segments
- Favorable debt-to-assets ratio at 18.15%
TEL Weaknesses
- Unfavorable valuation multiples: PE 35.0 and PB 5.12
- Neutral ROIC below WACC indicating moderate capital efficiency
- Moderate debt-to-equity ratio of 0.52
- Neutral return on equity at 14.64%
- Asset turnover relatively low at 0.68
- Limited product innovation details
JBL Weaknesses
- Low net margin at 2.2% signaling weak profitability
- Unfavorable high PB ratio of 14.82
- Low quick ratio of 0.66 indicating liquidity risk
- High debt-to-equity ratio of 2.22
- Dividend yield very low at 0.16%
- Unfavorable valuation multiples with PE 34.14
Overall, TEL shows strength in operational liquidity and moderate profitability with a well-diversified product and geographic base. JBL excels in high capital returns but struggles with low net margin and liquidity concerns. Each company’s financial profile suggests differing strategic priorities between maintaining stable operations and maximizing capital efficiency.
The Moat Duel: Analyzing Competitive Defensibility
A structural moat shields long-term profits from competition’s relentless erosion. Without it, market share and margins inevitably decline:
TE Connectivity Ltd.: Intangible Asset Moat
TE Connectivity leverages specialized connectivity solutions and global scale. Despite its solid margins, declining ROIC signals weakening capital efficiency. New markets may challenge its moat in 2026.
Jabil Inc.: Operational Efficiency Moat
Jabil’s cost advantage through scale and manufacturing expertise contrasts with TE’s asset-heavy model. Its growing ROIC underscores improving profitability and durable value creation. Expansion in electronics manufacturing supports moat strengthening.
Capital Efficiency vs. Cost Leadership: Who Defends Better?
Jabil boasts the deeper moat with ROIC surpassing WACC by nearly 7%, showing value creation and rising profitability. TE Connectivity’s declining ROIC warns of eroding competitive advantage. Jabil appears better positioned to defend market share in 2026.
Which stock offers better returns?
The past year shows strong gains for both stocks, with TE Connectivity Ltd. slowing recently while Jabil Inc. accelerates, reflecting divergent trading momentum and buyer dominance.
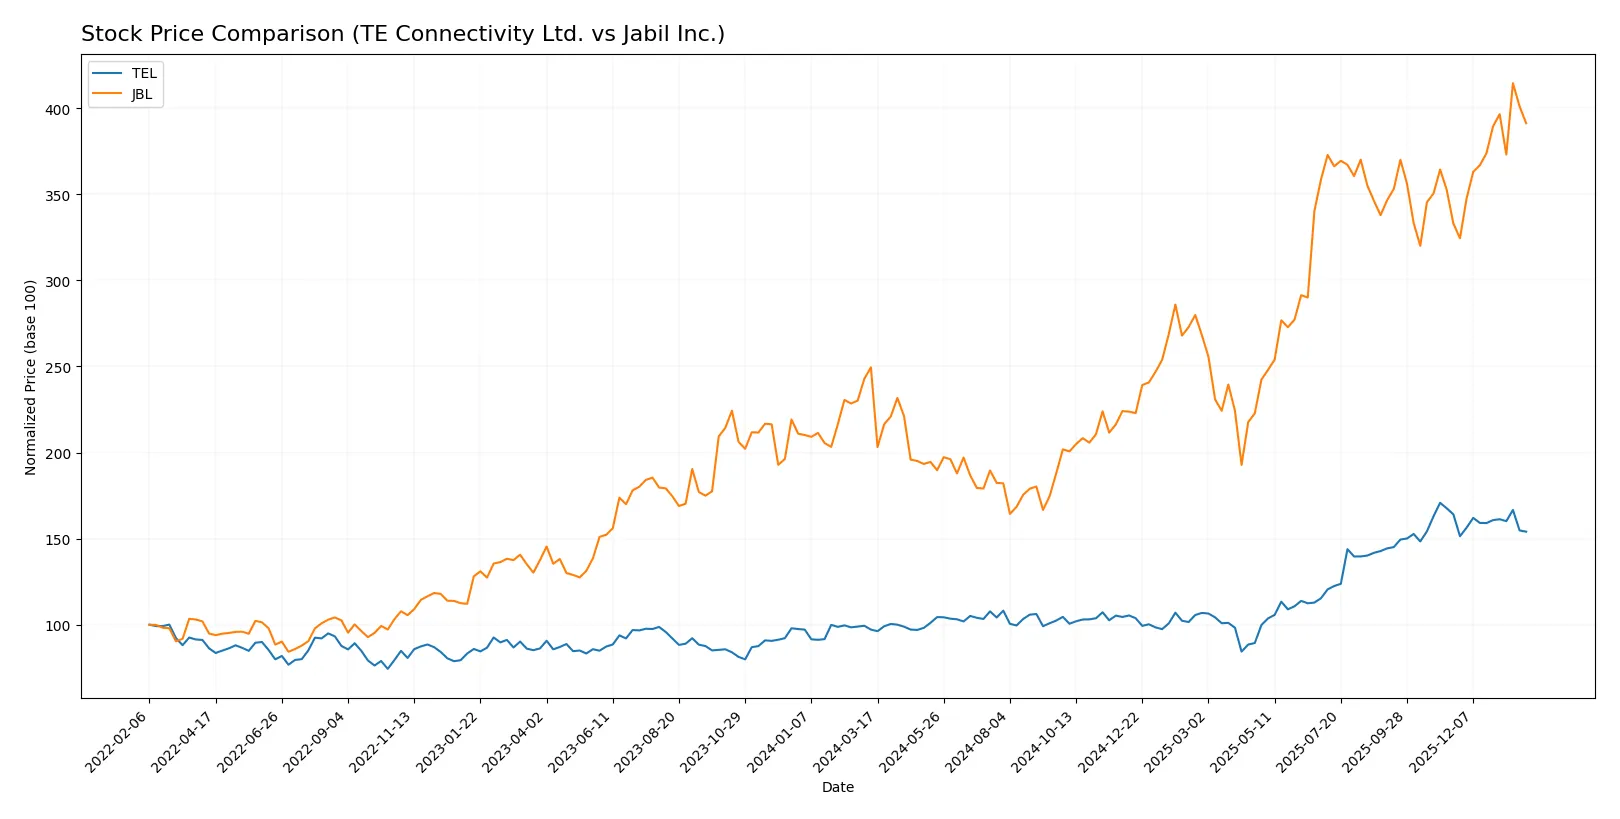
Trend Comparison
TE Connectivity Ltd. rose 58.53% over 12 months, indicating a bullish trend with decelerating momentum. The stock peaked at 247 and hit a low of 122, showing high volatility (std dev 34.24). Recent months reveal a slight 6.13% decline.
Jabil Inc. gained 56.83% over the same period, maintaining a bullish trend with accelerating momentum. It ranged from 99.62 to 251.29, showing higher volatility (std dev 44.31). Recently, it surged 17.5%, supported by strong buyer dominance.
Jabil’s recent acceleration and higher gain suggest it outperformed TE Connectivity in market returns despite both delivering robust annual growth.
Target Prices
Analysts present moderately optimistic target price consensus for TE Connectivity Ltd. and Jabil Inc.
| Company | Target Low | Target High | Consensus |
|---|---|---|---|
| TE Connectivity Ltd. | 238 | 306 | 270.29 |
| Jabil Inc. | 244 | 283 | 267.25 |
Both companies have consensus targets roughly 14-22% above current prices, indicating analysts expect solid upside amid sector cyclicality and ongoing demand for hardware and connectivity solutions.

Don’t Let Luck Decide Your Entry Point
Optimize your entry points with our advanced ProRealTime indicators. You’ll get efficient buy signals with precise price targets for maximum performance. Start outperforming now!
How do institutions grade them?
The following tables summarize recent institutional grades for TE Connectivity Ltd. and Jabil Inc.:
TE Connectivity Ltd. Grades
This table presents the latest grades from major financial institutions for TE Connectivity Ltd.
| Grading Company | Action | New Grade | Date |
|---|---|---|---|
| Oppenheimer | Upgrade | Outperform | 2026-01-27 |
| Barclays | Maintain | Overweight | 2026-01-23 |
| Truist Securities | Maintain | Hold | 2026-01-22 |
| Wells Fargo | Maintain | Equal Weight | 2026-01-22 |
| UBS | Maintain | Buy | 2026-01-14 |
Jabil Inc. Grades
This table shows recent institutional grades for Jabil Inc. from recognized grading companies.
| Grading Company | Action | New Grade | Date |
|---|---|---|---|
| UBS | Maintain | Neutral | 2025-12-18 |
| Barclays | Maintain | Overweight | 2025-12-18 |
| JP Morgan | Maintain | Overweight | 2025-12-18 |
| B of A Securities | Maintain | Buy | 2025-12-10 |
Which company has the best grades?
TE Connectivity Ltd. holds stronger recent upgrades and higher grades like Outperform and Buy. Jabil Inc. maintains steady Overweight and Buy ratings but lacks recent upgrades. This suggests TE Connectivity may attract more positive investor sentiment.
Risks specific to each company
The following categories identify critical pressure points and systemic threats facing TE Connectivity Ltd. and Jabil Inc. in the 2026 market environment:
1. Market & Competition
TE Connectivity Ltd.
- Operates globally in connectivity and sensor markets with diversified industrial segments, facing intense tech hardware competition.
Jabil Inc.
- Specializes in manufacturing services across diverse industries with heavy competition from contract manufacturers and ODMs.
2. Capital Structure & Debt
TE Connectivity Ltd.
- Maintains moderate debt-to-equity (0.52) with strong interest coverage (42.61), reflecting prudent leverage.
Jabil Inc.
- High debt-to-equity (2.22) signals elevated financial risk; interest coverage (4.66) is adequate but less robust.
3. Stock Volatility
TE Connectivity Ltd.
- Beta of 1.24 indicates moderate market sensitivity, with a price range from $116 to $250.
Jabil Inc.
- Similar beta (1.25) but wider price range $108 to $258 suggests slightly higher volatility.
4. Regulatory & Legal
TE Connectivity Ltd.
- Exposure to global regulatory environments for electronics and aerospace sectors; inherent compliance complexity.
Jabil Inc.
- Faces regulatory scrutiny across manufacturing and technology sectors, particularly in the US market.
5. Supply Chain & Operations
TE Connectivity Ltd.
- Global supply chain across 140 countries; sensitive to disruptions in raw materials and logistics.
Jabil Inc.
- Complex manufacturing supply chain with diversified services; operational risks from global sourcing and production scaling.
6. ESG & Climate Transition
TE Connectivity Ltd.
- Increasing pressure to align with sustainability standards in industrial and transportation markets.
Jabil Inc.
- Faces challenges integrating ESG in large-scale manufacturing; investors demand transparent climate strategies.
7. Geopolitical Exposure
TE Connectivity Ltd.
- Swiss base and global sales expose it to currency fluctuations and trade policy risks.
Jabil Inc.
- US headquarters with global operations; vulnerable to trade tensions and supply chain disruptions.
Which company shows a better risk-adjusted profile?
TE Connectivity’s strongest risk lies in competitive pressure amid high valuation multiples. Jabil’s principal risk stems from its elevated financial leverage and weaker liquidity ratios. TE Connectivity’s prudent capital structure and higher Altman Z-score (5.3 vs. 3.15) indicate a safer financial footing. Jabil’s very strong Piotroski score (8) signals operational strength but is offset by debt concerns. Overall, TE Connectivity offers a better risk-adjusted profile, supported by robust interest coverage and stable liquidity amid market uncertainties.
Final Verdict: Which stock to choose?
TE Connectivity Ltd. (TEL) stands out as a cash-generating powerhouse with a solid liquidity cushion and operational efficiency. However, its declining return on invested capital signals a point of vigilance. TEL suits investors aiming for steady income and moderate growth within resilient industrial sectors.
Jabil Inc. (JBL) impresses with a durable competitive moat driven by improving profitability and robust capital returns. Despite higher leverage and weaker short-term liquidity, JBL offers stronger growth potential and operational momentum. It aligns well with investors seeking growth at a reasonable price and willing to tolerate higher financial risk.
If you prioritize capital preservation and steady cash flow, TEL is the compelling choice due to its favorable liquidity and operational metrics. However, if you seek growth backed by improving returns and can withstand elevated leverage, JBL offers better stability in profitability and commands a premium growth profile. Both analytical scenarios require close monitoring of their distinct risk factors.
Disclaimer: Investment carries a risk of loss of initial capital. The past performance is not a reliable indicator of future results. Be sure to understand risks before making an investment decision.
Go Further
I encourage you to read the complete analyses of TE Connectivity Ltd. and Jabil Inc. to enhance your investment decisions: