Home > Comparison > Technology > JBL vs SANM
The strategic rivalry between Jabil Inc. and Sanmina Corporation shapes the evolution of the Technology sector’s hardware manufacturing landscape. Jabil, a capital-intensive electronics manufacturing services leader, contrasts with Sanmina’s integrated manufacturing solutions and specialized component focus. This analysis explores their divergent operational models and capital allocation strategies. I aim to identify which company delivers superior risk-adjusted returns for investors seeking durable exposure in this competitive industry.

Table of contents
Companies Overview
Jabil Inc. and Sanmina Corporation stand as crucial players in the global electronics manufacturing sector, shaping hardware production and supply chains.
Jabil Inc.: Global Electronics Manufacturing Powerhouse
Jabil Inc. dominates the manufacturing services industry through its Electronics Manufacturing Services (EMS) and Diversified Manufacturing Services segments. Its core revenue stems from electronics design, production, and product management, serving sectors like 5G, automotive, and healthcare. In 2026, Jabil sharpens its strategic focus on integrating advanced design validation and rapid prototyping to enhance product innovation and speed to market.
Sanmina Corporation: Integrated Manufacturing Solutions Leader
Sanmina Corporation excels in integrated manufacturing solutions, combining product design, assembly, and after-market services worldwide. It generates revenue by delivering complex components and systems to OEMs in industrial, medical, defense, and cloud industries. The company’s 2026 strategy emphasizes expanding its cloud-based manufacturing execution software and precision machining capabilities to boost operational efficiency and customer customization.
Strategic Collision: Similarities & Divergences
Both companies target advanced manufacturing but diverge in approach: Jabil prioritizes broad electronics design and rapid prototyping, while Sanmina focuses on integrated solutions with strong cloud software integration. Their primary battleground lies in winning OEM contracts across high-tech sectors. Jabil’s expansive scale contrasts with Sanmina’s specialized niche, creating distinct investment profiles shaped by scale versus targeted innovation.
Income Statement Comparison
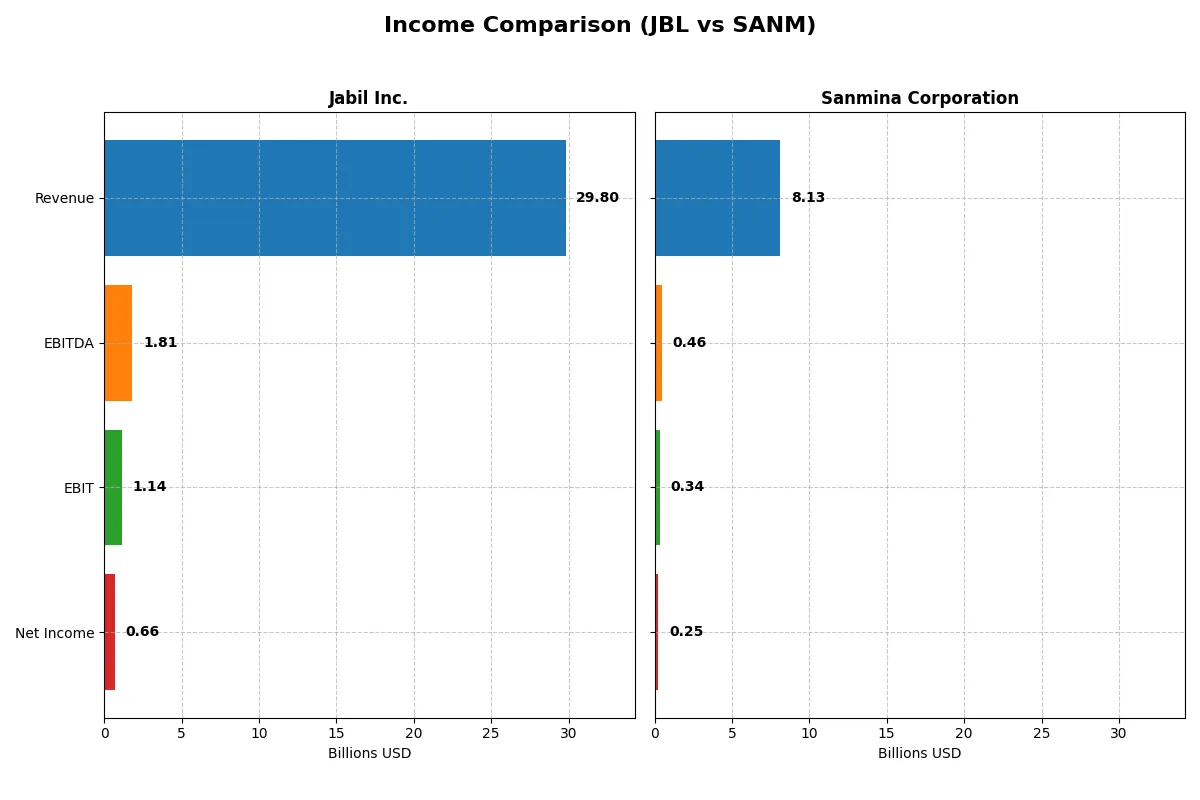
The following data dissects the core profitability and scalability of both corporate engines to reveal who dominates the bottom line:
| Metric | Jabil Inc. (JBL) | Sanmina Corporation (SANM) |
|---|---|---|
| Revenue | 29.8B | 8.13B |
| Cost of Revenue | 27.2B | 7.41B |
| Operating Expenses | 1.46B | 362M |
| Gross Profit | 2.65B | 716M |
| EBITDA | 1.81B | 463M |
| EBIT | 1.14B | 344M |
| Interest Expense | 244M | 4.3M |
| Net Income | 657M | 246M |
| EPS | 6.00 | 4.56 |
| Fiscal Year | 2025 | 2025 |
Income Statement Analysis: The Bottom-Line Duel
This income statement comparison reveals which company runs a more efficient and financially sound operation under current market conditions.
Jabil Inc. Analysis
Jabil’s revenue shows a mild 3.2% growth in 2025, but net income plunged by 54%, signaling deteriorating profitability. The gross margin holds steady near 8.9%, yet EBIT and net margins fell sharply. Its operational efficiency weakened, with expenses rising faster than revenue, indicating pressure on core profitability.
Sanmina Corporation Analysis
Sanmina’s revenue rose 7.4% in 2025, outpacing Jabil’s growth, while net income grew modestly by 2.9%. Gross margin improved to 8.8%, and EBIT margin remained stable around 4.2%. Despite slight EBIT decline, Sanmina’s EPS rose 14%, reflecting better cost control and operational momentum compared to its peer.
Margin Resilience vs. Revenue Growth
Sanmina delivers stronger revenue growth and improves EPS, showing superior operational discipline and shareholder value creation. Jabil struggles with declining profitability despite stable revenues, signaling margin compression risks. For investors, Sanmina’s profile suggests a more attractive blend of growth and margin resilience in this sector.
Financial Ratios Comparison
These vital ratios act as a diagnostic tool to expose the underlying fiscal health, valuation premiums, and capital efficiency of the companies compared below:
| Ratios | Jabil Inc. (JBL) | Sanmina Corporation (SANM) |
|---|---|---|
| ROE | 43.4% | 10.4% |
| ROIC | 16.1% | 9.0% |
| P/E | 34.1 | 25.6 |
| P/B | 14.8 | 2.7 |
| Current Ratio | 1.00 | 1.72 |
| Quick Ratio | 0.66 | 1.02 |
| D/E | 2.22 | 0.17 |
| Debt-to-Assets | 18.2% | 6.7% |
| Interest Coverage | 4.8 | 82.5 |
| Asset Turnover | 1.61 | 1.39 |
| Fixed Asset Turnover | 9.01 | 11.9 |
| Payout Ratio | 5.5% | 0% |
| Dividend Yield | 0.16% | 0% |
| Fiscal Year | 2025 | 2025 |
Efficiency & Valuation Duel: The Vital Signs
Financial ratios serve as a company’s DNA, exposing operational strengths and hidden risks critical for investment insight.
Jabil Inc.
Jabil posts a robust 43.4% ROE and a strong 16.1% ROIC, signaling efficient capital use and profitability. However, its P/E of 34.1 and P/B of 14.8 mark the stock as expensive and stretched. Minimal dividend yield at 0.16% reflects a preference for reinvestment over shareholder payouts, likely funding growth or debt reduction.
Sanmina Corporation
Sanmina shows moderate profitability with a 10.5% ROE and 9.0% ROIC, reflecting neutral efficiency. Valuation metrics are more reasonable; a P/E of 25.6 and P/B of 2.7 suggest fair pricing. The company pays no dividends, focusing instead on maintaining a strong balance sheet and operational stability, evident in its favorable current and quick ratios.
Premium Valuation vs. Operational Safety
Jabil offers higher profitability but at a premium price and stretched valuation. Sanmina provides a more balanced risk profile with moderate returns and solid liquidity. Investors seeking growth with tolerance for valuation risk may lean toward Jabil, while those prioritizing financial stability may prefer Sanmina.
Which one offers the Superior Shareholder Reward?
Jabil Inc. (JBL) pays a modest dividend yield of 0.16% with a low payout ratio near 5.5%, supported by strong free cash flow coverage above 70%. Its buyback activity is moderate but consistent, enhancing shareholder returns. Sanmina Corporation (SANM) forgoes dividends entirely, opting to reinvest 100% of free cash flow into growth and acquisitions, with a higher free cash flow conversion near 76%. SANM’s capital allocation prioritizes expansion over immediate income. I see JBL’s balanced approach of dividends plus buybacks as more sustainable in 2026, offering a clearer path to total shareholder return, while SANM’s reinvestment strategy carries more execution risk despite growth potential. For investors prioritizing steady reward and risk mitigation, JBL presents the superior total return profile today.
Comparative Score Analysis: The Strategic Profile
The radar chart reveals the core financial DNA and trade-offs of Jabil Inc. and Sanmina Corporation side by side:
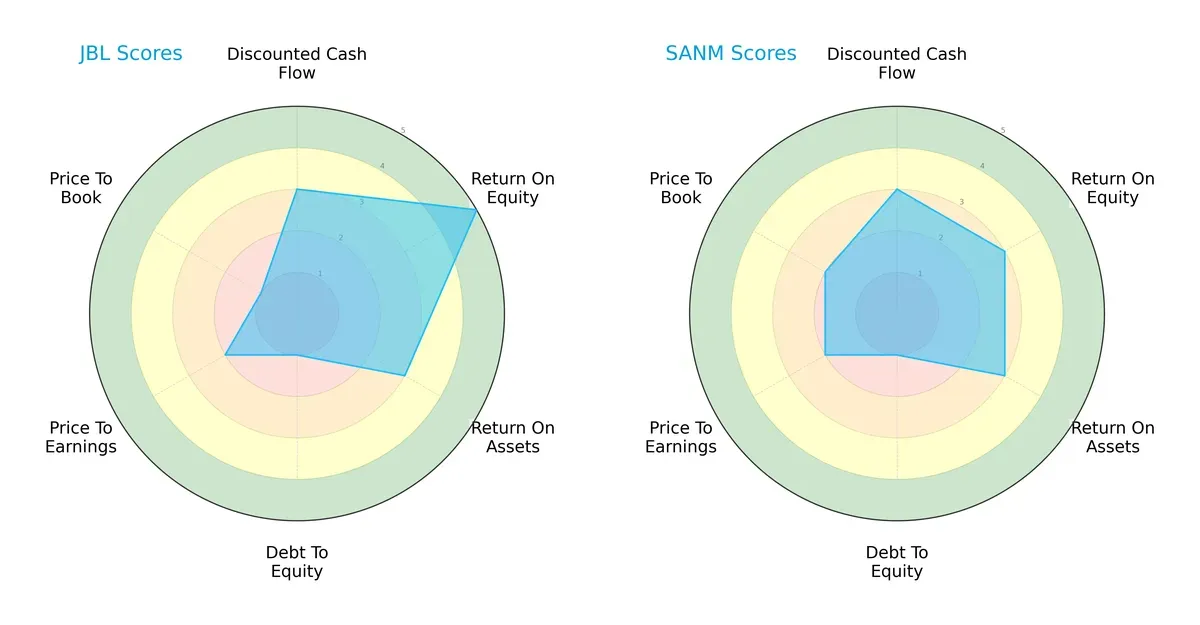
Jabil shows a stronger return on equity (5 vs. 3) and a more efficient asset utilization (ROA both moderate at 3). Both firms share weak debt-to-equity scores (1), signaling high leverage risk. Jabil’s valuation metrics (P/E 2 vs. 2, P/B 1 vs. 2) suggest it trades cheaper on book value but with slightly more risk. Overall, Jabil presents a more unbalanced profile relying on superior profitability, while Sanmina offers a steadier but less differentiated financial footprint.
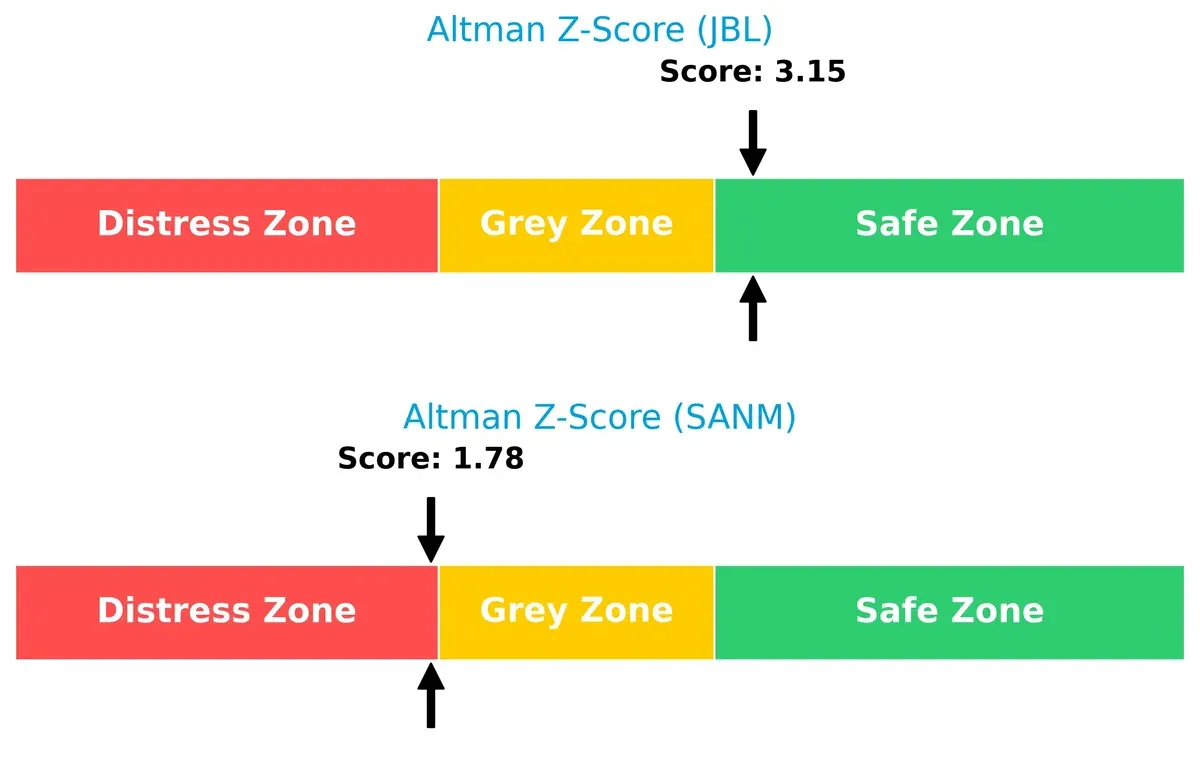
Bankruptcy Risk: Solvency Showdown
Jabil’s Altman Z-Score of 3.15 places it safely above the distress threshold, indicating strong long-term survival prospects. Sanmina’s 1.78 score signals elevated bankruptcy risk, hovering in the distress zone due to financial weakness:
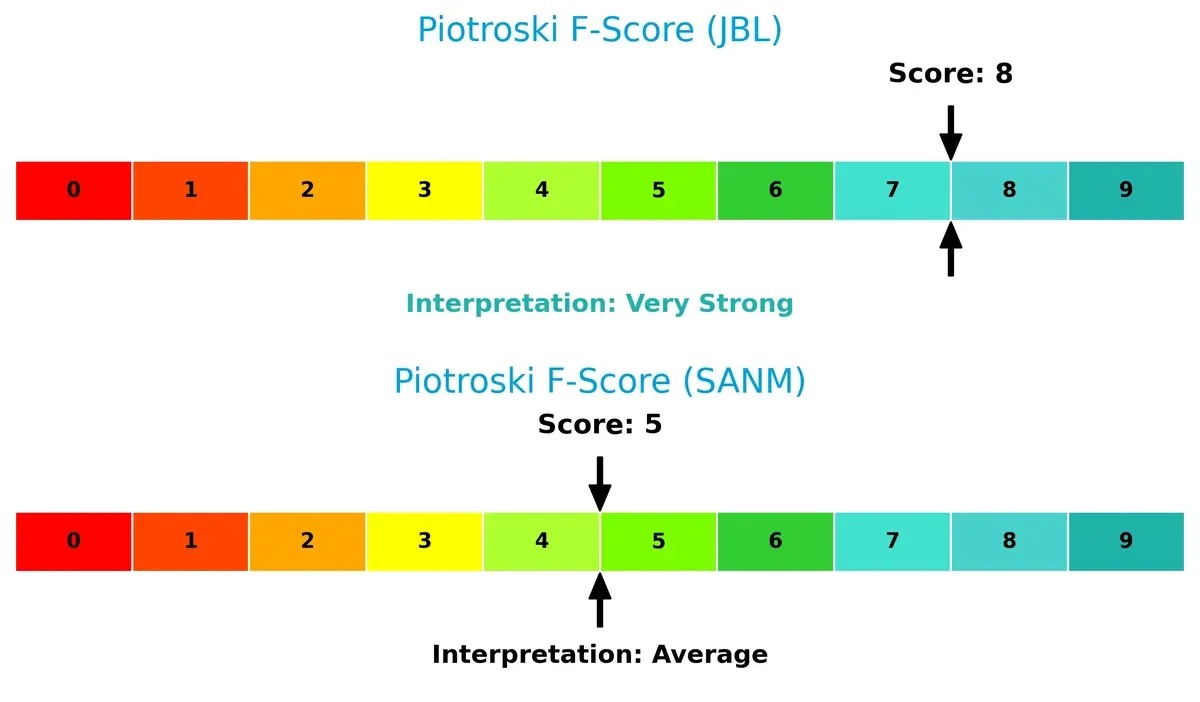
Financial Health: Quality of Operations
Jabil’s Piotroski F-Score of 8 reflects robust financial health and operational quality, signaling very strong internal metrics. Sanmina’s moderate score of 5 suggests average financial strength with some red flags to monitor:
How are the two companies positioned?
This section dissects JBL and SANM’s operational DNA by comparing revenue distribution and internal strengths and weaknesses. The ultimate goal is to confront their economic moats to reveal which model delivers the most resilient, sustainable competitive advantage today.
Revenue Segmentation: The Strategic Mix
This visual comparison dissects how Jabil Inc. and Sanmina Corporation diversify their income streams and where their primary sector bets lie:
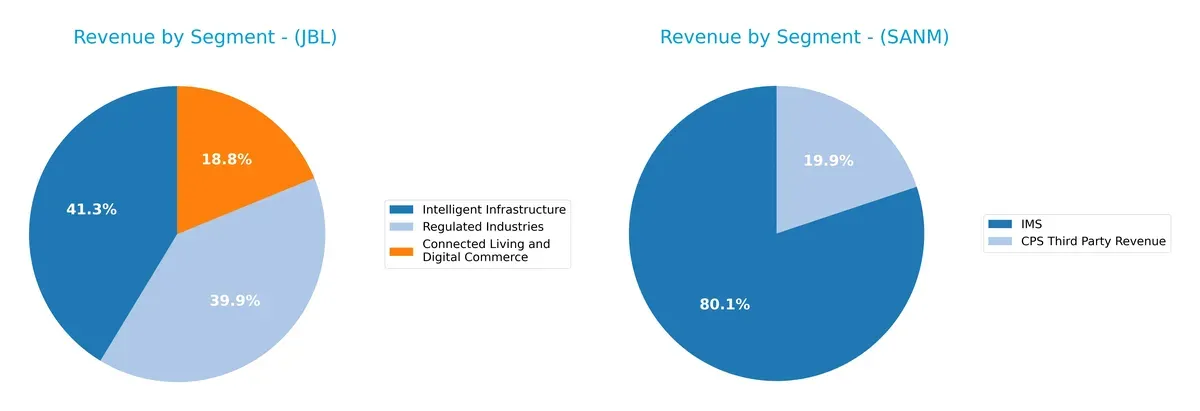
Jabil Inc. anchors its revenue in three near-equal segments: Intelligent Infrastructure (12.3B), Regulated Industries (11.9B), and Connected Living (5.6B), showcasing strong diversification across complex markets. Sanmina leans heavily on IMS (6.5B) with CPS Third Party revenue (1.6B) trailing far behind, indicating concentration risk but also focused expertise in manufacturing services. Jabil’s broader base lessens volatility, while Sanmina’s reliance on IMS demands operational excellence to sustain growth.
Strengths and Weaknesses Comparison
This table compares the strengths and weaknesses of Jabil Inc. and Sanmina Corporation:
Jabil Inc. Strengths
- Diverse product segments across Connected Living, Intelligent Infrastructure, and Regulated Industries
- Strong ROE at 43.42% and ROIC at 16.06%, both favorable
- High asset turnover metrics indicating efficient use of assets
Sanmina Corporation Strengths
- Favorable current and quick ratios signal strong liquidity
- Low debt-to-equity and debt-to-assets ratios reflect conservative leverage
- High interest coverage ratio at 80.01 suggests robust earnings to cover debt
Jabil Inc. Weaknesses
- Low net margin of 2.2% and unfavorable P/E and P/B ratios indicate valuation concerns
- Quick ratio at 0.66 and debt-to-equity of 2.22 raise liquidity and leverage flags
- Dividend yield is minimal at 0.16%
Sanmina Corporation Weaknesses
- Net margin is low at 3.03% and P/E ratio remains unfavorable
- Zero dividend yield may deter income-focused investors
- ROE and ROIC are neutral, showing moderate profitability
Jabil shows strength in profitability and asset efficiency but faces liquidity and valuation challenges. Sanmina demonstrates solid financial stability and leverage management but has modest profitability and lacks shareholder yield. Both companies’ profiles suggest distinct strategic focuses and risk considerations.
The Moat Duel: Analyzing Competitive Defensibility
A structural moat is the sole protector of long-term profits against relentless competitive erosion. Let’s dissect the moats of Jabil Inc. and Sanmina Corporation:
Jabil Inc.: Operational Efficiency and Scale Moat
Jabil’s primary moat stems from its cost advantage and scale in electronics manufacturing. This manifests in a ROIC exceeding WACC by nearly 7%, signaling durable value creation. Expansion into high-growth sectors like 5G and automotive deepens this moat in 2026.
Sanmina Corporation: Niche Integration Moat
Sanmina leverages integrated manufacturing solutions as its moat, contrasting Jabil’s scale focus. However, its ROIC barely exceeds WACC and trends downward, suggesting weakening profitability. Opportunities in cloud manufacturing may offer growth but remain unproven in 2026.
Verdict: Scale-Driven Cost Leadership vs. Integration Complexity
Jabil commands a wider, deeper moat with strong ROIC growth and efficient capital use. Sanmina’s shrinking ROIC signals vulnerability. Jabil stands better equipped to defend and expand its market share amidst competitive pressures.
Which stock offers better returns?
Over the past year, both Jabil Inc. and Sanmina Corporation showed strong price gains, with notable shifts in momentum and contrasting recent trading dynamics.
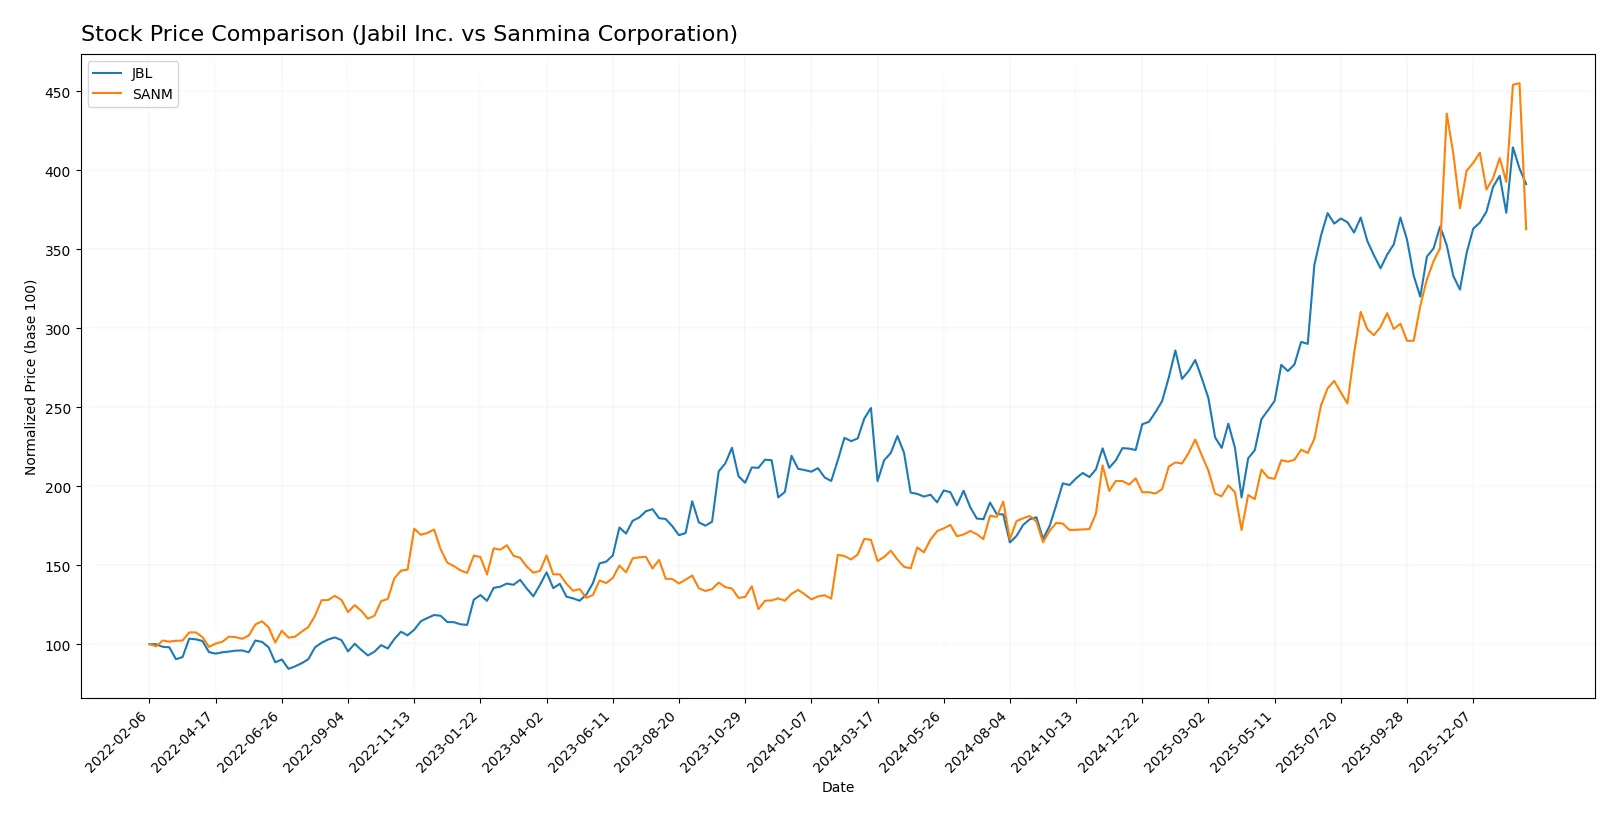
Trend Comparison
Jabil Inc. (JBL) posted a 56.8% price increase over 12 months, marking a bullish trend with accelerating gains and a high volatility of 44.3%. The stock hit a peak at 251.29 and a low of 99.62.
Sanmina Corporation (SANM) more than doubled, rising 118.4% over the same period, representing a bullish but decelerating trend. Volatility was lower at 31.8%, with a highest price of 177.83 and lowest at 57.79.
Comparing recent trends, JBL accelerated with a 17.5% gain, while SANM declined 11.7%. Sanmina’s overall return exceeds Jabil’s, but recent momentum favors Jabil.
Target Prices
Analysts present a confident target consensus for Jabil Inc. and Sanmina Corporation.
| Company | Target Low | Target High | Consensus |
|---|---|---|---|
| Jabil Inc. | 244 | 283 | 267.25 |
| Sanmina Corporation | 200 | 200 | 200 |
The target consensus suggests upside potential for both companies versus current prices. Jabil’s consensus target of 267.25 exceeds its 237.19 stock price, while Sanmina’s 200 target strongly surpasses its 141.68 price, indicating bullish analyst expectations.

Don’t Let Luck Decide Your Entry Point
Optimize your entry points with our advanced ProRealTime indicators. You’ll get efficient buy signals with precise price targets for maximum performance. Start outperforming now!
How do institutions grade them?
Jabil Inc. Grades
This table summarizes recent institutional grades for Jabil Inc.
| Grading Company | Action | New Grade | Date |
|---|---|---|---|
| UBS | Maintain | Neutral | 2025-12-18 |
| Barclays | Maintain | Overweight | 2025-12-18 |
| JP Morgan | Maintain | Overweight | 2025-12-18 |
| B of A Securities | Maintain | Buy | 2025-12-10 |
| B of A Securities | Maintain | Buy | 2025-09-26 |
| Barclays | Maintain | Overweight | 2025-09-26 |
| JP Morgan | Maintain | Overweight | 2025-07-17 |
| B of A Securities | Maintain | Buy | 2025-06-20 |
| UBS | Maintain | Neutral | 2025-06-18 |
| B of A Securities | Maintain | Buy | 2025-06-18 |
Sanmina Corporation Grades
This table summarizes recent institutional grades for Sanmina Corporation.
| Grading Company | Action | New Grade | Date |
|---|---|---|---|
| Argus Research | Maintain | Buy | 2026-01-28 |
| B of A Securities | Maintain | Neutral | 2025-07-11 |
| B of A Securities | Maintain | Neutral | 2025-06-09 |
| B of A Securities | Upgrade | Neutral | 2025-01-29 |
| Craig-Hallum | Maintain | Hold | 2024-11-05 |
Which company has the best grades?
Jabil Inc. consistently receives higher grades, with multiple “Buy” and “Overweight” ratings. Sanmina’s grades mostly range from “Neutral” to “Hold.” Investors may view Jabil’s stronger grades as reflecting greater confidence from analysts.
Risks specific to each company
The following categories identify the critical pressure points and systemic threats facing both firms in the 2026 market environment:
1. Market & Competition
Jabil Inc.
- Faces intense competition in diverse manufacturing services, requiring constant innovation to maintain market share.
Sanmina Corporation
- Competes in integrated manufacturing solutions with focus on niche sectors like defense, possibly limiting broad market exposure.
2. Capital Structure & Debt
Jabil Inc.
- High debt-to-equity ratio of 2.22 signals elevated financial risk and leverage concerns.
Sanmina Corporation
- Low debt-to-equity ratio of 0.17 indicates conservative leverage and stronger balance sheet stability.
3. Stock Volatility
Jabil Inc.
- Beta at 1.246 shows higher sensitivity to market swings and greater volatility risk.
Sanmina Corporation
- Beta of 1.049 suggests moderate volatility, closer to the market average and lower risk.
4. Regulatory & Legal
Jabil Inc.
- Operates globally with exposure to complex electronics and manufacturing regulations, increasing compliance risks.
Sanmina Corporation
- Broad exposure including defense and aerospace raises potential regulatory scrutiny and contract compliance challenges.
5. Supply Chain & Operations
Jabil Inc.
- Large scale and diverse operations create supply chain complexity and vulnerability to global disruptions.
Sanmina Corporation
- Smaller scale may allow more agile supply chain management but exposes risks in specialized sectors.
6. ESG & Climate Transition
Jabil Inc.
- Must address environmental impact in diverse manufacturing, with pressure to meet evolving ESG standards.
Sanmina Corporation
- Faces ESG challenges in defense and aerospace sectors, where climate transition demands are rising.
7. Geopolitical Exposure
Jabil Inc.
- Global footprint subjects it to geopolitical risks including trade tensions and tariffs impacting supply chains.
Sanmina Corporation
- Exposure to sensitive industries like defense heightens risks from geopolitical shifts and export controls.
Which company shows a better risk-adjusted profile?
Sanmina’s strongest advantage lies in its conservative capital structure and superior liquidity ratios, mitigating financial distress risk. Jabil carries greater leverage and stock volatility, which elevates its risk profile. Sanmina’s Altman Z-Score near the distress zone demands caution, yet its lower debt and operational focus provide resilience. Jabil’s high ROE contrasts with weaker liquidity and balance sheet metrics, signaling risk amid growth. Overall, Sanmina presents a better risk-adjusted profile despite some operational concentration risks.
Final Verdict: Which stock to choose?
Jabil Inc. (JBL) commands attention with its robust capital efficiency and growing economic moat, signaling durable competitive advantage. Its superpower lies in consistently delivering high returns on invested capital, though its leverage and liquidity ratios remain points of vigilance. JBL suits investors targeting aggressive growth with a tolerance for financial risk.
Sanmina Corporation (SANM) offers a strategic moat rooted in strong balance sheet stability and operational resilience. It benefits from a conservative debt profile and superior liquidity, providing better safety compared to JBL. SANM fits well within a GARP (Growth at a Reasonable Price) portfolio seeking moderate growth with steadier financial footing.
If you prioritize capital efficiency and growth momentum, JBL is the compelling choice due to its superior ROIC expansion and market acceleration. However, if you seek financial stability and lower risk exposure, SANM offers better stability with its conservative leverage and liquidity profile. Both present distinct analytical scenarios tailored to different investor risk appetites.
Disclaimer: Investment carries a risk of loss of initial capital. The past performance is not a reliable indicator of future results. Be sure to understand risks before making an investment decision.
Go Further
I encourage you to read the complete analyses of Jabil Inc. and Sanmina Corporation to enhance your investment decisions: