Home > Comparison > Technology > SNDK vs JBL
The competitive dynamic between Sandisk Corporation and Jabil Inc. shapes the Technology sector’s hardware landscape. Sandisk leads as a specialized developer of NAND flash storage solutions, while Jabil operates as a diversified electronics manufacturing services provider. This contrast highlights a strategic race between focused product innovation and broad service integration. This analysis aims to identify which company’s trajectory delivers superior risk-adjusted returns for a diversified portfolio.
Table of contents
Companies Overview
Sandisk Corporation and Jabil Inc. both shape critical segments of the hardware and technology landscape with distinct market roles.
Sandisk Corporation: Flash Storage Pioneer
Sandisk Corporation leads as a developer and manufacturer of NAND flash-based storage devices. It generates revenue through solid state drives, embedded products, and removable storage cards. In 2026, Sandisk’s strategic focus centers on advancing flash technology innovation to maintain its competitive edge in high-performance storage solutions.
Jabil Inc.: Global Manufacturing Powerhouse
Jabil Inc. operates as a global provider of electronics manufacturing services and solutions. Its revenue stems from electronics design, production, and product management across diverse sectors like 5G, automotive, and healthcare. In 2026, Jabil emphasizes expanding its manufacturing services footprint and enhancing turnkey solutions to capture broader market demand.
Strategic Collision: Similarities & Divergences
Sandisk pursues a product-centric innovation strategy, while Jabil focuses on service-driven manufacturing flexibility. Their battlefront lies in supplying components and solutions to the evolving electronics ecosystem. Sandisk’s tech-driven moat contrasts with Jabil’s scale and operational breadth, creating distinct investment profiles shaped by innovation versus manufacturing prowess.
Income Statement Comparison
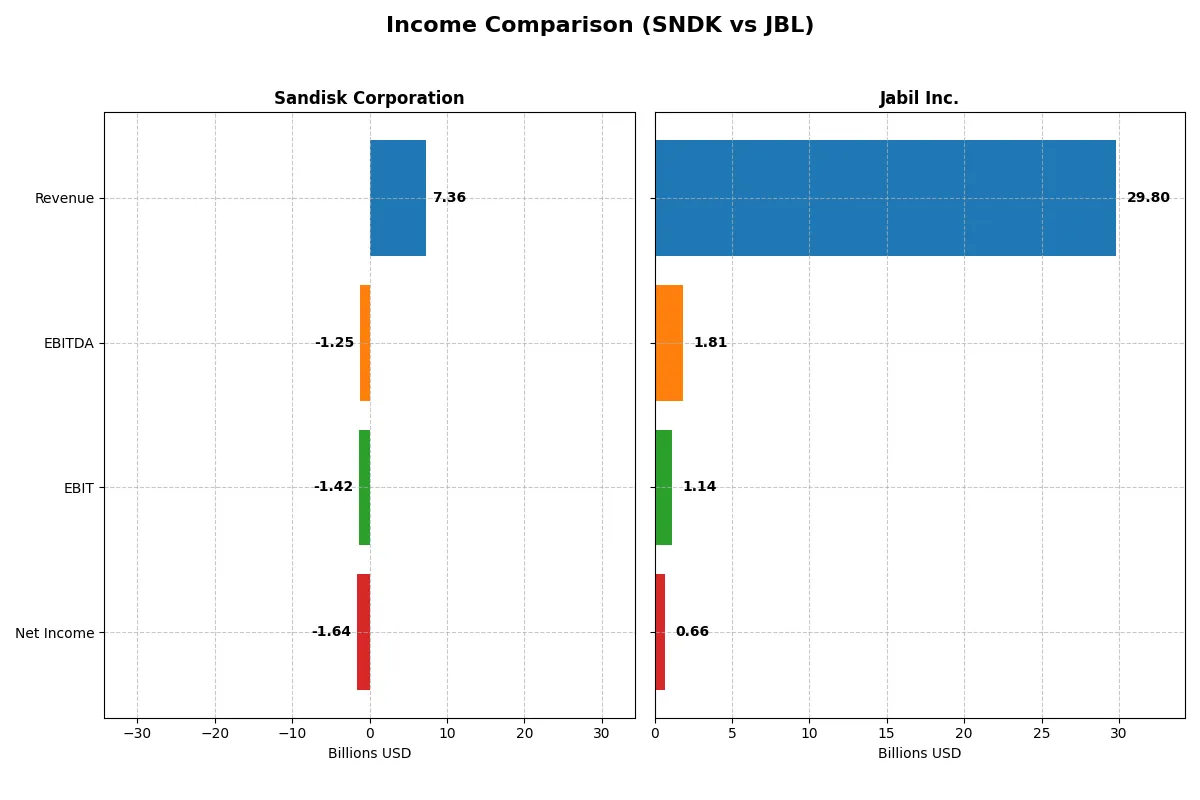
This data dissects the core profitability and scalability of both corporate engines to reveal who dominates the bottom line:
| Metric | Sandisk Corporation (SNDK) | Jabil Inc. (JBL) |
|---|---|---|
| Revenue | 7.36B | 29.80B |
| Cost of Revenue | 5.14B | 27.16B |
| Operating Expenses | 3.59B | 1.46B |
| Gross Profit | 2.21B | 2.65B |
| EBITDA | -1.25B | 1.81B |
| EBIT | -1.42B | 1.14B |
| Interest Expense | 63M | 244M |
| Net Income | -1.64B | 657M |
| EPS | -11.32 | 6.00 |
| Fiscal Year | 2025 | 2025 |
Income Statement Analysis: The Bottom-Line Duel
Comparing these income statements reveals which company transforms sales into profit most effectively, exposing their operational efficiency.
Sandisk Corporation Analysis
Sandisk’s revenue shrank 25% from 2022 to 2025, yet grew 10% last year to $7.36B. Despite a favorable 30% gross margin, it posted a steep net loss of $1.64B in 2025. Margins deteriorated overall, with negative EBIT and net margins reflecting heavy operating and other expenses eroding profits.
Jabil Inc. Analysis
Jabil’s revenue rose modestly 1.8% from 2021 to 2025, reaching $29.8B in 2025. Gross margin held steady near 9%, while EBIT and net margins remained positive but thin at 3.8% and 2.2%, respectively. The company generated $657M net income in 2025 but showed declining profitability momentum over the past year.
Margin Resilience vs. Scale Stability
Sandisk’s higher gross margin contrasts sharply with Jabil’s larger, more stable revenue base and positive net income. Sandisk struggles with heavy losses despite margin strength, while Jabil converts scale into modest profits. Investors seeking steady earnings may favor Jabil’s consistent, if unspectacular, profitability profile over Sandisk’s ongoing operational challenges.
Financial Ratios Comparison
These vital ratios act as a diagnostic tool to expose the underlying fiscal health, valuation premiums, and capital efficiency of the companies analyzed:
| Ratios | Sandisk Corporation (SNDK) | Jabil Inc. (JBL) |
|---|---|---|
| ROE | -17.8% | 43.4% |
| ROIC | -11.9% | 16.1% |
| P/E | -4.17 | 34.14 |
| P/B | 0.74 | 14.82 |
| Current Ratio | 3.56 | 1.00 |
| Quick Ratio | 2.11 | 0.66 |
| D/E (Debt-to-Equity) | 0.22 | 2.22 |
| Debt-to-Assets | 15.7% | 18.2% |
| Interest Coverage | -21.9 | 4.84 |
| Asset Turnover | 0.57 | 1.61 |
| Fixed Asset Turnover | 11.88 | 9.01 |
| Payout ratio | 0% | 5.5% |
| Dividend yield | 0% | 0.16% |
| Fiscal Year | 2025 | 2025 |
Efficiency & Valuation Duel: The Vital Signs
Financial ratios serve as a company’s DNA, exposing hidden risks and operational strengths through precise metrics.
Sandisk Corporation
Sandisk shows weak profitability with a negative ROE of -17.81% and a net margin of -22.31%, indicating operational struggles. The valuation appears attractive with a P/E of -4.17 and a P/B of 0.74, suggesting undervaluation. Absence of dividends points to reinvestment in R&D, supporting future growth despite near-term losses.
Jabil Inc.
Jabil delivers strong profitability, boasting a 43.42% ROE and a modest 2.2% net margin, signaling effective capital use but thin earnings. The stock trades at a stretched P/E of 34.14 and a high P/B of 14.82, reflecting premium pricing. A small dividend yield of 0.16% offsets modest buybacks, balancing shareholder returns cautiously.
Premium Valuation vs. Operational Safety
Jabil commands a premium for robust returns and operational efficiency, while Sandisk trades cheaper but with significant losses. Investors seeking growth via profitability may favor Jabil; those valuing undervaluation and R&D reinvestment might lean toward Sandisk despite elevated risk.
Which one offers the Superior Shareholder Reward?
I compare Sandisk Corporation (SNDK) and Jabil Inc. (JBL) on their shareholder rewards. Sandisk pays no dividends and has no buybacks, reflecting negative free cash flow (-0.8/share in 2025) and persistent losses. Its distribution model relies on reinvestment, but negative margins and worsening operating cash flow raise sustainability concerns. Conversely, Jabil pays a modest dividend yield (~0.16% in 2025) with a low payout ratio (~5.5%) and robust free cash flow (10.7/share in 2025). Jabil also executes consistent buybacks, boosting total shareholder return. Its positive margins and stable cash flow support sustainable distributions. I conclude Jabil offers a more attractive total return profile in 2026 due to its balanced, sustainable shareholder reward strategy.
Comparative Score Analysis: The Strategic Profile
The radar chart reveals the fundamental DNA and trade-offs of Sandisk Corporation and Jabil Inc., highlighting their financial strengths and vulnerabilities:
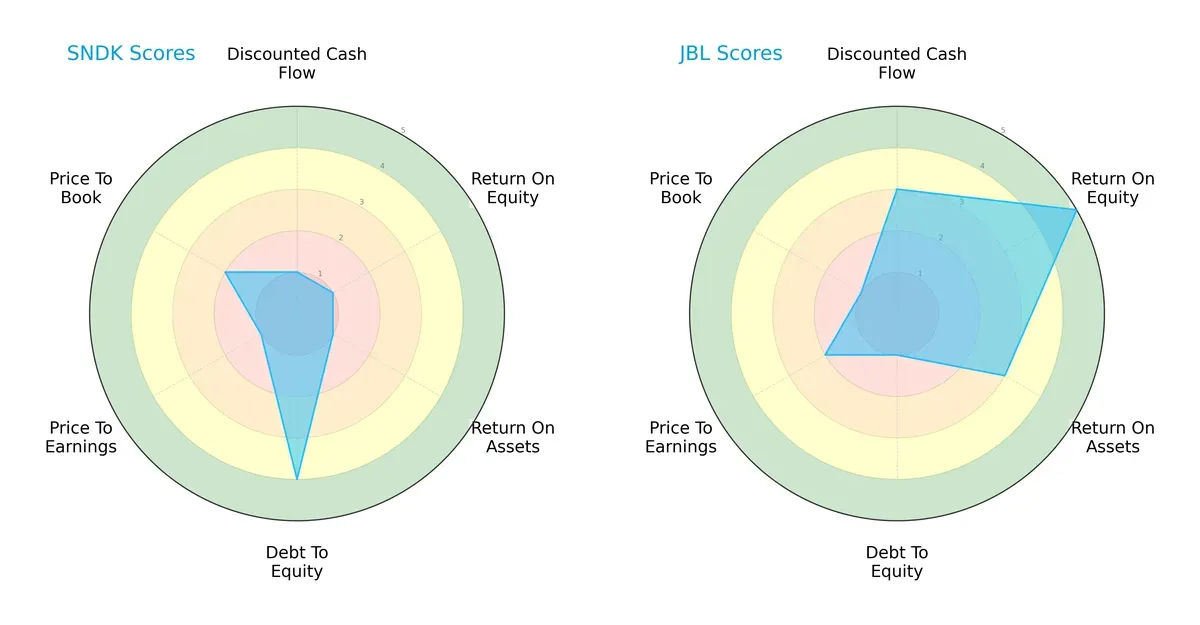
Jabil delivers a more balanced profile with strong ROE (5) and ROA (3) scores, supported by a solid DCF (3). However, it carries higher leverage risk, indicated by a weak debt-to-equity score (1). Sandisk shows a defensive balance sheet with a favorable debt-to-equity score (4) but struggles with profitability and valuation metrics, scoring very low in ROE (1), ROA (1), and P/E (1). Jabil relies on operational efficiency, while Sandisk depends heavily on financial prudence.
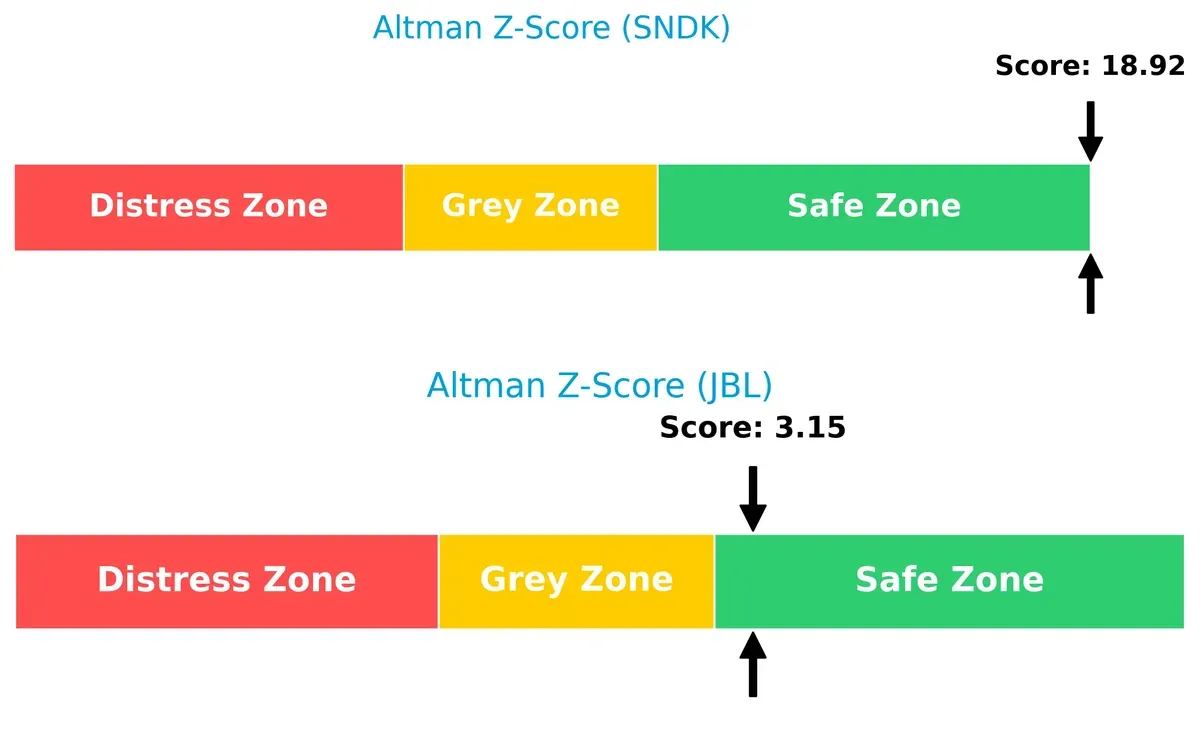
Bankruptcy Risk: Solvency Showdown
Jabil’s Altman Z-Score of 3.15 places it safely above distress, but just barely within the safe zone. Sandisk’s much higher 18.92 score signals an exceptionally strong solvency position, underscoring its resilience in this cycle:
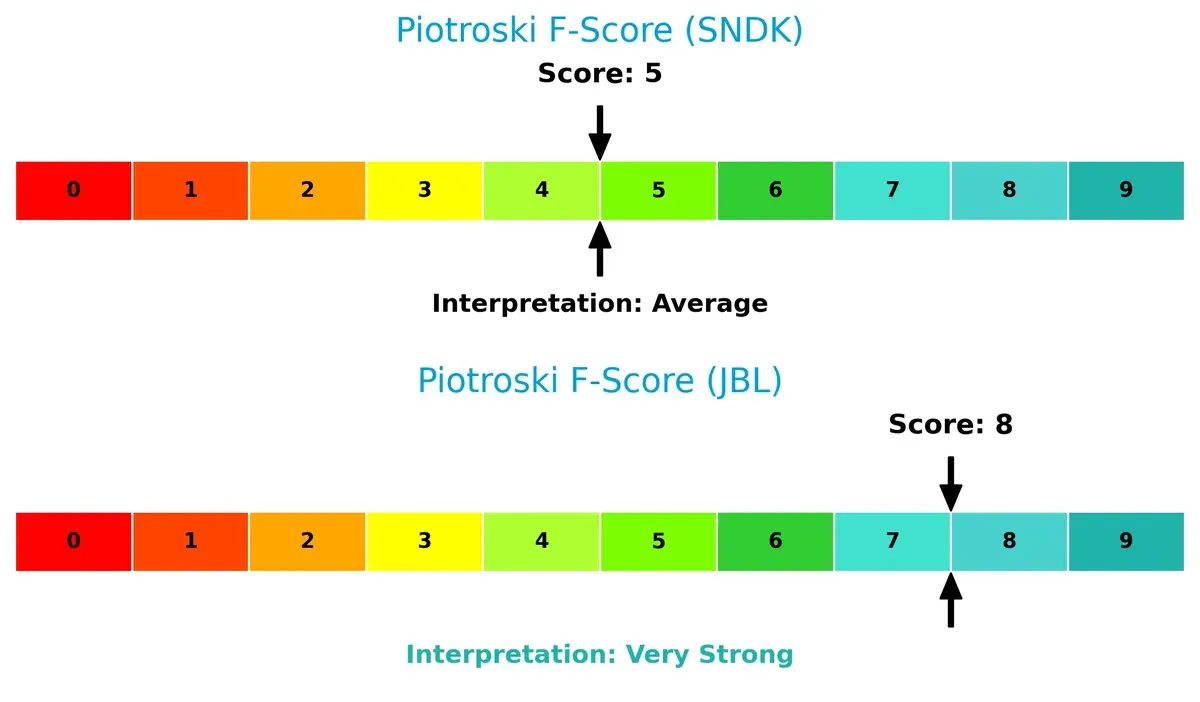
Financial Health: Quality of Operations
Jabil’s Piotroski F-Score of 8 indicates very strong internal financial health, reflecting robust profitability and efficiency. Sandisk’s score of 5 suggests average health, with some red flags in operational quality compared to Jabil:
How are the two companies positioned?
This section dissects the operational DNA of Sandisk and Jabil by comparing their revenue distribution and internal dynamics. Our goal is to confront their economic moats to reveal which model offers the most resilient competitive advantage today.
Revenue Segmentation: The Strategic Mix
This comparison dissects how Sandisk Corporation and Jabil Inc. diversify their income streams and reveals where their primary sector bets lie:
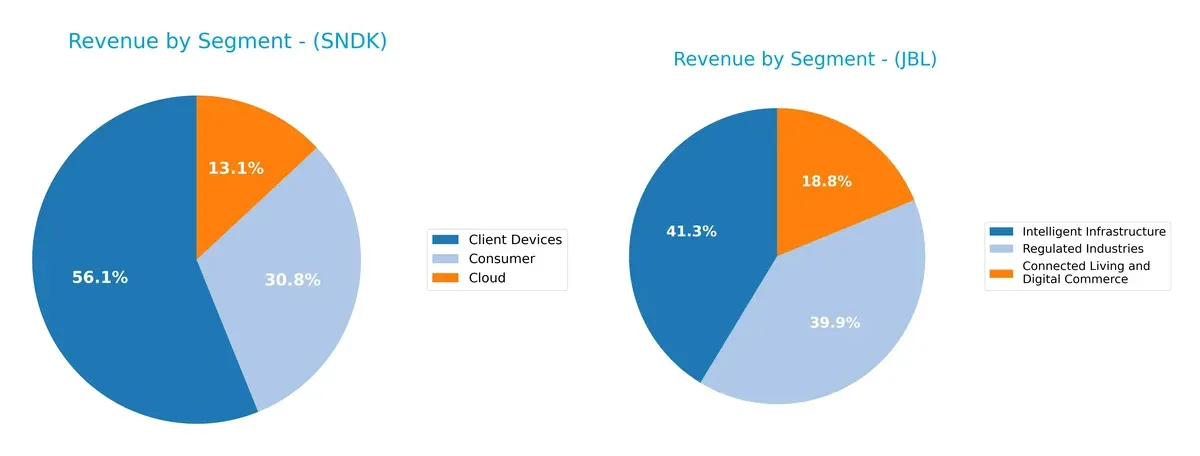
Sandisk anchors its revenue in Client Devices at $4.13B, with Consumer and Cloud segments trailing at $2.27B and $960M. Jabil presents a broader spread across Intelligent Infrastructure ($12.32B), Regulated Industries ($11.88B), and Connected Living ($5.61B). Sandisk’s concentration in Client Devices signals higher exposure to market cycles, while Jabil’s diversified mix cushions risk and leverages infrastructure dominance.
Strengths and Weaknesses Comparison
This table compares the Strengths and Weaknesses of Sandisk Corporation and Jabil Inc.:
Sandisk Corporation Strengths
- Strong quick ratio at 2.11 indicating liquidity
- Low debt-to-equity at 0.22 supporting financial stability
- Favorable fixed asset turnover at 11.88 showing efficient asset use
- Diversified revenue from Client Devices, Cloud, Consumer segments
- Global presence with significant sales in China, US, EMEA, Asia
Jabil Inc. Strengths
- High ROE at 43.42% and ROIC at 16.06% reflecting solid profitability
- Favorable asset and fixed asset turnover indicating operational efficiency
- Large, diversified revenue streams across Connected Living, Intelligent Infrastructure, Regulated Industries
- Broad global footprint with strong US, China, Mexico, Malaysia sales
Sandisk Corporation Weaknesses
- Negative net margin (-22.31%) and ROE (-17.81%) signaling poor profitability
- High WACC at 26.32% increasing capital costs
- Negative interest coverage ratio (-22.48) posing financial risk
- Unfavorable current ratio despite strong quick ratio
- No dividend yield limits income generation
Jabil Inc. Weaknesses
- Low net margin at 2.2% despite strong ROE
- Elevated debt-to-equity at 2.22 raising leverage concerns
- Unfavorable PE (34.14) and PB (14.82) ratios hinting at valuation risk
- Weak quick ratio at 0.66 and neutral interest coverage ratio
- Low dividend yield at 0.16%
Both companies show diversification and global reach, but Sandisk struggles with profitability and capital costs. Jabil demonstrates strong returns but faces leverage and valuation risks. These factors reflect different strategic challenges in managing growth and financial health.
The Moat Duel: Analyzing Competitive Defensibility
A structural moat is the only true shield protecting long-term profits from relentless competitive pressure. Let’s dissect the moats of two key players:
Sandisk Corporation: Intangible Assets and Innovation Powerhouse
Sandisk leverages its proprietary NAND flash technology, reflected in solid gross margins around 30%. However, declining ROIC signals value erosion, threatening its moat unless innovation accelerates in 2026.
Jabil Inc.: Operational Scale and Cost Advantage
Jabil’s manufacturing scale and diversified services create a cost advantage, supporting stable EBIT margins near 4%. Its improving ROIC trend confirms growing value creation and a deepening moat in 2026.
Innovation Edge vs. Scale Efficiency: The Moat Battle
Jabil commands a wider, more durable moat with expanding ROIC and operational leverage. Sandisk’s deteriorating profitability exposes it to margin compression. Jabil stands better poised to defend market share.
Which stock offers better returns?
The past year saw Sandisk Corporation’s stock surge dramatically, while Jabil Inc. posted steady gains with less volatility.
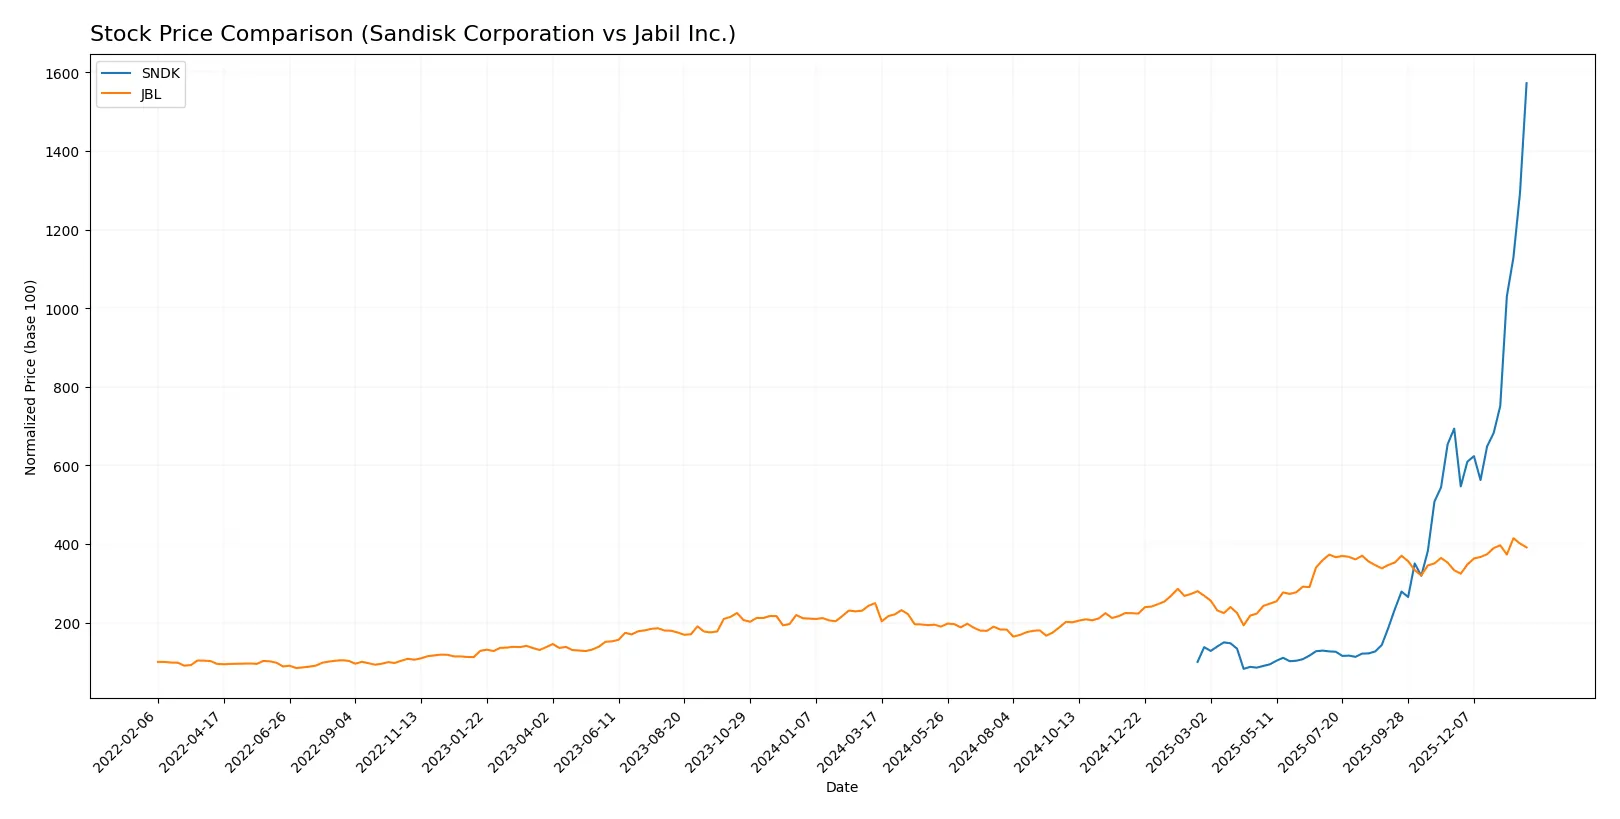
Trend Comparison
Sandisk’s stock rose 1472.31% over the past year with accelerating momentum, hitting a high of 576.25. Volatility remains elevated with a 125.16 standard deviation.
Jabil’s stock gained 56.83% over the same period, also accelerating but with lower volatility at 44.31 standard deviation and a high of 251.29.
Sandisk outperformed Jabil significantly, delivering the highest market returns and stronger buyer dominance throughout the year.
Target Prices
Analysts present a broad but optimistic consensus on target prices for Sandisk Corporation and Jabil Inc.
| Company | Target Low | Target High | Consensus |
|---|---|---|---|
| Sandisk Corporation | 220 | 1,000 | 614.62 |
| Jabil Inc. | 244 | 283 | 267.25 |
The target consensus for Sandisk stands about 7% above its current price of 576.25, signaling moderate upside potential. Jabil’s consensus target exceeds its 237.19 share price by roughly 12.5%, reflecting cautious optimism among analysts.

Don’t Let Luck Decide Your Entry Point
Optimize your entry points with our advanced ProRealTime indicators. You’ll get efficient buy signals with precise price targets for maximum performance. Start outperforming now!
How do institutions grade them?
Institutional grades for Sandisk Corporation and Jabil Inc. are summarized as follows:
Sandisk Corporation Grades
The table below lists recent grades from reputable financial institutions for Sandisk Corporation.
| Grading Company | Action | New Grade | Date |
|---|---|---|---|
| Jefferies | Maintain | Buy | 2026-01-30 |
| RBC Capital | Maintain | Sector Perform | 2026-01-30 |
| Goldman Sachs | Maintain | Buy | 2026-01-30 |
| Morgan Stanley | Maintain | Overweight | 2026-01-30 |
| Cantor Fitzgerald | Maintain | Overweight | 2026-01-30 |
| Wedbush | Maintain | Outperform | 2026-01-30 |
| Citigroup | Maintain | Buy | 2026-01-20 |
| Wells Fargo | Maintain | Equal Weight | 2026-01-15 |
| Benchmark | Maintain | Buy | 2026-01-15 |
| Bernstein | Maintain | Outperform | 2026-01-14 |
Jabil Inc. Grades
The following table shows recent institutional grades for Jabil Inc.
| Grading Company | Action | New Grade | Date |
|---|---|---|---|
| UBS | Maintain | Neutral | 2025-12-18 |
| Barclays | Maintain | Overweight | 2025-12-18 |
| JP Morgan | Maintain | Overweight | 2025-12-18 |
| B of A Securities | Maintain | Buy | 2025-12-10 |
| B of A Securities | Maintain | Buy | 2025-09-26 |
| Barclays | Maintain | Overweight | 2025-09-26 |
| JP Morgan | Maintain | Overweight | 2025-07-17 |
| B of A Securities | Maintain | Buy | 2025-06-20 |
| UBS | Maintain | Neutral | 2025-06-18 |
| B of A Securities | Maintain | Buy | 2025-06-18 |
Which company has the best grades?
Sandisk Corporation consistently receives strong buy and outperform ratings from top firms, suggesting a more favorable outlook. Jabil Inc. has solid overweight and buy grades but also neutral ratings, indicating more mixed institutional sentiment. Investors may interpret Sandisk’s broader consensus as a sign of higher confidence.
Risks specific to each company
The following categories identify the critical pressure points and systemic threats facing both firms in the 2026 market environment:
1. Market & Competition
Sandisk Corporation
- Faces intense competition in NAND flash storage with volatile margins and high beta of 4.89 indicating high market sensitivity.
Jabil Inc.
- Operates in diverse manufacturing services with lower beta of 1.25, indicating more stable market exposure but faces pricing pressure.
2. Capital Structure & Debt
Sandisk Corporation
- Maintains low debt-to-equity of 0.22 and debt-to-assets 15.7%, a favorable balance sheet with strong liquidity ratios.
Jabil Inc.
- Exhibits high debt-to-equity of 2.22, increasing financial risk despite a decent debt-to-assets ratio of 18.1%.
3. Stock Volatility
Sandisk Corporation
- Extremely volatile stock with beta near 4.9 and wide trading range; risk of sharp price swings is high.
Jabil Inc.
- Much lower beta near 1.25 and narrower trading range, indicating more controlled stock price movements.
4. Regulatory & Legal
Sandisk Corporation
- Subject to technology export controls and IP litigation risks common in semiconductor sector.
Jabil Inc.
- Exposed to compliance risks across multiple jurisdictions due to global contract manufacturing footprint.
5. Supply Chain & Operations
Sandisk Corporation
- Relies heavily on component suppliers for NAND technology; supply disruptions can impair production.
Jabil Inc.
- Complex global supply chain in manufacturing services; vulnerable to logistics bottlenecks and geopolitical tensions.
6. ESG & Climate Transition
Sandisk Corporation
- Faces pressure to reduce carbon footprint in semiconductor fabrication processes.
Jabil Inc.
- Larger workforce and manufacturing footprint create higher ESG compliance costs and climate transition risks.
7. Geopolitical Exposure
Sandisk Corporation
- Moderate exposure to US-China tensions affecting technology exports and supply chains.
Jabil Inc.
- Broad international presence increases exposure to trade disputes and regulatory changes worldwide.
Which company shows a better risk-adjusted profile?
Sandisk’s greatest risk lies in its extreme stock volatility and negative profitability metrics, despite a strong balance sheet. Jabil’s main risk is its elevated debt level, which magnifies financial vulnerability despite steadier operational performance. I judge Jabil to offer a better risk-adjusted profile, bolstered by its safer stock volatility and stronger profitability, even though its leverage is a cautionary flag. Sandisk’s beta near 4.9 versus Jabil’s 1.25 exemplifies the stark difference in market risk facing investors today.
Final Verdict: Which stock to choose?
Sandisk Corporation’s superpower lies in its strong liquidity and operational efficiency, enabling it to navigate volatility effectively. However, its persistent value destruction signals a need for caution, making it better suited for aggressive growth portfolios willing to tolerate risk for potential turnaround gains.
Jabil Inc. boasts a durable competitive moat with steadily growing returns on invested capital and robust profitability metrics. Its moderate financial leverage and consistent cash flow generation offer better stability than Sandisk, aligning well with GARP portfolios seeking balanced growth and reasonable valuation.
If you prioritize aggressive growth with a tolerance for operational challenges, Sandisk might be compelling due to its efficiency and liquidity buffer. However, if you seek durable competitive advantage and financial stability, Jabil outshines as a value creator with a more reliable profitability trajectory. Analytical scenarios suggest choosing based on your risk appetite and investment horizon.
Disclaimer: Investment carries a risk of loss of initial capital. The past performance is not a reliable indicator of future results. Be sure to understand risks before making an investment decision.
Go Further
I encourage you to read the complete analyses of Sandisk Corporation and Jabil Inc. to enhance your investment decisions: