In today’s fast-evolving technology landscape, choosing the right company to invest in requires careful analysis of innovation, market presence, and growth potential. Jabil Inc. (JBL) and Novanta Inc. (NOVT) both operate in the hardware, equipment, and parts industry, serving high-tech markets with distinct manufacturing and photonics expertise. This article will explore their strengths and challenges to help you identify the most compelling investment opportunity.
Table of contents
Companies Overview
I will begin the comparison between Jabil Inc. and Novanta Inc. by providing an overview of these two companies and their main differences.
Jabil Inc. Overview
Jabil Inc. is a global manufacturing services provider specializing in electronics and diversified manufacturing solutions. The company delivers comprehensive services, including electronic design, product management, and manufacturing test solutions. Serving industries such as 5G, automotive, healthcare, and digital print, Jabil operates through Electronics Manufacturing Services and Diversified Manufacturing Services segments. Headquartered in Florida, it employs around 138K people and is listed on the NYSE.
Novanta Inc. Overview
Novanta Inc. designs, manufactures, and markets photonics, vision, and precision motion components mainly for medical and industrial markets worldwide. Its offerings include laser-based solutions, medical visualization technologies, and precision motion control products. Operating under various brand names, Novanta focuses on original equipment manufacturers and maintains a workforce of approximately 3K employees. The company is headquartered in Massachusetts and trades on NASDAQ.
Key similarities and differences
Both companies operate in the hardware, equipment, and parts industry, focusing on high-technology manufacturing. Jabil emphasizes contract manufacturing and assembly services across diverse end markets, while Novanta specializes in photonics and precision motion components for specific medical and industrial applications. Jabil’s scale is significantly larger, with a market cap of about 25.6B and 138K employees, compared to Novanta’s 4.7B market cap and 3K employees, reflecting different market scopes and operational focuses.
Income Statement Comparison
The table below compares key income statement metrics for Jabil Inc. and Novanta Inc. for their most recent fiscal years, illustrating their financial performance side by side.

| Metric | Jabil Inc. (JBL) | Novanta Inc. (NOVT) |
|---|---|---|
| Market Cap | 25.6B | 4.7B |
| Revenue | 29.8B | 949M |
| EBITDA | 1.81B | 180M |
| EBIT | 1.14B | 124M |
| Net Income | 657M | 64.1M |
| EPS | 6.00 | 1.78 |
| Fiscal Year | 2025 | 2024 |
Income Statement Interpretations
Jabil Inc.
Jabil Inc. experienced modest revenue growth of 3.18% in the most recent year, but net income declined sharply by 54.13%, reflecting pressure on profitability. Gross and net margins showed neutral to unfavorable trends, with gross margin at 8.88% and net margin at 2.2%. The latest year saw a significant drop in EBIT and net margin, signaling margin compression despite stable revenue.
Novanta Inc.
Novanta Inc. demonstrated strong revenue growth of 7.67% in the last fiscal year, supported by favorable gross and EBIT margins at 44.41% and 13.09% respectively. Net margin stood at 6.75%, though it declined by 18.32% year-over-year. Overall, Novanta showed solid income growth and margin strength over the period, with some recent softness in net profitability.
Which one has the stronger fundamentals?
Novanta’s income statement presents a more favorable profile, with higher gross and EBIT margins and robust revenue and net income growth over the period. In contrast, Jabil’s fundamentals appear weaker, marked by declining net income and margins alongside only modest revenue gains. Novanta’s consistent margin advantage and growth metrics suggest stronger income fundamentals between the two.
Financial Ratios Comparison
The table below presents the most recent financial ratios for Jabil Inc. and Novanta Inc., enabling a straightforward comparison of their key financial metrics for 2025 and 2024 respectively.
| Ratios | Jabil Inc. (2025) | Novanta Inc. (2024) |
|---|---|---|
| ROE | 43.4% | 8.6% |
| ROIC | 16.1% | 7.2% |
| P/E | 34.1 | 85.7 |
| P/B | 14.8 | 7.4 |
| Current Ratio | 1.00 | 2.58 |
| Quick Ratio | 0.66 | 1.72 |
| D/E (Debt to Equity) | 2.22 | 0.63 |
| Debt-to-Assets | 18.2% | 33.9% |
| Interest Coverage | 4.84 | 3.51 |
| Asset Turnover | 1.61 | 0.68 |
| Fixed Asset Turnover | 9.01 | 6.08 |
| Payout ratio | 5.5% | 0% |
| Dividend yield | 0.16% | 0% |
Interpretation of the Ratios
Jabil Inc.
Jabil shows a mixed ratio profile with a strong return on equity at 43.42% and return on invested capital at 16.06%, indicating efficient capital use. However, concerns arise from a low net margin of 2.2%, elevated price-to-book at 14.82, and weak liquidity with a quick ratio of 0.66. Its dividend yield is low at 0.16%, suggesting limited returns from dividends despite regular payouts.
Novanta Inc.
Novanta exhibits moderate profitability with a net margin of 6.75% and neutral return on invested capital at 7.19%, but weaker return on equity at 8.59%. Liquidity ratios are favorable, with current and quick ratios above 1.7. The company does not pay dividends, likely reflecting a reinvestment strategy or growth phase, supported by solid coverage of operating cash flows and moderate debt levels.
Which one has the best ratios?
Both companies face challenges, but Jabil benefits from stronger returns on equity and capital despite liquidity and valuation concerns. Novanta’s liquidity is healthier, yet its profitability and valuation ratios are less favorable. Overall, neither has a clearly superior ratio profile; each presents a balance of strengths and weaknesses requiring cautious consideration.
Strategic Positioning
This section compares the strategic positioning of Jabil Inc. and Novanta Inc., focusing on market position, key segments, and exposure to technological disruption:
Jabil Inc.
- Large market cap of 25.6B, operates globally with significant competitive pressure in electronics manufacturing.
- Diversified segments: Electronics Manufacturing Services and Diversified Manufacturing Services, serving multiple industries including 5G, automotive, healthcare.
- Exposure includes electronics design and manufacturing with evolving technologies in 5G and digital commerce.
Novanta Inc.
- Smaller market cap of 4.7B, niche player in specialized photonics and precision components sectors.
- Concentrated segments: Photonics, Vision, and Precision Motion focused on medical and industrial markets.
- Exposure centered on advanced laser, imaging, and motion control technologies with innovation in medical devices.
Jabil Inc. vs Novanta Inc. Positioning
Jabil’s diversified approach spans broad industrial and digital sectors, offering resilience but facing intense competition. Novanta targets specialized high-tech medical and industrial niches, which may limit scale but focus on innovation-driven markets.
Which has the best competitive advantage?
Jabil exhibits a very favorable moat with growing ROIC above WACC, indicating strong value creation and durable competitive advantage. Novanta shows slightly unfavorable moat status, shedding value despite improving profitability.
Stock Comparison
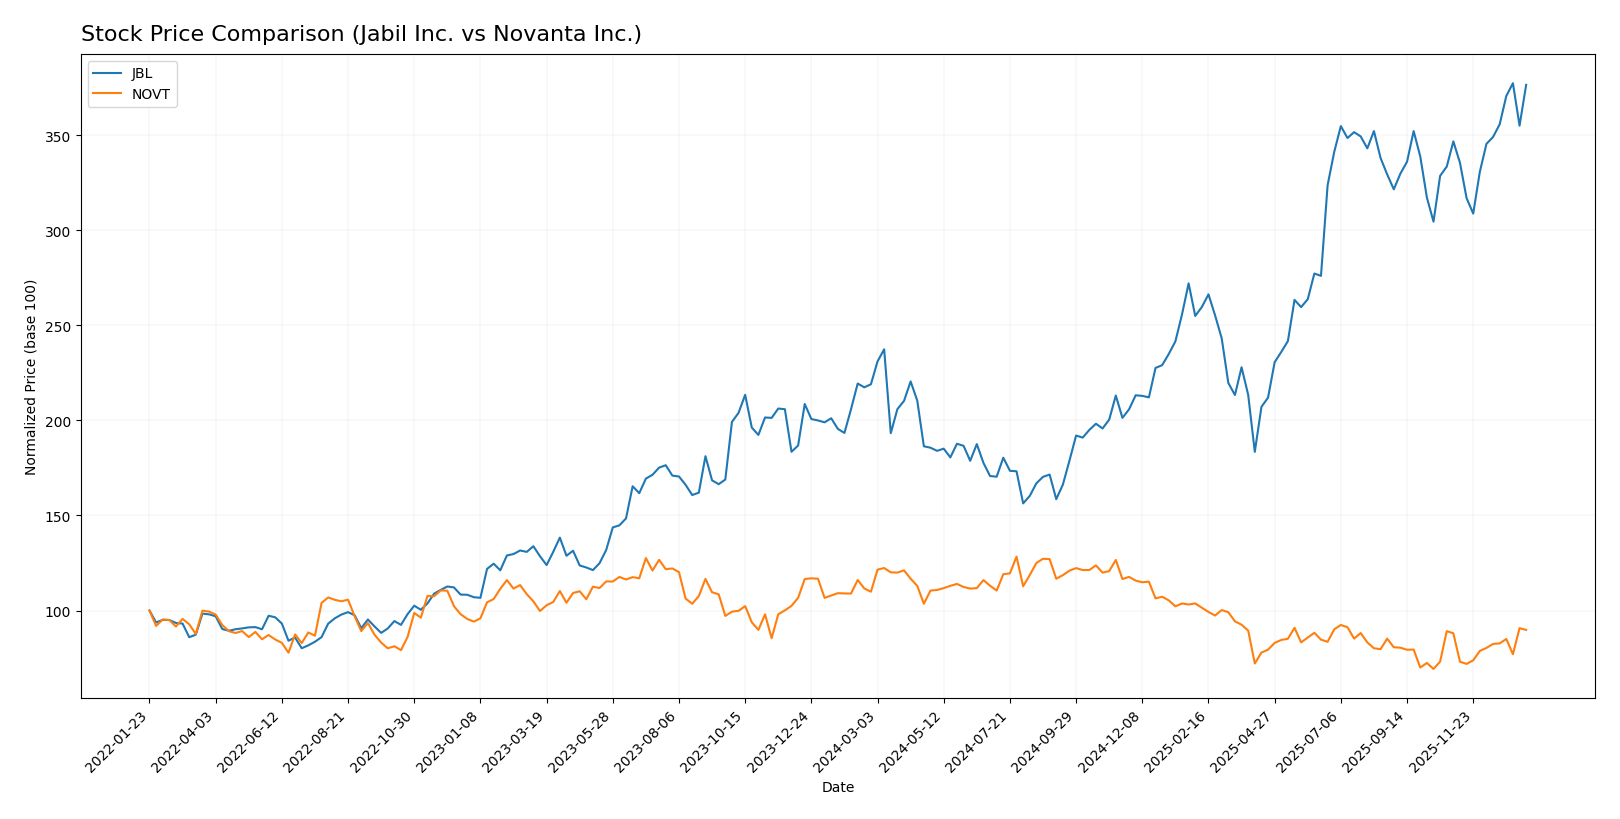
The past year has shown a strong bullish trend for Jabil Inc. (JBL) with significant price appreciation and accelerating momentum, while Novanta Inc. (NOVT) experienced a bearish trend marked by declining prices despite acceleration signs.
Trend Analysis
Jabil Inc. (JBL) exhibited a 71.89% price increase over the past 12 months, confirming a bullish trend with accelerating momentum and a high volatility level, reflected by a standard deviation of 42.69.
Novanta Inc. (NOVT) saw an 18.29% decrease in stock price over the same period, indicating a bearish trend with acceleration, accompanied by moderate volatility at a 25.05 standard deviation.
Comparing both, JBL delivered the highest market performance with a clear bullish trend versus NOVT’s bearish direction over the last year.
Target Prices
The current analyst consensus presents clear target price ranges for both Jabil Inc. and Novanta Inc.
| Company | Target High | Target Low | Consensus |
|---|---|---|---|
| Jabil Inc. | 283 | 244 | 260.5 |
| Novanta Inc. | 160 | 160 | 160 |
Analysts expect Jabil Inc.’s stock to appreciate moderately above its current price of 239.51 USD, with a consensus target of 260.5 USD. Novanta Inc.’s consensus target of 160 USD also suggests upside potential from its present price of 129.74 USD, indicating positive market expectations.
Analyst Opinions Comparison
This section compares analysts’ ratings and grades for Jabil Inc. and Novanta Inc.:
Rating Comparison
JBL Rating
- Rating: B-, categorized as Very Favorable.
- Discounted Cash Flow Score: 3, indicating a moderate status.
- ROE Score: 5, representing a very favorable return on equity.
- ROA Score: 3, showing moderate asset utilization.
- Debt To Equity Score: 1, reflecting a very unfavorable risk.
- Overall Score: 3, indicating a moderate overall score.
NOVT Rating
- Rating: C+, categorized as Very Favorable.
- Discounted Cash Flow Score: 3, indicating a moderate status.
- ROE Score: 3, representing a moderate return on equity.
- ROA Score: 3, showing moderate asset utilization.
- Debt To Equity Score: 1, reflecting a very unfavorable risk.
- Overall Score: 2, indicating a moderate overall score.
Which one is the best rated?
Based strictly on the provided data, JBL holds a higher overall score and a stronger ROE score than NOVT, despite both having similar discounted cash flow and debt-to-equity scores. JBL is therefore better rated overall.
Scores Comparison
Here is a comparison of the financial stability and strength scores for Jabil Inc. and Novanta Inc.:
JBL Scores
- Altman Z-Score: 3.09, indicating a safe zone with low bankruptcy risk.
- Piotroski Score: 8, classified as very strong financial health.
NOVT Scores
- Altman Z-Score: 5.35, well within the safe zone, indicating very low bankruptcy risk.
- Piotroski Score: 6, reflecting average financial strength.
Which company has the best scores?
Novanta Inc. has a higher Altman Z-Score, suggesting stronger bankruptcy safety, while Jabil Inc. holds a superior Piotroski Score, indicating better overall financial strength. Each company excels in different score categories based on provided data.
Grades Comparison
The following presents the latest reliable grades from recognized financial institutions for both companies:
Jabil Inc. Grades
This table summarizes recent grades and their updates from established grading companies for Jabil Inc.:
| Grading Company | Action | New Grade | Date |
|---|---|---|---|
| JP Morgan | Maintain | Overweight | 2025-12-18 |
| UBS | Maintain | Neutral | 2025-12-18 |
| Barclays | Maintain | Overweight | 2025-12-18 |
| B of A Securities | Maintain | Buy | 2025-12-10 |
| Barclays | Maintain | Overweight | 2025-09-26 |
| B of A Securities | Maintain | Buy | 2025-09-26 |
| JP Morgan | Maintain | Overweight | 2025-07-17 |
| B of A Securities | Maintain | Buy | 2025-06-20 |
| UBS | Maintain | Neutral | 2025-06-18 |
| JP Morgan | Maintain | Overweight | 2025-06-18 |
Overall, Jabil Inc. displays a consistent trend of favorable ratings, primarily “Overweight” and “Buy,” with no downgrades reported.
Novanta Inc. Grades
This table summarizes recent grades and their updates from established grading companies for Novanta Inc.:
| Grading Company | Action | New Grade | Date |
|---|---|---|---|
| Baird | Maintain | Neutral | 2025-08-11 |
| Baird | Maintain | Neutral | 2025-03-03 |
| Baird | Maintain | Neutral | 2024-11-06 |
| Baird | Maintain | Neutral | 2024-08-07 |
| Baird | Maintain | Neutral | 2023-05-11 |
| Baird | Maintain | Neutral | 2023-05-10 |
| William Blair | Upgrade | Outperform | 2022-05-11 |
| William Blair | Upgrade | Outperform | 2022-05-10 |
| Berenberg | Maintain | Hold | 2020-11-13 |
| Baird | Maintain | Neutral | 2020-05-13 |
Novanta Inc. shows a stable pattern with predominantly “Neutral” ratings, occasional “Outperform” upgrades, and no negative downgrades in recent years.
Which company has the best grades?
Jabil Inc. has received stronger and more frequent positive ratings such as “Overweight” and “Buy,” compared to Novanta Inc.’s consistent but more neutral ratings. This difference may influence investors seeking more assertive analyst support.
Strengths and Weaknesses
Below is a comparison of key strengths and weaknesses for Jabil Inc. (JBL) and Novanta Inc. (NOVT), based on their latest financial and operational data.
| Criterion | Jabil Inc. (JBL) | Novanta Inc. (NOVT) |
|---|---|---|
| Diversification | Highly diversified across Connected Living, Intelligent Infrastructure, and Regulated Industries with revenues above $30B in 2025 | Moderately diversified in Precision Manufacturing, Robotics, Surgery, and Medicine with total revenues around $950M in 2024 |
| Profitability | Strong ROIC at 16.06% and ROE at 43.42%, but low net margin at 2.2% and slightly unfavorable overall ratios | Moderate net margin of 6.75%, ROIC at 7.19%, but overall slightly unfavorable ratios and negative value creation (ROIC < WACC) |
| Innovation | Demonstrates growing ROIC and durable competitive advantage, indicating effective capital use and innovation | Improving ROIC trend but still value destroying, indicating ongoing efforts in innovation yet profitability challenges |
| Global presence | Large global footprint reflected in diverse industry exposure and high asset turnover | Smaller scale with focus on niche advanced technologies, less global breadth compared to JBL |
| Market Share | Significant market share in electronics manufacturing services (EMS) and digital commerce sectors | Niche market share in precision motion and photonics, growing in advanced surgery and robotics |
Key takeaways: Jabil stands out with strong profitability metrics and broad diversification, supporting its durable competitive advantage. Novanta shows promise with innovation and growing ROIC but faces challenges in creating value and maintaining profitability. Investors should weigh JBL’s scale and efficiency against NOVT’s growth potential and higher risk profile.
Risk Analysis
Below is a risk comparison table for Jabil Inc. (JBL) and Novanta Inc. (NOVT) based on the most recent data:
| Metric | Jabil Inc. (JBL) | Novanta Inc. (NOVT) |
|---|---|---|
| Market Risk | Beta 1.25, moderate volatility | Beta 1.60, higher volatility risk |
| Debt Level | High debt-to-equity (2.22, unfavorable) | Moderate debt-to-equity (0.63, neutral) |
| Regulatory Risk | Moderate, operates globally in tech manufacturing | Moderate, medical and industrial tech sectors |
| Operational Risk | Large scale operations, risk in supply chain and production | Smaller scale, specialized manufacturing risks |
| Environmental Risk | Exposure due to manufacturing processes | Moderate, photonics and precision motion focus |
| Geopolitical Risk | US-based with global supply chain exposure | US-based, less diversified globally |
Jabil faces higher debt levels and operational scale risks, making financial leverage and supply chain disruptions primary concerns. Novanta, with higher beta and industry-specific regulatory risks, is more sensitive to market swings and tech regulations. Investors should weigh Jabil’s leverage risk against Novanta’s market volatility.
Which Stock to Choose?
Jabil Inc. (JBL) shows a mixed income evolution with mostly unfavorable growth rates and a global income statement rated unfavorable. Its financial ratios are slightly unfavorable overall, despite strong profitability indicators like ROE at 43.4%. The company carries moderate debt and holds a very favorable rating with a B- grade.
Novanta Inc. (NOVT) presents a favorable global income statement with solid revenue and net income growth, though some margins declined. Its financial ratios are slightly unfavorable overall, with moderate profitability and balanced debt levels. The company has a very favorable rating of C+, supported by safe-zone Altman Z-Score.
Investors with a growth orientation might find Novanta’s favorable income growth and stable financial position appealing, while those valuing durable competitive advantage and strong profitability metrics could view Jabil’s very favorable rating and value-creating moat as attractive. The choice could depend on balancing growth potential against profitability and financial stability.
Disclaimer: Investment carries a risk of loss of initial capital. The past performance is not a reliable indicator of future results. Be sure to understand risks before making an investment decision.
Go Further
I encourage you to read the complete analyses of Jabil Inc. and Novanta Inc. to enhance your investment decisions: