Navigating the hardware and equipment industry requires keen insight into companies driving innovation and market growth. Jabil Inc. and MKS Inc. are two prominent players offering advanced manufacturing services and process control solutions, respectively. Both operate at the cutting edge of technology with overlapping markets in electronics and industrial applications. In this article, I will analyze their strengths to help you decide which company presents a more compelling investment opportunity.
Table of contents
Companies Overview
I will begin the comparison between Jabil Inc. and MKS Inc. by providing an overview of these two companies and their main differences.
Jabil Inc. Overview
Jabil Inc. operates globally in the manufacturing services sector, focusing on Electronics Manufacturing Services and Diversified Manufacturing Services. The company offers a broad range of design, production, and product management solutions, including electronic design, rapid prototyping, and industrial design services. Headquartered in Saint Petersburg, Florida, Jabil serves multiple industries such as 5G, automotive, healthcare, and cloud technology.
MKS Inc. Overview
MKS Inc. specializes in instruments, systems, and process control solutions for manufacturing, targeting semiconductor, industrial, life sciences, and defense markets. Its product portfolio includes vacuum and pressure control, laser technologies, photonics, and PCB manufacturing systems. Based in Andover, Massachusetts, MKS distributes through direct sales, distributors, and online channels, emphasizing precision control and measurement technologies.
Key similarities and differences
Both companies operate in the Technology sector and focus on hardware, equipment, and parts manufacturing. Jabil emphasizes broad electronics manufacturing and product management across diverse industries, while MKS concentrates on specialized instruments and control solutions for manufacturing processes. Jabil has a significantly larger workforce and market capitalization, whereas MKS targets niche markets with advanced laser and photonics technologies.
Income Statement Comparison
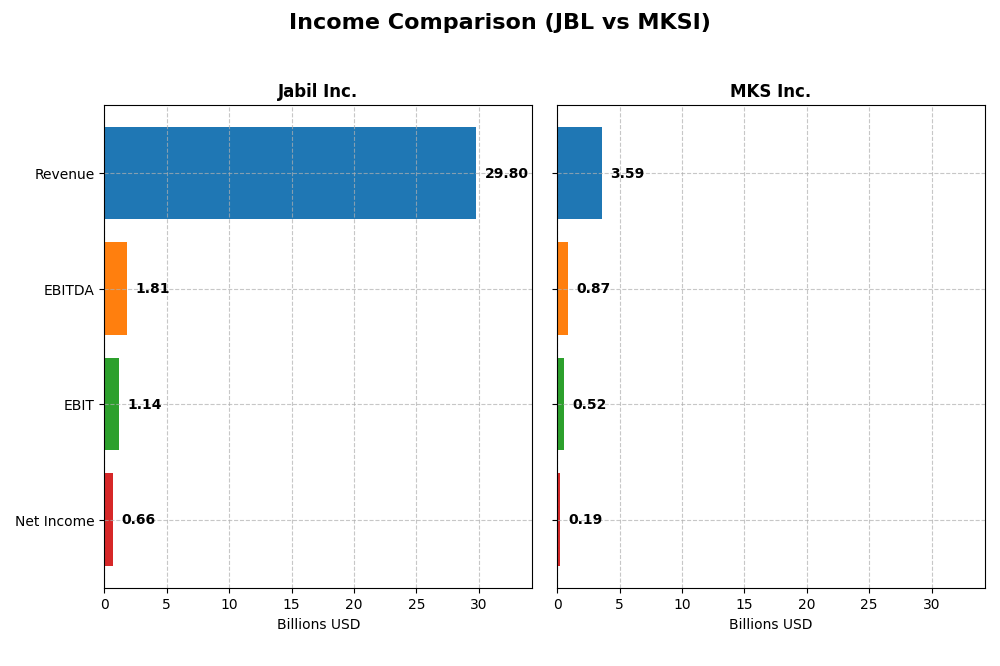
The following table compares the most recent fiscal year income statement metrics for Jabil Inc. and MKS Inc., providing a snapshot of their financial performance.
| Metric | Jabil Inc. (JBL) | MKS Inc. (MKSI) |
|---|---|---|
| Market Cap | 25.5B | 13B |
| Revenue | 29.8B | 3.59B |
| EBITDA | 1.81B | 870M |
| EBIT | 1.14B | 522M |
| Net Income | 657M | 190M |
| EPS | 6.00 | 2.82 |
| Fiscal Year | 2025 | 2024 |
Income Statement Interpretations
Jabil Inc.
Jabil’s revenue showed modest growth, rising 3.18% from 2024 to 2025, but net income fell sharply by 54.13% over the same period. Margins remained mostly stable with a neutral gross margin at 8.88% and net margin at 2.2%, though EBIT margin weakened to 3.81%. The latest year’s performance indicates slowing growth and deteriorating profitability amid higher operating expenses.
MKS Inc.
MKS experienced a slight revenue decline of 0.99% in 2024 but improved profitability with net income more than doubling and net margin expanding to 5.3%. Gross margin and EBIT margin were favorable at 47.63% and 14.56%, respectively. Despite short-term revenue contraction, the company’s operating efficiency and earnings growth showed strong improvement last year.
Which one has the stronger fundamentals?
MKS displays stronger fundamentals with higher and improving margins, favorable EBIT and net margin growth, and a positive overall income statement evaluation. Conversely, Jabil faces unfavorable trends in net income, EBIT, and margin growth, despite modest revenue gains. Thus, MKS’s income statement reflects more robust profitability and efficiency compared to Jabil’s recent performance.
Financial Ratios Comparison
The table below compares key financial ratios for Jabil Inc. (JBL) and MKS Inc. (MKSI) based on their most recent fiscal year data, providing a snapshot of their profitability, liquidity, leverage, and market valuation.
| Ratios | Jabil Inc. (2025) | MKS Inc. (2024) |
|---|---|---|
| ROE | 43.4% | 8.2% |
| ROIC | 16.1% | 6.3% |
| P/E | 34.1 | 37.0 |
| P/B | 14.8 | 3.03 |
| Current Ratio | 1.00 | 3.19 |
| Quick Ratio | 0.66 | 2.04 |
| D/E (Debt-to-Equity) | 2.22 | 2.06 |
| Debt-to-Assets | 18.2% | 55.6% |
| Interest Coverage | 4.84 | 1.44 |
| Asset Turnover | 1.61 | 0.42 |
| Fixed Asset Turnover | 9.01 | 3.55 |
| Payout Ratio | 5.5% | 31.1% |
| Dividend Yield | 0.16% | 0.84% |
Interpretation of the Ratios
Jabil Inc.
Jabil Inc. shows a mixed ratio profile with strong return on equity (43.42%) and return on invested capital (16.06%), indicating efficient capital use. However, concerns arise from a low net margin (2.2%), high price-to-book (14.82), and elevated debt-to-equity (2.22). The company pays dividends with a low yield of 0.16%, suggesting limited shareholder returns and cautious payout sustainability.
MKS Inc.
MKS Inc. presents mostly weak financial ratios, including low return on equity (8.18%), high debt-to-assets (55.65%), and poor interest coverage (1.51). Its current ratio is high but considered unfavorable in context, and asset turnover is low (0.42). The dividend yield is 0.84%, but overall ratios indicate financial strain and potential risks for shareholder returns.
Which one has the best ratios?
Jabil Inc. holds a more favorable ratio profile with higher returns and better leverage management, despite some valuation and liquidity concerns. MKS Inc. faces more unfavorable ratios, especially regarding leverage and profitability. Consequently, Jabil’s metrics are generally stronger compared to MKS’s more constrained financial performance.
Strategic Positioning
This section compares the strategic positioning of Jabil Inc. and MKS Inc. regarding market position, key segments, and exposure to technological disruption:
Jabil Inc.
- Leading global manufacturing services provider facing competitive pressure in electronics and diversified manufacturing.
- Operates in Electronics Manufacturing Services and Diversified Manufacturing Services, serving multiple industries including 5G, automotive, and healthcare.
- Moderate exposure through advanced electronics design and manufacturing services with evolving industrial design and testing capabilities.
MKS Inc.
- Provides specialized instruments and control solutions with competition in semiconductor and industrial markets.
- Focuses on Vacuum & Analysis, Light & Motion, and Equipment & Solutions segments for semiconductor and research markets.
- High exposure via advanced laser, photonics, and process control technologies critical to semiconductor manufacturing.
Jabil Inc. vs MKS Inc. Positioning
Jabil has a diversified manufacturing portfolio spanning multiple industries, offering stability and broad market access. MKS concentrates on precision instruments and process control for semiconductors, enabling specialization but limiting market breadth. Each approach presents distinct strategic trade-offs based on scope and industry focus.
Which has the best competitive advantage?
Jabil demonstrates a very favorable moat with growing ROIC above WACC, indicating durable competitive advantage and value creation. Conversely, MKS shows a very unfavorable moat with declining ROIC below WACC, reflecting value destruction and weaker competitive positioning.
Stock Comparison
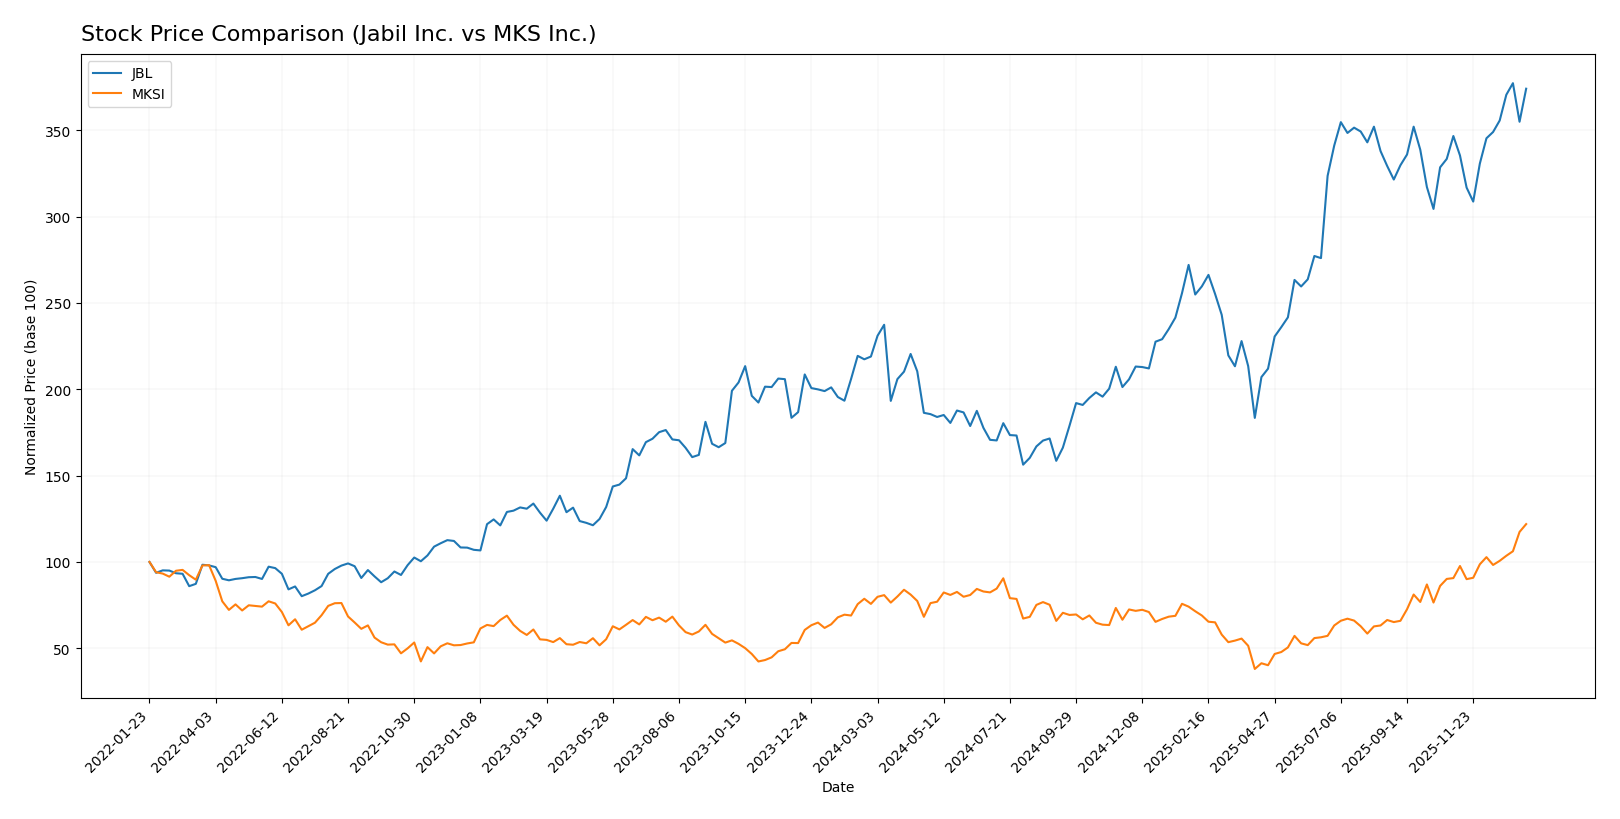
The past year has seen significant bullish trends for both Jabil Inc. (JBL) and MKS Inc. (MKSI), with notable price appreciations and distinct trading volume dynamics highlighting their market momentum.
Trend Analysis
Jabil Inc. (JBL) exhibited a strong bullish trend over the past 12 months with a 70.84% price increase, showing acceleration and high volatility, reaching a peak of 240.39 and a low of 99.62.
MKS Inc. (MKSI) also demonstrated a bullish trend with a 61.03% price increase over the same period, featuring acceleration and moderate volatility, hitting a high of 193.28 and a low of 60.29.
Comparing the two, JBL delivered the highest market performance with a larger overall price increase, although MKSI showed stronger buyer dominance and a sharper recent price increase.
Target Prices
Analysts present a clear target price consensus for both Jabil Inc. and MKS Inc.
| Company | Target High | Target Low | Consensus |
|---|---|---|---|
| Jabil Inc. | 283 | 244 | 260.5 |
| MKS Inc. | 215 | 136 | 176.17 |
The consensus target for Jabil Inc. is about 9% above its current price of 238.35, indicating moderate upside potential. MKS Inc.’s consensus target also suggests upside from its current price of 193.28, but with a wider range reflecting higher uncertainty.
Analyst Opinions Comparison
This section compares analysts’ ratings and grades for Jabil Inc. and MKS Inc.:
Rating Comparison
JBL Rating
- Rating: B- with a very favorable status indicating solid analyst confidence.
- Discounted Cash Flow Score: 3, moderate status, suggesting average valuation outlook.
- ROE Score: 5, very favorable, reflecting highly efficient profit generation from equity.
- ROA Score: 3, moderate, indicating average asset utilization efficiency.
- Debt To Equity Score: 1, very unfavorable, implying higher financial risk due to debt levels.
- Overall Score: 3, moderate, summarizing a balanced financial standing.
MKSI Rating
- Rating: B- also very favorable, showing similar analyst confidence.
- Discounted Cash Flow Score: 3, moderate status, indicating comparable valuation outlook.
- ROE Score: 3, moderate, showing average efficiency in generating shareholder returns.
- ROA Score: 3, moderate, reflecting similar asset use effectiveness.
- Debt To Equity Score: 1, very unfavorable, also indicating notable financial leverage concerns.
- Overall Score: 2, moderate, signaling slightly less robust overall financial health.
Which one is the best rated?
Based strictly on the provided data, JBL and MKSI share the same overall rating of B- and both have moderate overall scores. JBL stands out with a higher ROE score of 5 versus 3 for MKSI, indicating better profitability efficiency. However, both have equally unfavorable debt to equity scores.
Scores Comparison
Here is the comparison of the Altman Z-Score and Piotroski Score for Jabil Inc. and MKS Inc.:
JBL Scores
- Altman Z-Score: 3.09, placing JBL in the safe zone.
- Piotroski Score: 8, indicating very strong financial health.
MKSI Scores
- Altman Z-Score: 2.22, placing MKSI in the grey zone.
- Piotroski Score: 7, indicating strong financial health.
Which company has the best scores?
Based on the provided data, JBL has a higher Altman Z-Score in the safe zone and a stronger Piotroski Score of 8 versus MKSI’s 7. JBL’s scores suggest a comparatively better financial position.
Grades Comparison
Here is a comparison of the latest grades from reputable financial institutions for both companies:
Jabil Inc. Grades
This table displays recent grades assigned by major financial firms for Jabil Inc.:
| Grading Company | Action | New Grade | Date |
|---|---|---|---|
| JP Morgan | Maintain | Overweight | 2025-12-18 |
| UBS | Maintain | Neutral | 2025-12-18 |
| Barclays | Maintain | Overweight | 2025-12-18 |
| B of A Securities | Maintain | Buy | 2025-12-10 |
| Barclays | Maintain | Overweight | 2025-09-26 |
| B of A Securities | Maintain | Buy | 2025-09-26 |
| JP Morgan | Maintain | Overweight | 2025-07-17 |
| B of A Securities | Maintain | Buy | 2025-06-20 |
| UBS | Maintain | Neutral | 2025-06-18 |
| JP Morgan | Maintain | Overweight | 2025-06-18 |
The grades for Jabil Inc. show a stable pattern with multiple “Buy” and “Overweight” ratings, indicating confidence among analysts with some holding a neutral stance.
MKS Inc. Grades
This table presents recent grades assigned by well-known financial institutions for MKS Inc.:
| Grading Company | Action | New Grade | Date |
|---|---|---|---|
| B of A Securities | Maintain | Buy | 2026-01-13 |
| Needham | Maintain | Buy | 2026-01-13 |
| Mizuho | Maintain | Outperform | 2025-12-17 |
| Citigroup | Maintain | Buy | 2025-11-12 |
| Wells Fargo | Maintain | Equal Weight | 2025-11-07 |
| Keybanc | Maintain | Overweight | 2025-11-07 |
| Benchmark | Maintain | Buy | 2025-11-07 |
| Needham | Maintain | Buy | 2025-11-06 |
| Mizuho | Maintain | Outperform | 2025-10-16 |
| Needham | Maintain | Buy | 2025-10-13 |
The grades for MKS Inc. predominantly indicate “Buy” and “Outperform” ratings, with occasional “Equal Weight” and “Overweight,” reflecting broadly positive analyst sentiment.
Which company has the best grades?
MKS Inc. has received more consistently positive grades, including a strong consensus “Buy” with 22 buy ratings versus Jabil Inc.’s consensus “Hold” and a more balanced mix of buy and hold opinions. This suggests that MKS Inc. may be viewed as having stronger growth or value potential, which could influence investor confidence and portfolio decisions.
Strengths and Weaknesses
Below is a comparative table presenting the key strengths and weaknesses of Jabil Inc. (JBL) and MKS Inc. (MKSI) based on recent financial and operational data.
| Criterion | Jabil Inc. (JBL) | MKS Inc. (MKSI) |
|---|---|---|
| Diversification | Highly diversified across Connected Living & Digital Commerce, Intelligent Infrastructure, and Regulated Industries with revenues exceeding $30B in 2025. | More focused product segmentation with $3.1B in Products and $462M in Services in 2024, less diversified. |
| Profitability | Favorable ROIC (16.06%) and ROE (43.42%), though net margin is low (2.2%) and some liquidity ratios are weak. | Neutral to unfavorable profitability metrics: ROIC at 6.31%, ROE at 8.18%, net margin neutral at 5.3%. |
| Innovation | Demonstrates a very favorable economic moat with growing ROIC, indicating strong competitive advantage and efficient capital use. | Very unfavorable economic moat with declining ROIC and value destruction, signaling challenges in innovation and capital efficiency. |
| Global presence | Significant global footprint supporting multiple industries and infrastructure sectors. | More niche market presence focused on photonics, vacuum, and equipment solutions. |
| Market Share | Large market share across multiple sectors with consistent revenue growth. | Smaller scale with less market share and higher financial risk indicators. |
Key takeaway: Jabil Inc. shows strong diversification, solid profitability, and a durable competitive advantage, making it a relatively safer choice. In contrast, MKS Inc. faces profitability and capital efficiency challenges, reflecting higher investment risk.
Risk Analysis
Below is a comparative overview of key risks for Jabil Inc. (JBL) and MKS Inc. (MKSI) based on the most recent data available:
| Metric | Jabil Inc. (JBL) | MKS Inc. (MKSI) |
|---|---|---|
| Market Risk | Beta 1.25, moderate volatility | Beta 1.92, high volatility |
| Debt Level | Debt-to-Equity 2.22 (unfavorable), Debt-to-Assets 18.15% (favorable) | Debt-to-Equity 2.06 (unfavorable), Debt-to-Assets 55.65% (unfavorable) |
| Regulatory Risk | Moderate, industry compliance required | Moderate, serving semiconductor and defense sectors |
| Operational Risk | Complex manufacturing services, large workforce (138K employees) | Specialized instruments, smaller workforce (10.2K employees) |
| Environmental Risk | Standard industry risks, global operations | Exposure in semiconductor manufacturing processes |
| Geopolitical Risk | Global supply chain exposure | High exposure due to semiconductor market and defense contracts |
The most likely and impactful risks are market volatility and high debt levels for both companies. MKSI shows higher market risk with a beta of 1.92 and significantly greater leverage, increasing financial vulnerability. JBL’s leverage is also concerning but offset partially by a lower debt-to-assets ratio. Operational complexity and global supply chains expose both firms to geopolitical and environmental uncertainties, with MKSI’s semiconductor focus adding sensitivity to regulatory and geopolitical shifts. Risk management should prioritize monitoring debt sustainability and market fluctuations.
Which Stock to Choose?
Jabil Inc. (JBL) shows a mixed income evolution with modest revenue growth but declines in gross profit and net margin over recent years, paired with strong profitability indicators such as a 43.4% ROE and efficient asset turnover. Its debt level is moderate with a net debt-to-EBITDA below 1, and the company holds a very favorable overall rating of B- supported by a very strong Piotroski score and a safe-zone Altman Z-score.
MKS Inc. (MKSI) presents a favorable income statement with a high gross margin (47.6%) and improving EBIT and net margin growth, despite an overall net income decline in the longer term. Profitability ratios are weaker, including an 8.2% ROE and a concerning high debt-to-equity ratio above 2, reflected in a very unfavorable moat status. MKSI’s rating is also B- but with a lower Altman Z-score in the grey zone and a strong Piotroski score.
Which stock is the most favorable for an investor might depend on the investor’s profile: those seeking quality and durability in value creation could find Jabil’s strong economic moat and profitability metrics appealing, while investors focused on recent operational improvements and growth potential might see MKS as a more dynamic option despite its financial risks.
Disclaimer: Investment carries a risk of loss of initial capital. The past performance is not a reliable indicator of future results. Be sure to understand risks before making an investment decision.
Go Further
I encourage you to read the complete analyses of Jabil Inc. and MKS Inc. to enhance your investment decisions: