Investors often seek growth and stability by comparing companies within the same industry, and today I focus on two intriguing players in the hardware and equipment sector: Jabil Inc. and MicroVision, Inc. Jabil stands out as a global manufacturing powerhouse with diverse electronics solutions, while MicroVision pioneers innovative lidar and display technologies targeting cutting-edge applications like autonomous driving and augmented reality. In this article, I will help you determine which company presents the most compelling investment opportunity for your portfolio.
Table of contents
Companies Overview
I will begin the comparison between Jabil Inc. and MicroVision, Inc. by providing an overview of these two companies and their main differences.
Jabil Inc. Overview
Jabil Inc. specializes in manufacturing services and solutions worldwide, operating through Electronics Manufacturing Services and Diversified Manufacturing Services segments. The company offers electronic design, production, product management, and various industrial design services. It serves diverse industries including 5G, automotive, healthcare, and mobility. Founded in 1966 and headquartered in Saint Petersburg, Florida, Jabil is a major player with a market cap of approximately 25.7B USD.
MicroVision, Inc. Overview
MicroVision, Inc. focuses on developing lidar sensors for automotive safety and autonomous driving, along with micro-display designs for augmented reality headsets. Its technology includes laser beam scanning and scanning technology for full-color images in compact modules. Founded in 1993 and based in Redmond, Washington, MicroVision is a smaller firm with a market cap near 288M USD. It primarily serves original equipment and design manufacturers.
Key similarities and differences
Both companies operate in the technology sector within hardware, equipment, and parts industries. Jabil offers broad manufacturing and design services across various sectors, while MicroVision is more specialized in lidar and scanning technologies for automotive and AR markets. Jabil has a significantly larger workforce and market capitalization, reflecting its scale and diversified business model compared to MicroVision’s niche focus and smaller size.
Income Statement Comparison
This table presents a straightforward comparison of key income statement metrics for Jabil Inc. and MicroVision, Inc. based on their most recent fiscal year filings.
| Metric | Jabil Inc. (JBL) | MicroVision, Inc. (MVIS) |
|---|---|---|
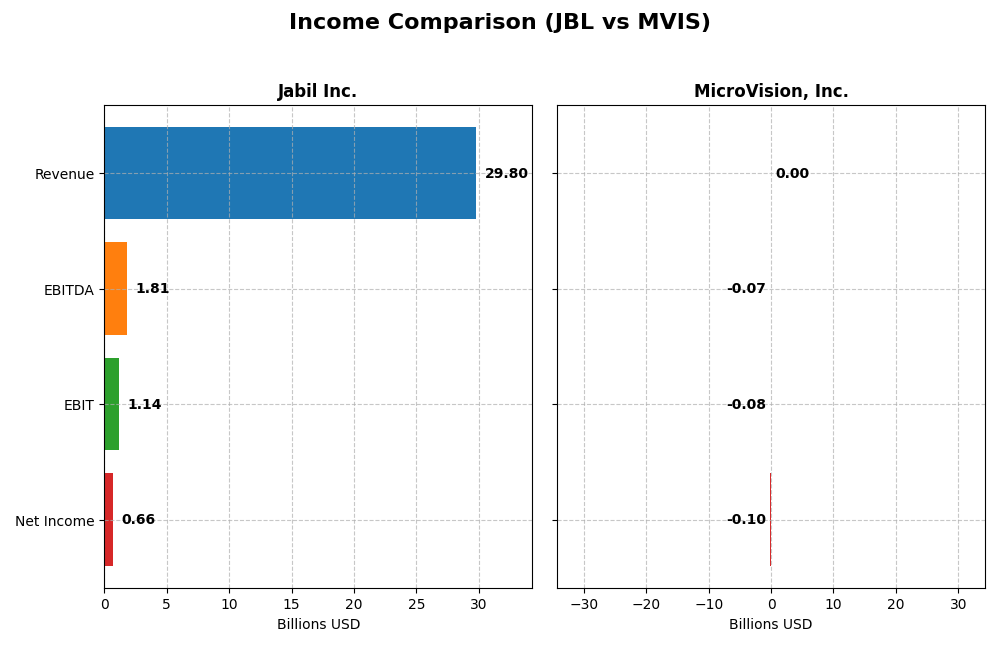
| Market Cap | 25.7B | 288M |
| Revenue | 29.8B | 4.7M |
| EBITDA | 1.81B | -71.0M |
| EBIT | 1.14B | -75.2M |
| Net Income | 657M | -97.0M |
| EPS | 6.00 | -0.46 |
| Fiscal Year | 2025 | 2024 |
Income Statement Interpretations
Jabil Inc.
Jabil Inc. showed modest revenue growth of 3.18% in 2025, reaching $29.8B, but net income dropped significantly by 54.13% to $657M. Gross and net margins remained stable but low at 8.88% and 2.2%, respectively. The recent year saw declining profitability and contracting EBIT margin, indicating margin pressure despite steady sales.
MicroVision, Inc.
MicroVision’s revenue declined sharply by 35.31% in 2024, falling to $4.7M, with net income continuing a significant loss of $97M. Margins were deeply negative, with gross margin at -60.35% and net margin at -2063.78%. Despite a slight EBIT improvement, the company struggles with unprofitable operations and negative margin trends over the period.
Which one has the stronger fundamentals?
Between Jabil and MicroVision, Jabil displays stronger fundamentals with positive revenue and net incomes, albeit with margin and profitability pressures. MicroVision faces severe losses and negative margins, reflecting high operational challenges. Both show unfavorable income statement evaluations, but Jabil’s scale and profitability metrics outpace MicroVision’s losses and negative growth.
Financial Ratios Comparison
The table below presents a side-by-side comparison of key financial ratios for Jabil Inc. and MicroVision, Inc. based on their most recent fiscal year data.
| Ratios | Jabil Inc. (JBL) 2025 | MicroVision, Inc. (MVIS) 2024 |
|---|---|---|
| ROE | 43.42% | -198.72% |
| ROIC | 16.06% | -83.73% |
| P/E | 34.14 | -2.83 |
| P/B | 14.82 | 5.63 |
| Current Ratio | 1.00 | 1.79 |
| Quick Ratio | 0.66 | 1.74 |
| D/E (Debt-to-Equity) | 2.22 | 1.06 |
| Debt-to-Assets | 18.15% | 42.62% |
| Interest Coverage | 4.84 | -19.19 |
| Asset Turnover | 1.61 | 0.04 |
| Fixed Asset Turnover | 9.01 | 0.20 |
| Payout Ratio | 5.48% | 0% |
| Dividend Yield | 0.16% | 0% |
Interpretation of the Ratios
Jabil Inc.
Jabil Inc. presents mixed financial ratios with strong returns on equity (43.42%) and invested capital (16.06%), alongside favorable asset turnover and fixed asset turnover ratios. However, concerns arise from a low net margin (2.2%), high price-to-book (14.82), and debt-to-equity ratio (2.22). The company pays dividends with a low yield (0.16%), indicating modest shareholder returns supported by a cautious payout ratio and limited buyback activity.
MicroVision, Inc.
MicroVision exhibits predominantly weak financial ratios, including large negative net margin (-2063.78%) and return on equity (-198.72%), reflecting ongoing losses. Liquidity ratios are favorable, with a current ratio of 1.79, yet debt-related ratios and interest coverage are concerning. The company does not pay dividends, consistent with its high R&D spend and reinvestment strategy aimed at growth and technology development.
Which one has the best ratios?
Overall, Jabil Inc. shows a more balanced and favorable financial profile with positive returns and manageable leverage despite some valuation and liquidity weaknesses. MicroVision’s ratios indicate significant operational and profitability challenges typical of a company in an intensive R&D phase, resulting in an unfavorable assessment compared to Jabil’s slightly unfavorable but stronger ratio set.
Strategic Positioning
This section compares the strategic positioning of Jabil Inc. and MicroVision, Inc., focusing on market position, key segments, and exposure to technological disruption:
JBL
- Large market cap of 25.7B in hardware, facing typical competitive pressures in manufacturing
- Diversified segments: Electronics Manufacturing Services and Diversified Manufacturing Services
- Moderate exposure to disruption via evolving electronics manufacturing and design services
MVIS
- Small market cap of 288M, in hardware with niche focus on lidar and micro-display technology
- Concentrated on lidar sensors, micro-displays, and scanning technology for automotive and AR
- High exposure with innovative lidar and scanning tech in emerging autonomous and AR markets
JBL vs MVIS Positioning
JBL pursues a diversified manufacturing services approach with broad industry applications, providing scale advantages. MVIS focuses on specialized lidar and display technologies, offering innovation potential but with narrower market reach and higher risk concentration.
Which has the best competitive advantage?
JBL demonstrates a very favorable moat with strong and growing ROIC above WACC, indicating durable competitive advantage. MVIS shows a slightly unfavorable moat, shedding value despite improving profitability, suggesting a weaker competitive position.
Stock Comparison
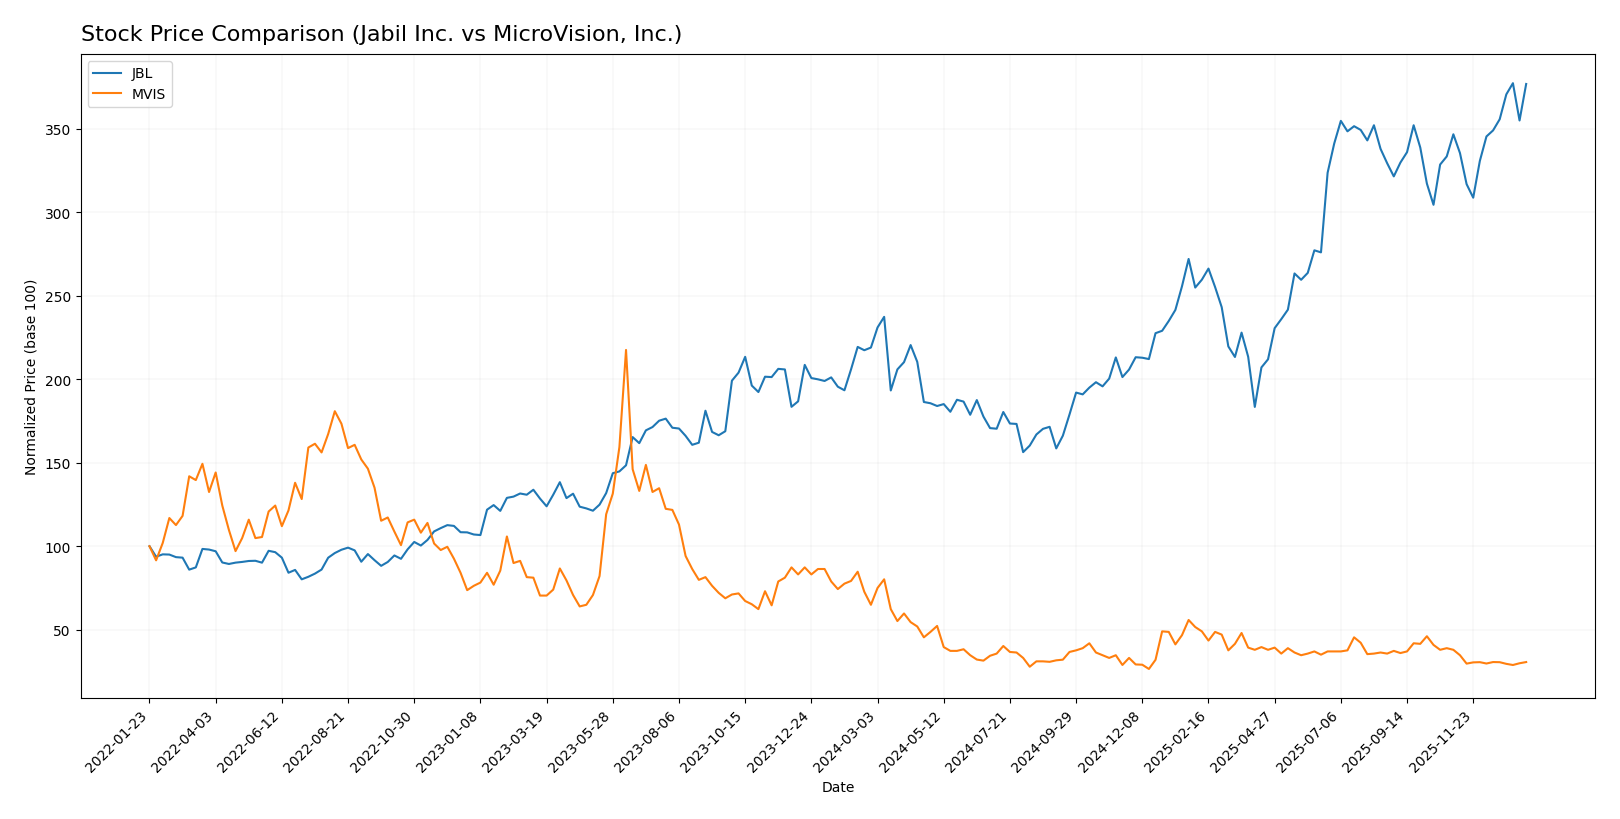
The past year has seen distinct price movements for Jabil Inc. (JBL) and MicroVision, Inc. (MVIS), with JBL experiencing a strong upward trajectory while MVIS faced a significant decline, reflecting contrasting trading dynamics.
Trend Analysis
Jabil Inc. (JBL) demonstrated a bullish trend over the past 12 months with a 72.08% price increase and accelerating momentum, reaching a high of 240.39 and a low of 99.62, supported by notable volatility (std deviation 42.7).
MicroVision, Inc. (MVIS) showed a bearish trend with a 52.8% price decrease and deceleration, hitting a peak of 2.47 and a bottom of 0.82, accompanied by very low volatility (std deviation 0.29).
Comparing both, JBL delivered the highest market performance with strong gains, while MVIS underperformed significantly over the same period.
Target Prices
The consensus target prices from recognized analysts indicate a positive outlook for both companies.
| Company | Target High | Target Low | Consensus |
|---|---|---|---|
| Jabil Inc. | 283 | 244 | 260.5 |
| MicroVision, Inc. | 5 | 5 | 5 |
Analysts expect Jabil Inc.’s stock to appreciate modestly above its current price of 240.62 USD, while MicroVision, Inc. shows a target consensus significantly higher than its current price of 0.9441 USD, suggesting strong growth potential.
Analyst Opinions Comparison
This section compares analysts’ ratings and financial scores for Jabil Inc. and MicroVision, Inc.:
Rating Comparison
JBL Rating
- Rating: B- indicating a very favorable status
- Discounted Cash Flow Score: 3, moderate level
- ROE Score: 5, very favorable
- ROA Score: 3, moderate
- Debt To Equity Score: 1, very unfavorable
- Overall Score: 3, moderate
MVIS Rating
- Rating: C- indicating a very favorable status
- Discounted Cash Flow Score: 1, very unfavorable
- ROE Score: 1, very unfavorable
- ROA Score: 1, very unfavorable
- Debt To Equity Score: 2, moderate
- Overall Score: 1, very unfavorable
Which one is the best rated?
Based solely on provided data, Jabil Inc. holds higher ratings and superior financial scores in ROE, ROA, and overall assessment compared to MicroVision, Inc., which shows mostly very unfavorable scores except a moderate debt-to-equity score.
Scores Comparison
Here is a comparison of the financial scores for Jabil Inc. and MicroVision, Inc.:
JBL Scores
- Altman Z-Score: 3.09, indicating a safe zone with low bankruptcy risk.
- Piotroski Score: 8, signaling very strong financial health.
MVIS Scores
- Altman Z-Score: -6.42, placing the company in the distress zone.
- Piotroski Score: 1, indicating very weak financial health.
Which company has the best scores?
Based on the provided data, Jabil Inc. has significantly better scores with a safe-zone Altman Z-Score and a very strong Piotroski Score, unlike MicroVision which is in distress and has a very weak Piotroski Score.
Grades Comparison
Here is a detailed comparison of the latest grades assigned to Jabil Inc. and MicroVision, Inc.:
Jabil Inc. Grades
The following table summarizes recent grades from recognized grading companies for Jabil Inc.:
| Grading Company | Action | New Grade | Date |
|---|---|---|---|
| JP Morgan | Maintain | Overweight | 2025-12-18 |
| UBS | Maintain | Neutral | 2025-12-18 |
| Barclays | Maintain | Overweight | 2025-12-18 |
| B of A Securities | Maintain | Buy | 2025-12-10 |
| Barclays | Maintain | Overweight | 2025-09-26 |
| B of A Securities | Maintain | Buy | 2025-09-26 |
| JP Morgan | Maintain | Overweight | 2025-07-17 |
| B of A Securities | Maintain | Buy | 2025-06-20 |
| UBS | Maintain | Neutral | 2025-06-18 |
| JP Morgan | Maintain | Overweight | 2025-06-18 |
Jabil Inc.’s grades consistently indicate favorable outlooks, with multiple “Overweight” and “Buy” ratings maintained over recent months, showing steady analyst confidence.
MicroVision, Inc. Grades
The following table summarizes recent grades from recognized grading companies for MicroVision, Inc.:
| Grading Company | Action | New Grade | Date |
|---|---|---|---|
| D. Boral Capital | Maintain | Buy | 2025-12-16 |
| D. Boral Capital | Maintain | Buy | 2025-11-12 |
| WestPark Capital | Maintain | Buy | 2025-10-21 |
| WestPark Capital | Maintain | Buy | 2025-09-05 |
| D. Boral Capital | Maintain | Buy | 2025-09-02 |
| WestPark Capital | Maintain | Buy | 2025-08-27 |
| D. Boral Capital | Maintain | Buy | 2025-08-11 |
| D. Boral Capital | Maintain | Buy | 2025-05-21 |
| D. Boral Capital | Maintain | Buy | 2025-05-13 |
| WestPark Capital | Maintain | Buy | 2025-03-27 |
MicroVision, Inc. shows a strong and consistent “Buy” rating from its grading companies, reflecting sustained positive analyst sentiment.
Which company has the best grades?
MicroVision, Inc. holds a clear consensus of “Buy” ratings, while Jabil Inc. has a mixed consensus leaning toward “Hold” with some “Buy” and “Overweight” ratings. This suggests MicroVision’s grades may reflect a more uniformly positive outlook, potentially influencing investor confidence differently than Jabil’s more balanced evaluations.
Strengths and Weaknesses
Below is a comparative overview of key strengths and weaknesses for Jabil Inc. (JBL) and MicroVision, Inc. (MVIS) based on the most recent financial and operational data.
| Criterion | Jabil Inc. (JBL) | MicroVision, Inc. (MVIS) |
|---|---|---|
| Diversification | Highly diversified across Connected Living, Intelligent Infrastructure, and Regulated Industries segments, with revenues exceeding $30B in 2025 | Limited diversification; primarily focused on contract, license, and product revenues totaling under $5M in 2024 |
| Profitability | Positive ROIC at 16.06%, ROE at 43.42%, but low net margin at 2.2%, indicating some margin pressure | Negative profitability metrics: net margin at -2063.78%, ROIC at -83.73%, ROE at -198.72%, showing heavy losses |
| Innovation | Demonstrates a very favorable moat with growing ROIC trend, indicating sustainable competitive advantages | Slightly unfavorable moat, though ROIC trend is improving; still value destructive overall |
| Global presence | Strong global operations with large-scale infrastructure and commerce segments | Smaller scale with less global reach; mainly technology licensing and product sales |
| Market Share | Significant market share in diversified manufacturing services | Niche market focus with limited scale and market penetration |
Key takeaways: Jabil’s diversified business model and strong capital efficiency underpin its durable competitive advantage, despite some margin challenges. MicroVision remains a high-risk investment due to sustained losses and limited scale, although profitability trends show some improvement. Investors should weigh Jabil’s stability against MicroVision’s growth potential and risk.
Risk Analysis
Below is a comparative risk table for Jabil Inc. (JBL) and MicroVision, Inc. (MVIS) based on the most recent available data:
| Metric | Jabil Inc. (JBL) | MicroVision, Inc. (MVIS) |
|---|---|---|
| Market Risk | Moderate beta (1.25), stable large-cap (25.7B market cap) | High beta (1.27), small-cap (288M market cap), volatile price |
| Debt level | High debt-to-equity (2.22, unfavorable), moderate debt-to-assets (18.15%) | Moderate debt-to-equity (1.06), high debt-to-assets (42.62%) |
| Regulatory Risk | Moderate, operates globally in manufacturing with compliance needs | Elevated, lidar and AR tech subject to evolving regulations and standards |
| Operational Risk | Large-scale manufacturing complexity, supply chain sensitivity | Early-stage tech development, product commercialization risks |
| Environmental Risk | Moderate, manufacturing impacts and sustainability pressures | Moderate, tech hardware production and energy use concerns |
| Geopolitical Risk | Exposure to global supply chains and trade tensions | Limited but vulnerable due to niche tech market and supply dependencies |
In synthesis, MicroVision faces the most impactful risks due to its financial distress indicated by a negative net margin (-2063.78%), poor Altman Z-score (distress zone), and weak operational scale. Jabil, while exposed to high leverage and market fluctuations, shows financial stability with a safe Altman Z-score and strong operational metrics, making its risks more manageable. Investors should weigh MicroVision’s high innovation potential against significant financial and operational risks, whereas Jabil offers a more balanced risk profile but at a higher valuation.
Which Stock to Choose?
Jabil Inc. (JBL) shows moderate income growth but a predominantly unfavorable income statement trend over 2021-2025, with mixed financial ratios including strong ROE (43.42%) and ROIC (16.06%) but elevated debt levels and some unfavorable valuation metrics. Its MOAT evaluation is very favorable, indicating durable competitive advantage and value creation, supported by a safe-zone Altman Z-Score and a very strong Piotroski score.
MicroVision, Inc. (MVIS) exhibits significant revenue volatility and predominantly unfavorable income statement metrics from 2020-2024, with negative profitability ratios such as ROE and ROIC, and a high proportion of unfavorable financial ratios. Its MOAT status is slightly unfavorable, reflecting value destruction despite improving profitability, accompanied by a distress-zone Altman Z-Score and a very weak Piotroski score.
For investors prioritizing financial stability and proven value creation, Jabil’s strong MOAT and creditworthiness might appear more favorable, while those with a higher risk tolerance and interest in turnaround potential could interpret MicroVision’s improving ROIC trend as a sign of possible recovery. Overall, the ratings and income evaluations suggest contrasting profiles suited to different investment strategies.
Disclaimer: Investment carries a risk of loss of initial capital. The past performance is not a reliable indicator of future results. Be sure to understand risks before making an investment decision.
Go Further
I encourage you to read the complete analyses of Jabil Inc. and MicroVision, Inc. to enhance your investment decisions: