Choosing the right investment in the competitive hardware and equipment sector requires careful analysis. Jabil Inc. (JBL) and Mesa Laboratories, Inc. (MLAB) are two notable players offering distinct approaches: Jabil with broad electronics manufacturing services and Mesa focusing on specialized life sciences tools and quality control products. This article compares their market positions and innovation strategies to reveal which company presents the most compelling opportunity for investors today.

Table of contents
Companies Overview
I will begin the comparison between Jabil Inc. and Mesa Laboratories, Inc. by providing an overview of these two companies and their main differences.
Jabil Inc. Overview
Jabil Inc. is a global provider of manufacturing services and solutions, operating in Electronics Manufacturing Services and Diversified Manufacturing Services. The company focuses on electronics design, production, and product management for sectors like 5G, automotive, healthcare, and industrial markets. Founded in 1966 and headquartered in Saint Petersburg, Florida, Jabil employs approximately 138,000 people and is listed on the NYSE with a market cap of 25.6B USD.
Mesa Laboratories, Inc. Overview
Mesa Laboratories, Inc. develops and sells life sciences tools and quality control products, targeting sterilization, biopharmaceutical development, calibration solutions, and clinical genomics. The company serves healthcare, pharmaceutical, and laboratory environments with innovative testing and monitoring equipment. Founded in 1982 and headquartered in Lakewood, Colorado, Mesa has 736 employees and trades on NASDAQ with a market cap of 462M USD.
Key similarities and differences
Both Jabil and Mesa operate within the technology sector, specifically in hardware, equipment, and parts. However, Jabil emphasizes large-scale manufacturing services across diverse industries, while Mesa specializes in niche life sciences and quality control products. Jabil’s business model is broad and global with a workforce exceeding 138,000, contrasting with Mesa’s focused approach and smaller scale with fewer than 1,000 employees.
Income Statement Comparison
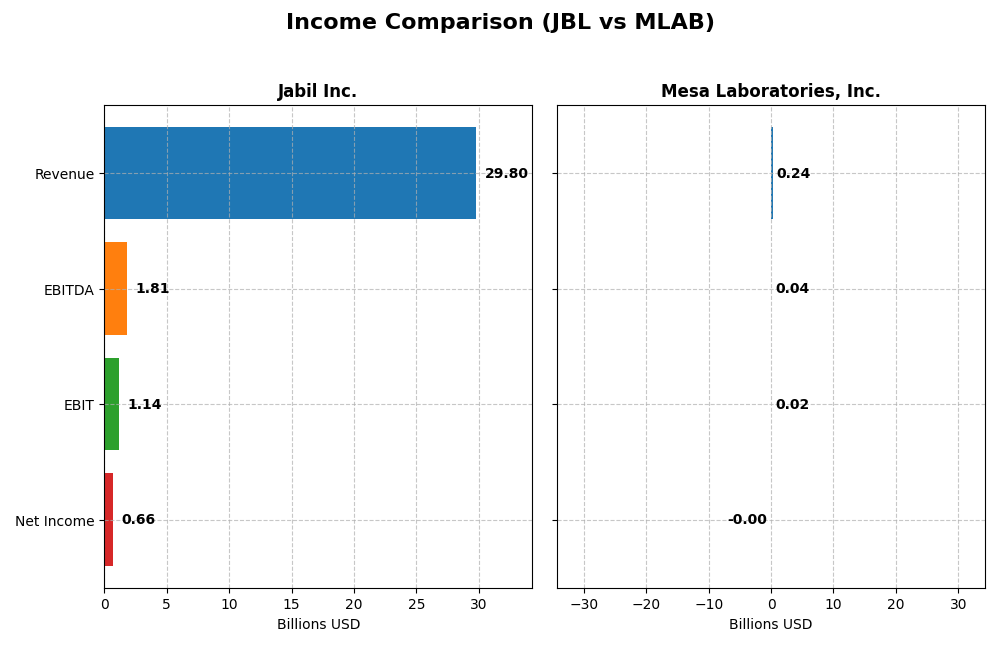
This table provides a side-by-side comparison of key income statement metrics for Jabil Inc. and Mesa Laboratories, Inc. for their most recent fiscal years.
| Metric | Jabil Inc. (JBL) | Mesa Laboratories, Inc. (MLAB) |
|---|---|---|
| Market Cap | 25.6B | 462M |
| Revenue | 29.8B | 241M |
| EBITDA | 1.81B | 42.3M |
| EBIT | 1.14B | 17.8M |
| Net Income | 657M | -1.97M |
| EPS | 6.00 | -0.36 |
| Fiscal Year | 2025 | 2025 |
Income Statement Interpretations
Jabil Inc.
Jabil Inc. shows a mixed trend in revenue and net income from 2021 to 2025, with revenue slightly growing by 1.77% overall but net income declining by 5.6%. Margins display stability; gross margin is neutral at 8.88%, while net margin holds at 2.2%. The latest fiscal year saw slowed revenue growth (3.18%) and a significant drop in net income and margins, signaling profitability pressures.
Mesa Laboratories, Inc.
Mesa Laboratories experienced strong revenue growth at 79.92% over the period, with a favorable gross margin of 62.61%. However, net margin remains negative at -0.82%, reflecting challenges in profitability. The most recent year highlighted robust improvements across revenue (11.47%), EBIT (106.6%), and net margin (99.3%), indicating operational gains despite ongoing net losses overall.
Which one has the stronger fundamentals?
Mesa Laboratories presents a favorable income statement with strong revenue and operating income growth, supported by high gross margins. Jabil shows stable margins but declining net income and weaker growth metrics. Despite Mesa’s negative net margin, its recent improvements contrast with Jabil’s unfavorable income trends, suggesting differing strengths and risks in their fundamentals.
Financial Ratios Comparison
The table below presents a side-by-side comparison of key financial ratios for Jabil Inc. and Mesa Laboratories, Inc., based on their most recent fiscal year data.
| Ratios | Jabil Inc. (JBL, FY 2025) | Mesa Laboratories, Inc. (MLAB, FY 2025) |
|---|---|---|
| ROE | 43.4% | -1.24% |
| ROIC | 16.1% | -1.45% |
| P/E | 34.1 | -326.3 |
| P/B | 14.8 | 4.03 |
| Current Ratio | 1.00 | 0.63 |
| Quick Ratio | 0.66 | 0.47 |
| D/E | 2.22 | 1.14 |
| Debt-to-Assets | 18.2% | 41.9% |
| Interest Coverage | 4.84 | 1.38 |
| Asset Turnover | 1.61 | 0.56 |
| Fixed Asset Turnover | 9.01 | 7.45 |
| Payout Ratio | 5.5% | -176% |
| Dividend Yield | 0.16% | 0.54% |
Interpretation of the Ratios
Jabil Inc.
Jabil’s financial ratios present a mixed picture with strengths in return on equity (43.42%) and return on invested capital (16.06%), indicating efficient capital use. However, concerns arise from a low net margin (2.2%) and high price-to-book ratio (14.82), suggesting valuation risk. The current ratio is neutral at 1.0, but a quick ratio of 0.66 and debt-to-equity of 2.22 are less favorable. The company pays a modest dividend with a low yield of 0.16%, reflecting conservative shareholder returns amid a slight overall unfavorable ratio stance.
Mesa Laboratories, Inc.
Mesa Laboratories shows considerable challenges with negative profitability indicators: net margin at -0.82%, return on equity at -1.24%, and return on invested capital at -1.45%. Liquidity ratios are weak, with a current ratio of 0.63 and quick ratio of 0.47, while debt levels remain high relative to equity (debt-to-equity 1.14). Despite a dividend yield of 0.54%, the payout is risky given the financial strain and negative earnings, contributing to an overall unfavorable ratio profile for the company.
Which one has the best ratios?
Comparing the two, Jabil Inc. exhibits stronger profitability and capital efficiency ratios, though it faces some valuation and liquidity concerns. Mesa Laboratories struggles with negative returns and weaker liquidity, coupled with a riskier dividend payout. Overall, Jabil’s ratios appear more favorable relative to Mesa’s predominantly unfavorable financial metrics and operational challenges.
Strategic Positioning
This section compares the strategic positioning of Jabil Inc. and Mesa Laboratories, Inc., focusing on market position, key segments, and exposure to technological disruption:
Jabil Inc.
- Large market cap of $25.6B, faces competitive pressure in diversified manufacturing and electronics services.
- Operates multiple segments including Electronics Manufacturing Services and Diversified Manufacturing Services, serving various industries like 5G, automotive, healthcare, and more.
- Exposed to technological disruption through electronics design, rapid prototyping, and advanced manufacturing services.
Mesa Laboratories, Inc.
- Smaller market cap of $462M, operates in specialized life sciences hardware and quality control markets.
- Focused on life sciences tools, sterilization control, biopharmaceutical development, calibration, and clinical genomics.
- Faces disruption risks mainly in life sciences automation and genomic testing technologies.
Jabil Inc. vs Mesa Laboratories, Inc. Positioning
Jabil’s approach is highly diversified across multiple industries and manufacturing services, providing broad revenue streams but also higher operational complexity. Mesa Labs concentrates on life sciences and quality control, enabling focused innovation but potentially limiting market breadth.
Which has the best competitive advantage?
Jabil demonstrates a very favorable moat with growing ROIC and value creation, indicating a durable competitive advantage. Mesa Laboratories shows a very unfavorable moat with declining ROIC, suggesting challenges in sustaining its competitive position.
Stock Comparison
The stock price chart highlights significant divergence in performance and trading dynamics between Jabil Inc. and Mesa Laboratories, Inc. over the past 12 months, illustrating contrasting bullish and bearish trends.

Trend Analysis
Jabil Inc. (JBL) recorded a strong bullish trend with a 72.08% price increase over the past year, showing acceleration and notable price volatility with a standard deviation of 42.7. The stock hit a high of 240.39 and a low of 99.62.
Mesa Laboratories, Inc. (MLAB) experienced a bearish trend with a 20.42% price decline over the same period, also accelerating but with lower volatility at a 23.27 standard deviation. Its price ranged between 61.66 and 147.79.
Comparing the two, Jabil Inc. delivered the highest market performance with a substantial positive return, whereas Mesa Laboratories showed a marked decrease, reflecting divergent investor sentiment and market reception.
Target Prices
The current target price consensus reflects moderate upside potential for both companies.
| Company | Target High | Target Low | Consensus |
|---|---|---|---|
| Jabil Inc. | 283 | 244 | 260.5 |
| Mesa Laboratories, Inc. | 83 | 83 | 83 |
Analysts expect Jabil Inc.’s price to rise modestly above its current 240.11 USD, while Mesa Laboratories, Inc.’s consensus target is slightly below its current 83.7 USD, indicating limited near-term upside.
Analyst Opinions Comparison
This section compares analysts’ ratings and grades for Jabil Inc. and Mesa Laboratories, Inc.:
Rating Comparison
JBL Rating
- Rating: B-, considered very favorable overall.
- Discounted Cash Flow Score: Moderate at 3, indicating balanced valuation.
- ROE Score: Very favorable at 5, showing strong profit generation efficiency.
- ROA Score: Moderate at 3, reflecting average asset utilization.
- Debt To Equity Score: Very unfavorable at 1, indicating high financial risk.
- Overall Score: Moderate at 3, reflecting an average financial standing.
MLAB Rating
- Rating: C+, considered very favorable overall.
- Discounted Cash Flow Score: Very favorable at 5, suggesting undervaluation.
- ROE Score: Very unfavorable at 1, indicating weak profitability from equity.
- ROA Score: Very unfavorable at 1, showing poor asset utilization.
- Debt To Equity Score: Very unfavorable at 1, also indicating high financial risk.
- Overall Score: Moderate at 2, reflecting below-average financial standing.
Which one is the best rated?
Jabil Inc. holds a higher overall rating (B-) and stronger ROE and ROA scores compared to Mesa Laboratories, Inc., which has a lower overall rating (C+) and weaker profitability metrics. However, both face similar high financial risk based on debt-to-equity scores.
Scores Comparison
Here is a comparison of the Altman Z-Score and Piotroski Score for Jabil Inc. and Mesa Laboratories, Inc.:
JBL Scores
- Altman Z-Score: 3.09, indicating a safe zone with low bankruptcy risk.
- Piotroski Score: 8, classified as very strong financial health.
MLAB Scores
- Altman Z-Score: 1.36, in distress zone, signaling high bankruptcy risk.
- Piotroski Score: 5, representing average financial strength.
Which company has the best scores?
Jabil Inc. holds stronger scores than Mesa Laboratories, with a safe zone Altman Z-Score and a very strong Piotroski Score, versus MLAB’s distress zone and average Piotroski Score.
Grades Comparison
This section compares the latest reliable grades assigned to Jabil Inc. and Mesa Laboratories, Inc.:
Jabil Inc. Grades
Below is a summary of recent grades for Jabil Inc. from established financial institutions.
| Grading Company | Action | New Grade | Date |
|---|---|---|---|
| JP Morgan | Maintain | Overweight | 2025-12-18 |
| UBS | Maintain | Neutral | 2025-12-18 |
| Barclays | Maintain | Overweight | 2025-12-18 |
| B of A Securities | Maintain | Buy | 2025-12-10 |
The overall trend for Jabil Inc. shows a consistent overweight or buy stance from major banks, indicating moderate confidence in the stock’s performance.
Mesa Laboratories, Inc. Grades
The following table presents recent grades for Mesa Laboratories, Inc. from recognized grading companies.
| Grading Company | Action | New Grade | Date |
|---|---|---|---|
| Wells Fargo | Maintain | Equal Weight | 2025-12-15 |
| Evercore ISI Group | Maintain | Outperform | 2024-10-01 |
Mesa Laboratories, Inc. displays a mixed grading trend with Wells Fargo maintaining an equal weight rating, while Evercore ISI Group consistently rates it as outperform.
Which company has the best grades?
Jabil Inc. has received stronger grades overall, with multiple overweight and buy ratings compared to Mesa Laboratories’ equal weight and outperform ratings. This suggests Jabil may currently be viewed more favorably by analysts, potentially influencing investor confidence and portfolio positioning.
Strengths and Weaknesses
Below is a comparison of key strengths and weaknesses for Jabil Inc. (JBL) and Mesa Laboratories, Inc. (MLAB) based on the most recent data.
| Criterion | Jabil Inc. (JBL) | Mesa Laboratories, Inc. (MLAB) |
|---|---|---|
| Diversification | Highly diversified across Connected Living, Intelligent Infrastructure, and Regulated Industries with revenues of $5.6B, $12.3B, and $11.9B respectively in 2025 | Less diversified; main revenue from Product segment ($198M) and Service ($43M) in 2025 |
| Profitability | Favorable ROIC (16.1%) and ROE (43.4%) but low net margin (2.2%) | Unfavorable profitability with negative ROIC (-1.45%), ROE (-1.24%), and net margin (-0.82%) |
| Innovation | Demonstrates durable competitive advantage with growing ROIC and strong asset turnover (1.61) | Declining ROIC trend and profitability indicate challenges sustaining innovation |
| Global presence | Large global footprint supported by broad product segments and high revenue scale | Smaller scale, likely more regional with less diversified global exposure |
| Market Share | Strong market position supported by high revenue ($30B+ total across segments) | Smaller market presence with annual revenue under $250M |
Jabil Inc. exhibits solid diversification and a durable competitive advantage with growing profitability, though margin improvement is needed. Mesa Laboratories faces challenges with declining profitability and limited diversification, posing higher risks for investors.
Risk Analysis
Below is a comparative risk table for Jabil Inc. (JBL) and Mesa Laboratories, Inc. (MLAB) based on the most recent 2025 data:
| Metric | Jabil Inc. (JBL) | Mesa Laboratories, Inc. (MLAB) |
|---|---|---|
| Market Risk | Beta 1.25 (moderate) | Beta 0.89 (lower volatility) |
| Debt level | Debt/Equity 2.22 (high) | Debt/Equity 1.14 (moderate) |
| Regulatory Risk | Moderate (tech manufacturing) | Moderate (life sciences tools) |
| Operational Risk | High (large global ops) | Moderate (smaller scale, niche) |
| Environmental Risk | Moderate (manufacturing impact) | Low to moderate (laboratory focus) |
| Geopolitical Risk | Moderate (global supply chain exposure) | Low (more regional focus) |
The most impactful risks for Jabil Inc. are its elevated debt level and operational complexity due to its extensive global manufacturing footprint. Despite a solid Altman Z-Score indicating financial stability, its high leverage and quick ratio below 1 indicate liquidity concerns. Mesa Laboratories faces higher financial distress risk with an Altman Z-Score in the distress zone, negative profitability ratios, and weak liquidity ratios, making debt servicing a notable concern. Market risk is more pronounced for Jabil due to its higher beta, while Mesa’s smaller scale limits operational and geopolitical risks but does not offset its financial weaknesses. Investors should weigh Jabil’s leverage and operational scale against Mesa’s financial fragility when considering risk exposure.
Which Stock to Choose?
Jabil Inc. (JBL) shows a slightly unfavorable income statement with declining profitability despite stable revenue growth. It maintains strong returns on equity (43.4%) and invested capital (16.1%). Debt levels are moderate with a net debt to EBITDA of 0.79, and its overall rating is very favorable (B-).
Mesa Laboratories, Inc. (MLAB) presents a favorable income growth profile over the last year but with negative net margin and returns on equity (-1.24%) and invested capital (-1.45%). The company carries higher leverage (net debt to EBITDA 3.64) and has a very unfavorable overall financial ratio evaluation, though it holds a very favorable rating (C+).
Considering rating and financial performance, JBL’s durable competitive advantage and value creation might appeal to risk-averse or quality-focused investors, while MLAB’s recent income growth and potential turnaround could be of interest to risk-tolerant or growth-seeking investors. Each stock’s profile suggests different risk and return characteristics.
Disclaimer: Investment carries a risk of loss of initial capital. The past performance is not a reliable indicator of future results. Be sure to understand risks before making an investment decision.
Go Further
I encourage you to read the complete analyses of Jabil Inc. and Mesa Laboratories, Inc. to enhance your investment decisions: