In today’s fast-evolving technology sector, selecting the right hardware and equipment company is key for savvy investors. Keysight Technologies, Inc. (KEYS) and Jabil Inc. (JBL) both operate in the hardware industry but with distinct focuses—Keysight specializes in electronic design and test solutions, while Jabil excels in manufacturing and supply chain services. This article will analyze their strategies and market positions to help you decide which presents the most compelling investment opportunity.
Table of contents
Companies Overview
I will begin the comparison between Keysight Technologies and Jabil by providing an overview of these two companies and their main differences.
Keysight Technologies Overview
Keysight Technologies, Inc. specializes in electronic design and test solutions across various industries, including communications, aerospace, automotive, and semiconductor sectors. Founded in 1939 and headquartered in Santa Rosa, California, Keysight operates in the Hardware, Equipment & Parts industry and offers a broad portfolio of test platforms, software, and measurement instruments. The company serves global markets through direct sales and distribution channels.
Jabil Overview
Jabil Inc. is a global provider of manufacturing services and solutions, focusing on electronics and diversified manufacturing. Founded in 1966 and based in Saint Petersburg, Florida, Jabil operates in the Hardware, Equipment & Parts sector. Its services include electronics design, production, product management, and testing for industries such as 5G, automotive, healthcare, and mobility. Jabil emphasizes system assembly, design validation, and manufacturing test solutions.
Key similarities and differences
Both Keysight and Jabil operate in the technology sector within the Hardware, Equipment & Parts industry, serving a broad range of industrial and commercial clients. Keysight focuses primarily on electronic design automation and testing equipment, while Jabil emphasizes manufacturing services, product design, and assembly solutions. Keysight’s workforce is significantly smaller, with 15.4K employees compared to Jabil’s 138K, reflecting their differing operational scopes.
Income Statement Comparison
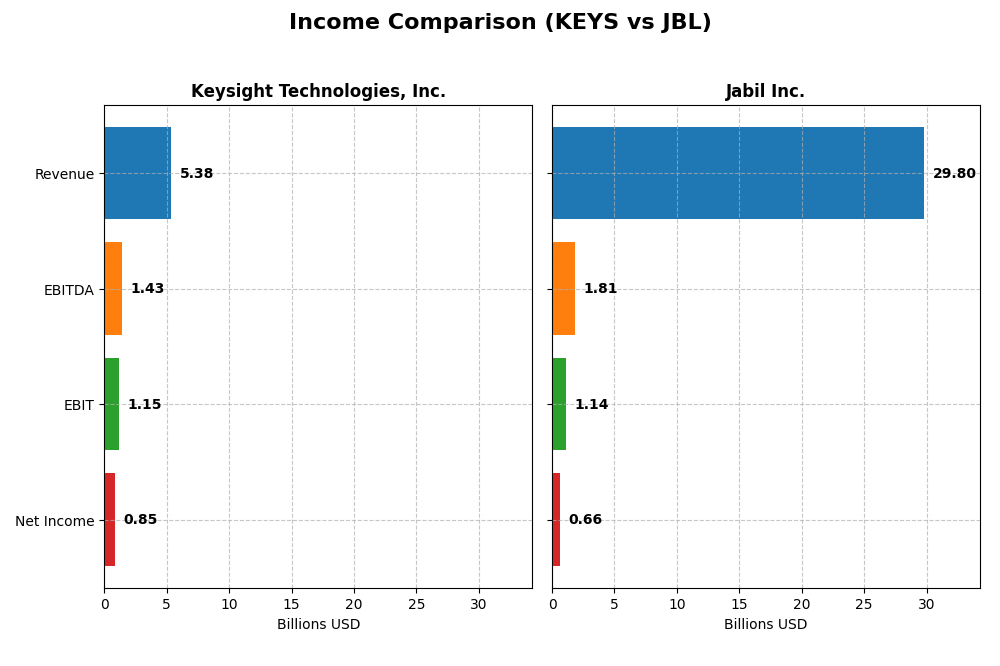
Below is a side-by-side comparison of key income statement metrics for Keysight Technologies, Inc. and Jabil Inc. for their most recent fiscal years.
| Metric | Keysight Technologies, Inc. | Jabil Inc. |
|---|---|---|
| Market Cap | 36B | 25.5B |
| Revenue | 5.38B | 29.8B |
| EBITDA | 1.43B | 1.81B |
| EBIT | 1.15B | 1.14B |
| Net Income | 846M | 657M |
| EPS | 4.9 | 6 |
| Fiscal Year | 2025 | 2025 |
Income Statement Interpretations
Keysight Technologies, Inc.
Keysight’s revenue showed a generally positive trend from 2021 to 2025, increasing from $4.94B to $5.38B, with net income fluctuating and declining overall by 5.37% over the period. Margins remained strong, with a favorable gross margin of 62.08% and improving net margin to 15.74% in 2025. The latest year saw 7.95% revenue growth and a 27.63% net margin increase, indicating margin improvement despite slower top-line gains.
Jabil Inc.
Jabil’s revenue experienced modest growth from $29.3B in 2021 to $29.8B in 2025, while net income declined by 5.6% over the same period. Margins are notably lower and less stable, with gross margin at 8.88% and net margin at 2.2% in 2025, both considered neutral. The most recent year showed a 3.18% revenue increase but a significant drop in EBIT (-40.96%) and net margin (-54.13%), reflecting deteriorating profitability.
Which one has the stronger fundamentals?
Keysight demonstrates stronger fundamentals, supported by higher and improving margins, favorable growth in operating income and net margin, and a generally positive income statement evaluation. In contrast, Jabil’s profitability margins are low and declining, with unfavorable trends in key income metrics and a predominantly negative income statement assessment, indicating weaker financial health over the period.
Financial Ratios Comparison
Below is a comparison of key financial ratios for Keysight Technologies, Inc. and Jabil Inc. based on their most recent fiscal year data.
| Ratios | Keysight Technologies, Inc. (2025) | Jabil Inc. (2025) |
|---|---|---|
| ROE | 14.40% | 43.42% |
| ROIC | 7.98% | 16.06% |
| P/E | 37.41 | 34.14 |
| P/B | 5.39 | 14.82 |
| Current Ratio | 2.35 | 1.00 |
| Quick Ratio | 1.78 | 0.66 |
| D/E | 0.51 | 2.22 |
| Debt-to-Assets | 26.31% | 18.15% |
| Interest Coverage | 9.88 | 4.84 |
| Asset Turnover | 0.48 | 1.61 |
| Fixed Asset Turnover | 5.21 | 9.01 |
| Payout ratio | 0% | 5.48% |
| Dividend yield | 0% | 0.16% |
Interpretation of the Ratios
Keysight Technologies, Inc.
Keysight Technologies displays a mix of favorable and unfavorable financial ratios, with a slightly favorable global opinion. Strong liquidity is evident from a current ratio of 2.35 and interest coverage near 12. However, valuation ratios such as PE at 37.41 and PB at 5.39 raise caution. The company does not pay dividends, consistent with a possible reinvestment or growth strategy.
Jabil Inc.
Jabil shows strong profitability ratios like ROE of 43.42% and ROIC of 16.06%, but weaker liquidity metrics with a current ratio of 1.0 and quick ratio of 0.66. Its leverage is high, with a debt-to-equity ratio of 2.22. The valuation multiples are elevated, and the dividend yield is low at 0.16%, reflecting a modest dividend payout alongside some risk from financial leverage.
Which one has the best ratios?
Evaluating both, Keysight holds an edge with stronger liquidity and more balanced debt metrics, despite higher valuation multiples. Jabil excels in profitability but faces challenges with liquidity and leverage. The global ratio opinions favor Keysight slightly, indicating a more stable financial profile relative to Jabil’s mixed results.
Strategic Positioning
This section compares the strategic positioning of Keysight Technologies and Jabil, including Market position, Key segments, and Exposure to technological disruption:
Keysight Technologies, Inc.
- Leading in electronic design and test solutions under competitive pressure in hardware sector.
- Focuses on Communications Solutions and Electronic Industrial Solutions groups driving revenue.
- Positioned in advanced test and measurement technology, exposed to evolving electronic and software technologies.
Jabil Inc.
- Global manufacturing services provider facing diverse competition in electronics and industrial segments.
- Operates Electronics Manufacturing Services and Diversified Manufacturing Services segments with broad industry coverage.
- Engages in complex manufacturing and design services, exposed to technological changes in electronics and industrial design.
Keysight Technologies, Inc. vs Jabil Inc. Positioning
Keysight pursues a specialized approach centered on electronic design and test solutions, while Jabil adopts a diversified manufacturing services model across multiple industries. Keysight’s focused segments contrast with Jabil’s broader business drivers and market coverage.
Which has the best competitive advantage?
Jabil shows a very favorable moat with growing ROIC above WACC, indicating durable competitive advantage. Keysight displays a very unfavorable moat with declining ROIC below WACC, signaling value destruction.
Stock Comparison
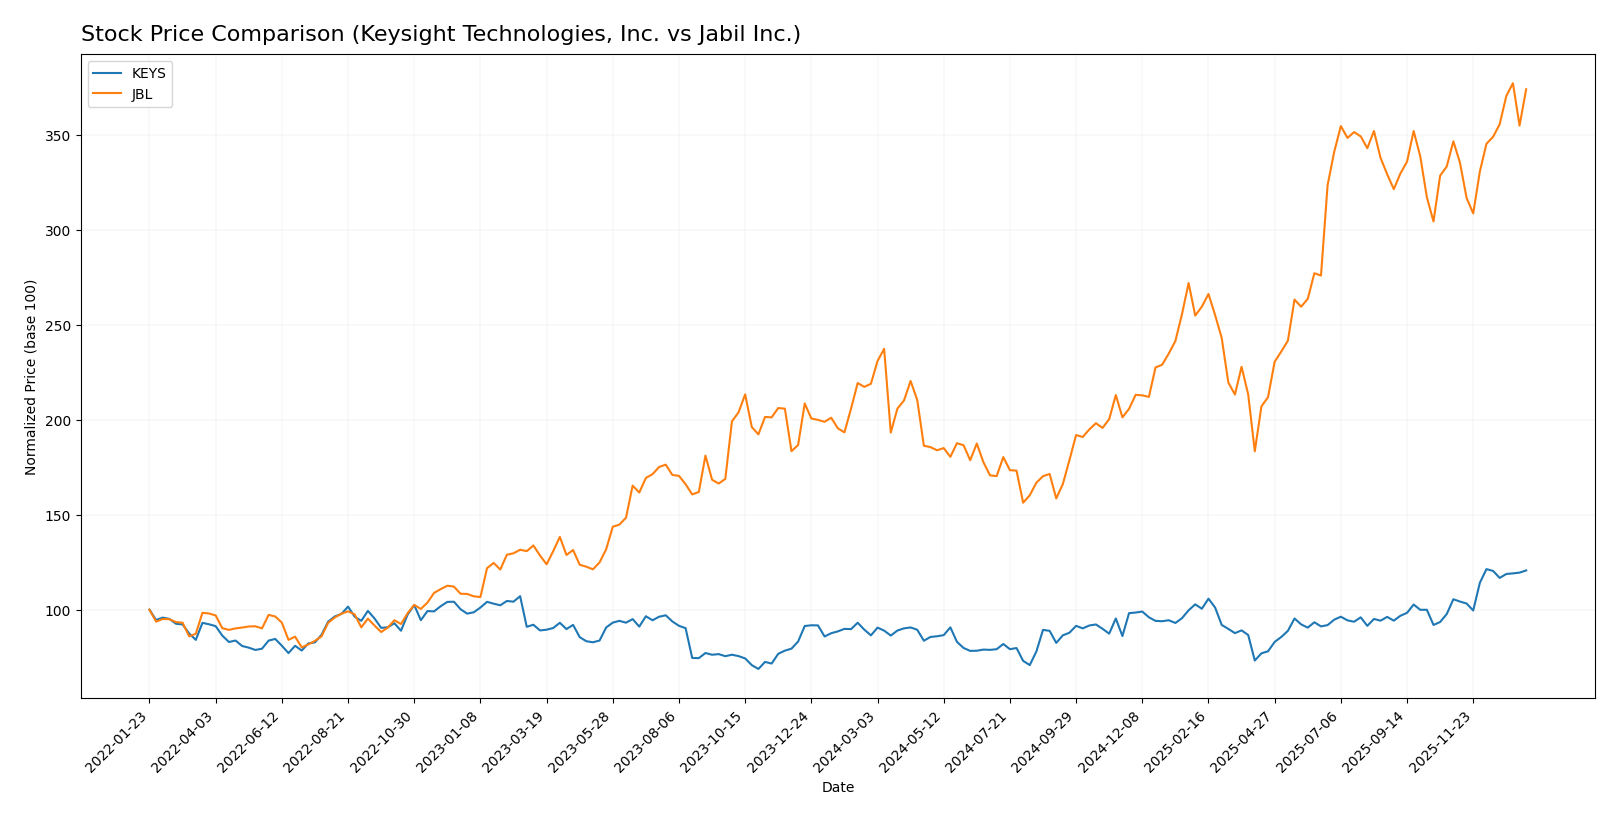
The stock price chart illustrates notable bullish trends for both Keysight Technologies, Inc. and Jabil Inc. over the past 12 months, with Jabil showing a stronger price appreciation and higher volatility.
Trend Analysis
Keysight Technologies, Inc. experienced a 39.56% price increase over the past year, indicating a bullish trend with acceleration. The stock ranged from a low of 122.87 to a high of 210.49, accompanied by moderate volatility (std deviation 18.51).
Jabil Inc. posted a 70.84% gain over the same period, also bullish with acceleration. The stock fluctuated between 99.62 and 240.39, showing higher volatility (std deviation 42.66) compared to Keysight.
Comparing both, Jabil delivered the highest market performance with a stronger price increase and greater buyer dominance, despite its higher volatility relative to Keysight.
Target Prices
The consensus target prices indicate positive upside potential for these technology hardware companies.
| Company | Target High | Target Low | Consensus |
|---|---|---|---|
| Keysight Technologies, Inc. | 232 | 210 | 225.13 |
| Jabil Inc. | 283 | 244 | 260.5 |
Analysts expect Keysight’s stock to rise modestly above the current price of 209.3 USD, while Jabil’s consensus target of 260.5 USD suggests a significant upside from its current 238.35 USD price.
Analyst Opinions Comparison
This section compares analysts’ ratings and grades for Keysight Technologies, Inc. (KEYS) and Jabil Inc. (JBL):
Rating Comparison
KEYS Rating
- Rating: B, assessed as Very Favorable by analysts.
- Discounted Cash Flow Score: Moderate level at 3, indicating fair valuation.
- ROE Score: Favorable at 4, showing efficient profit generation from equity.
- ROA Score: Favorable at 4, demonstrating effective asset utilization.
- Debt To Equity Score: Moderate at 2, implying manageable financial risk.
- Overall Score: Moderate at 3, reflecting balanced overall financial health.
JBL Rating
- Rating: B-, also categorized as Very Favorable.
- Discounted Cash Flow Score: Moderate at 3, reflecting similar valuation view.
- ROE Score: Very Favorable at 5, indicating stronger equity profit efficiency.
- ROA Score: Moderate at 3, suggesting average asset use efficiency.
- Debt To Equity Score: Very Unfavorable at 1, indicating higher financial risk.
- Overall Score: Moderate at 3, showing comparable overall financial standing.
Which one is the best rated?
Based on the provided data, KEYS holds a slightly higher overall rating (B vs. B-) with favorable ROA and debt-to-equity scores, while JBL excels in ROE but has a notably weaker debt-to-equity position. Both share moderate overall scores.
Scores Comparison
Here is a comparison of the Altman Z-Score and Piotroski Score for Keysight Technologies, Inc. (KEYS) and Jabil Inc. (JBL):
KEYS Scores
- Altman Z-Score: 5.94, indicating a strong safe zone.
- Piotroski Score: 4, representing average financial strength.
JBL Scores
- Altman Z-Score: 3.09, also in the safe zone range.
- Piotroski Score: 8, indicating very strong financial health.
Which company has the best scores?
JBL has a lower but still safe Altman Z-Score and a much higher Piotroski Score compared to KEYS, suggesting stronger overall financial health by these metrics.
Grades Comparison
The following section presents a comparison of the latest available grades from recognized financial institutions for both companies:
Keysight Technologies, Inc. Grades
This table details recent grades assigned to Keysight Technologies by major financial firms.
| Grading Company | Action | New Grade | Date |
|---|---|---|---|
| Morgan Stanley | Maintain | Equal Weight | 2025-12-17 |
| Jefferies | Maintain | Hold | 2025-12-10 |
| Baird | Maintain | Outperform | 2025-11-26 |
| Barclays | Maintain | Overweight | 2025-11-25 |
| JP Morgan | Maintain | Overweight | 2025-11-25 |
| Jefferies | Maintain | Hold | 2025-11-25 |
| Citigroup | Maintain | Buy | 2025-11-25 |
| UBS | Maintain | Buy | 2025-11-25 |
| Wells Fargo | Maintain | Overweight | 2025-11-25 |
| Susquehanna | Maintain | Positive | 2025-11-25 |
Overall, Keysight Technologies shows a generally favorable trend with multiple buy and overweight ratings, balanced by some hold and equal weight grades.
Jabil Inc. Grades
The following table lists recent grades for Jabil from established financial grading firms.
| Grading Company | Action | New Grade | Date |
|---|---|---|---|
| JP Morgan | Maintain | Overweight | 2025-12-18 |
| UBS | Maintain | Neutral | 2025-12-18 |
| Barclays | Maintain | Overweight | 2025-12-18 |
| B of A Securities | Maintain | Buy | 2025-12-10 |
| Barclays | Maintain | Overweight | 2025-09-26 |
| B of A Securities | Maintain | Buy | 2025-09-26 |
| JP Morgan | Maintain | Overweight | 2025-07-17 |
| B of A Securities | Maintain | Buy | 2025-06-20 |
| UBS | Maintain | Neutral | 2025-06-18 |
| JP Morgan | Maintain | Overweight | 2025-06-18 |
Jabil’s grades reflect a consistent pattern of buy and overweight ratings with some neutral assessments, indicating moderate confidence from analysts.
Which company has the best grades?
Keysight Technologies holds a stronger consensus with 12 buys and a consensus rating of “Buy,” whereas Jabil carries a “Hold” consensus with a more balanced mix of buy and hold ratings. This difference could influence investor perceptions of growth potential and risk.
Strengths and Weaknesses
The table below summarizes the key strengths and weaknesses of Keysight Technologies, Inc. (KEYS) and Jabil Inc. (JBL) based on their recent financial performance, market position, and strategic attributes.
| Criterion | Keysight Technologies, Inc. (KEYS) | Jabil Inc. (JBL) |
|---|---|---|
| Diversification | Moderate: Focused on test and measurement with two main segments (Communications and Electronic Industrial) | High: Diverse operations across Digital Commerce, Intelligent Infrastructure, and Regulated Industries |
| Profitability | Moderate: Net margin at 15.74%, ROIC 7.98%, but ROIC declining and below WACC | Mixed: Low net margin 2.2%, but strong ROE 43.42% and ROIC 16.06%, with improving ROIC trend |
| Innovation | Strong focus on specialized measurement solutions, supporting communications and electronics industries | Innovation embedded in manufacturing services but less specialized; operational scale is a key strength |
| Global presence | Strong presence in communications and industrial sectors globally | Extensive global footprint serving multiple sectors with complex supply chains |
| Market Share | Leading in test and measurement niche with steady revenue growth | Large market share in contract manufacturing and supply chain services |
Keysight shows strength in focused innovation and profitability but struggles with value destruction indicated by declining ROIC below cost of capital. Jabil demonstrates a durable competitive advantage with growing ROIC and broad diversification but faces challenges in margin and leverage. Investors should weigh Keysight’s specialized tech focus against Jabil’s operational scale and improving capital efficiency.
Risk Analysis
Below is a comparative table of key risks for Keysight Technologies, Inc. (KEYS) and Jabil Inc. (JBL) based on the latest 2025 data:
| Metric | Keysight Technologies, Inc. (KEYS) | Jabil Inc. (JBL) |
|---|---|---|
| Market Risk | Beta 1.18, moderate volatility | Beta 1.25, slightly higher volatility |
| Debt level | Debt-to-Equity 0.51 (neutral) | Debt-to-Equity 2.22 (high risk) |
| Regulatory Risk | Moderate, tech industry compliance | Moderate, with global manufacturing regulations |
| Operational Risk | Medium, complex product portfolio | High, due to large workforce (138K) and supply chain complexity |
| Environmental Risk | Moderate, standard industry norms | Moderate, manufacturing impact scrutiny |
| Geopolitical Risk | Exposure in Americas, Europe, Asia | Global footprint, sensitive to trade tensions |
Keysight shows moderate market and operational risks but benefits from a solid liquidity position and low bankruptcy risk (Altman Z-Score ~5.94). Jabil carries higher debt levels and operational complexity, increasing financial and operational risk despite a strong Piotroski score (8). The most impactful risks are Jabil’s high leverage and supply chain exposure, and Keysight’s valuation premium and market sensitivity. I recommend careful monitoring of debt management and geopolitical developments for both.
Which Stock to Choose?
Keysight Technologies, Inc. (KEYS) shows a favorable income statement with strong gross and EBIT margins and positive net margin growth. Its financial ratios are slightly favorable overall, with solid liquidity and manageable debt levels. The company holds a very favorable B rating.
Jabil Inc. (JBL) presents a less favorable income evolution marked by neutral margins and mostly unfavorable growth trends. Financial ratios appear slightly unfavorable with weaker liquidity and higher leverage. Despite this, JBL maintains a very favorable B- rating supported by strong return on equity.
For risk-averse investors prioritizing stability and income quality, Keysight’s consistent profitability and balanced financial profile might appear more suitable. Conversely, risk-tolerant investors focused on growth and capital efficiency could interpret Jabil’s strong ROE and improving moat as a signal of potential value creation.
Disclaimer: Investment carries a risk of loss of initial capital. The past performance is not a reliable indicator of future results. Be sure to understand risks before making an investment decision.
Go Further
I encourage you to read the complete analyses of Keysight Technologies, Inc. and Jabil Inc. to enhance your investment decisions: