IsoEnergy Ltd. and Uranium Royalty Corp. are two prominent players in the uranium sector, each with distinct approaches to capitalizing on the growing demand for nuclear energy. IsoEnergy focuses on acquiring and developing uranium mineral properties, while Uranium Royalty Corp. operates as a pure-play royalty company with a diversified portfolio of uranium interests. This comparison will help you determine which company holds the most promising investment potential in this evolving market.
Table of contents
Companies Overview
I will begin the comparison between IsoEnergy Ltd. and Uranium Royalty Corp. by providing an overview of these two companies and their main differences.
IsoEnergy Ltd. Overview
IsoEnergy Ltd. focuses on the acquisition, development, evaluation, and exploration of uranium mineral properties. The company holds interests primarily in properties located in the Athabasca Basin of Saskatchewan, Canada. Incorporated in 2016 and headquartered in Saskatoon, IsoEnergy operates as a subsidiary of NexGen Energy Ltd., positioning itself as an emerging player in the uranium sector.
Uranium Royalty Corp. Overview
Uranium Royalty Corp. operates as a pure-play uranium royalty company, managing a diversified portfolio of uranium interests across North America and Namibia. Founded in 2017 and based in Vancouver, Canada, it holds royalty interests in numerous uranium projects, including several in Saskatchewan and the United States. The company trades on NASDAQ and focuses on generating revenue through royalty management rather than direct mining operations.
Key similarities and differences
Both companies operate in the uranium industry and are headquartered in Canada, with a focus on Saskatchewan projects. IsoEnergy is primarily engaged in direct exploration and development of uranium properties, while Uranium Royalty Corp. specializes in royalty interests, providing a more asset-light business model. IsoEnergy’s market cap is approximately 600M USD compared to Uranium Royalty’s 535M USD, reflecting different operational scopes and risk profiles.
Income Statement Comparison
The table below presents a side-by-side comparison of key income statement metrics for IsoEnergy Ltd. and Uranium Royalty Corp. for their most recent fiscal years, reflecting their financial performance in the uranium sector.
| Metric | IsoEnergy Ltd. (ISOU) | Uranium Royalty Corp. (UROY) |
|---|---|---|
| Market Cap | 599M CAD | 535M CAD |
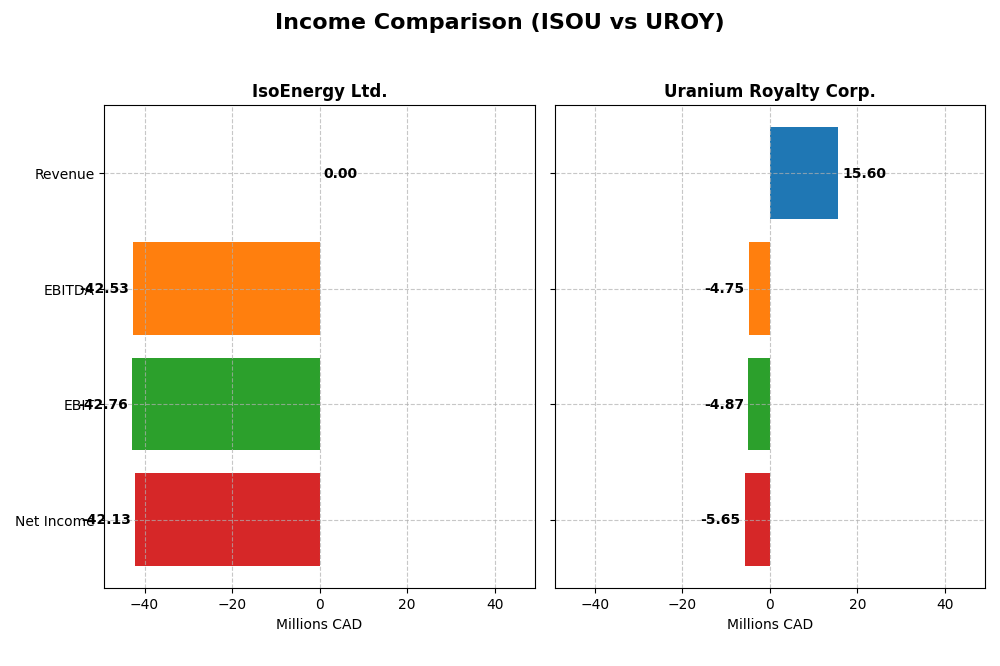
| Revenue | 0 | 15.6M CAD |
| EBITDA | -42.5M CAD | -4.8M CAD |
| EBIT | -42.8M CAD | -4.9M CAD |
| Net Income | -42.1M CAD | -5.7M CAD |
| EPS | -1.38 CAD | -0.045 CAD |
| Fiscal Year | 2024 | 2025 |
Income Statement Interpretations
IsoEnergy Ltd.
IsoEnergy Ltd. has reported zero revenue consistently from 2020 to 2024, with net losses increasing substantially over this period. Margins remain unfavorable, with no gross profit or EBIT margin recorded. The 2024 fiscal year showed a sharp deterioration, with net income dropping to -42.1M CAD and EPS falling to -1.38, reflecting escalating operating expenses and no revenue growth.
Uranium Royalty Corp.
Uranium Royalty Corp. displays fluctuating revenues from 2021 to 2025, peaking at 42.7M CAD in 2024 then declining sharply by 63.5% in 2025. Despite positive gross profit in most years, EBIT and net margins remain negative, with a net loss of -5.7M CAD in 2025. The recent year saw deteriorating profitability and a sharp EPS decline to -0.045 CAD, indicating margin compression and higher costs.
Which one has the stronger fundamentals?
Both companies face unfavorable income statement trends, with IsoEnergy showing no revenue and increasing losses, while Uranium Royalty has revenue but declining profitability and margins. IsoEnergy’s losses are larger in absolute terms, but Uranium Royalty’s top-line volatility and margin erosion reflect operational challenges. Overall, neither demonstrates robust income fundamentals as of their most recent fiscal years.
Financial Ratios Comparison
The table below presents the most recent financial ratios for IsoEnergy Ltd. and Uranium Royalty Corp., providing a side-by-side view of key performance and financial health indicators as of their latest fiscal years.
| Ratios | IsoEnergy Ltd. (2024) | Uranium Royalty Corp. (2025) |
|---|---|---|
| ROE | -13.9% | -1.9% |
| ROIC | -12.5% | -1.6% |
| P/E | -9.64 | -56.0 |
| P/B | 1.34 | 1.07 |
| Current Ratio | 1.70 | 233.49 |
| Quick Ratio | 1.70 | 233.49 |
| D/E | 0.10 | 0.00 |
| Debt-to-Assets | 9.0% | 0.07% |
| Interest Coverage | -32.10 | -11.02 |
| Asset Turnover | 0.00 | 0.05 |
| Fixed Asset Turnover | 0.00 | 82.51 |
| Payout ratio | 0 | 0 |
| Dividend yield | 0 | 0 |
Interpretation of the Ratios
IsoEnergy Ltd.
IsoEnergy Ltd. shows a mixed ratio profile with several favorable indicators such as a price-to-book ratio of 1.34, current and quick ratios around 1.7, and low debt-to-equity and debt-to-assets ratios near 0.1 and 9%. However, profitability ratios like ROE (-13.9%) and ROIC (-12.5%) are unfavorable, alongside a negative interest coverage ratio. The company does not pay dividends, reflecting its exploration and development focus in uranium with likely reinvestment of cash flows.
Uranium Royalty Corp.
Uranium Royalty Corp. presents a largely unfavorable ratio picture with a high weighted average cost of capital at 13.4%, negative net margin (-36.26%), and weak returns such as ROE at -1.92%. Despite a strong price-to-book of 1.07 and favorable fixed asset turnover of 82.51, other metrics like current ratio (233.49) appear distorted or excessive. The company also does not pay dividends, consistent with its strategy of royalty portfolio management and reinvestment.
Which one has the best ratios?
Comparing both, IsoEnergy Ltd. has a slightly more balanced financial ratio profile, with a better current ratio and interest coverage issues less severe than Uranium Royalty Corp. Yet, both companies face significant profitability challenges and do not distribute dividends, indicating that neither currently demonstrates strong financial health based on these ratios alone.
Strategic Positioning
This section compares the strategic positioning of IsoEnergy Ltd. and Uranium Royalty Corp., focusing on market position, key segments, and exposure to technological disruption:
IsoEnergy Ltd.
- Emerging uranium explorer with a focus on Canadian properties, facing typical sector competition.
- Concentrates on acquisition and development of uranium mineral properties in Athabasca Basin, Canada.
- No explicit data on technological disruption exposure provided.
Uranium Royalty Corp.
- Pure-play uranium royalty company with diversified global uranium interests, competing in royalty market.
- Manages geographically diversified uranium royalty portfolio across North America and Namibia.
- No explicit data on technological disruption exposure provided.
IsoEnergy Ltd. vs Uranium Royalty Corp. Positioning
IsoEnergy Ltd. adopts a concentrated approach focused on uranium exploration in Canadian basins, while Uranium Royalty Corp. pursues a diversified royalty portfolio across multiple regions. IsoEnergy’s narrow segment may limit exposure but also concentrates operational risk; Uranium Royalty’s broad portfolio spreads geographic risk but depends on royalty income stability.
Which has the best competitive advantage?
Both companies currently shed value with ROIC below WACC, but IsoEnergy shows a growing ROIC trend, indicating improving profitability, whereas Uranium Royalty experiences declining ROIC and worsening profitability, suggesting a weaker competitive advantage.
Stock Comparison
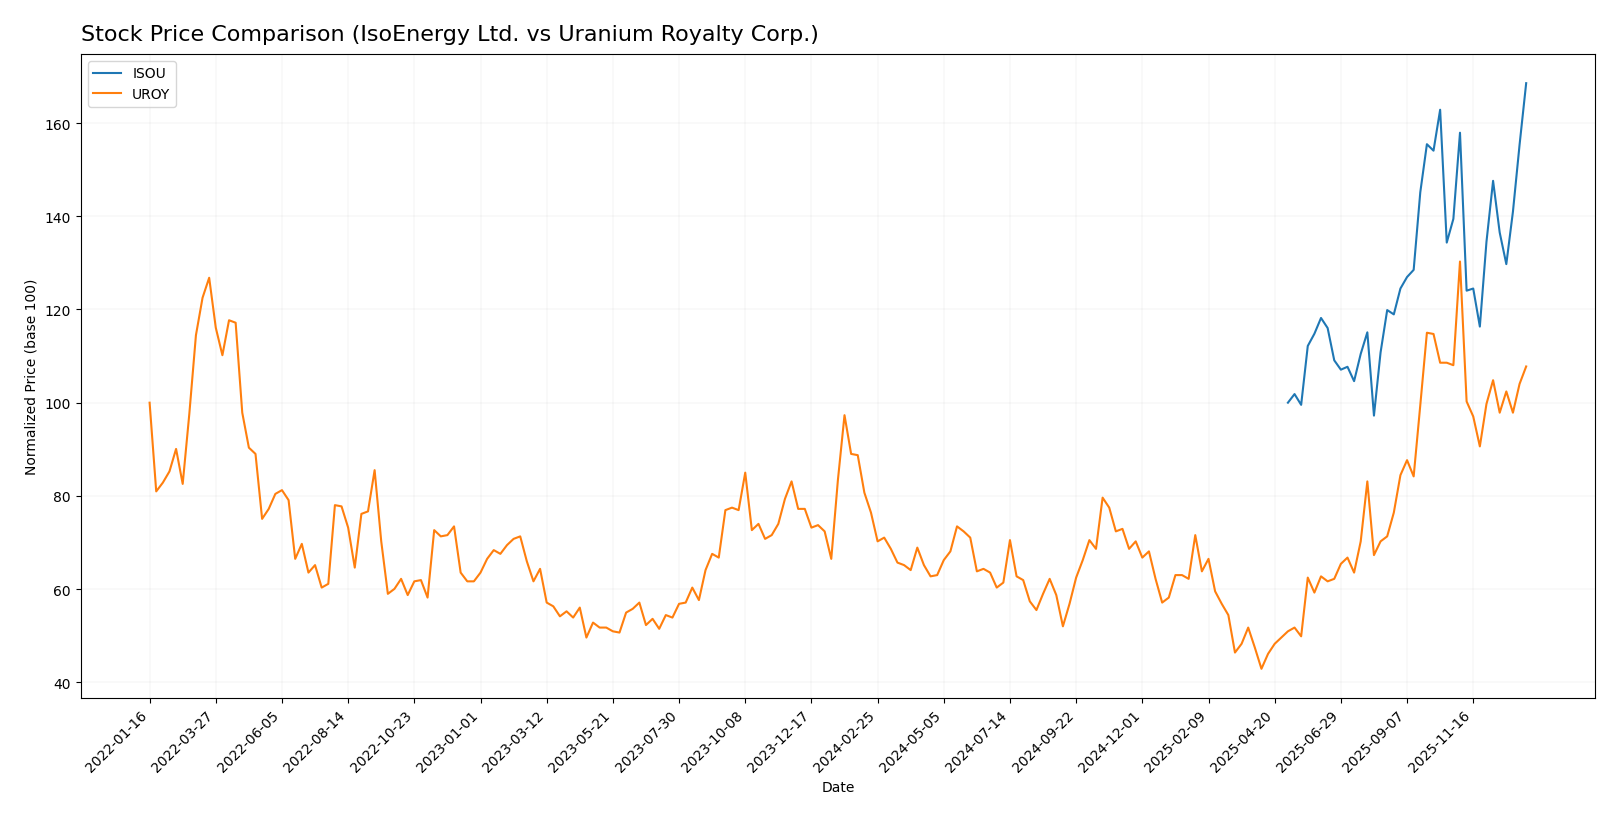
The stock price movements of IsoEnergy Ltd. (ISOU) and Uranium Royalty Corp. (UROY) over the past year reveal significant gains for both, with ISOU showing stronger bullish momentum and accelerating growth compared to UROY’s decelerating trend.
Trend Analysis
IsoEnergy Ltd. (ISOU) exhibits a bullish trend with a 68.57% price increase over the past 12 months, supported by accelerating momentum and a moderate volatility level (std deviation 1.25). The stock’s price ranged between 6.31 and 10.94 during this period.
Uranium Royalty Corp. (UROY) also shows a bullish overall trend, with a 41.05% rise over the last year, but with deceleration and lower volatility (std deviation 0.67). Its price fluctuated from 1.6 to 4.86, and recent months indicate a near-neutral trend.
Comparing the two, ISOU delivered the highest market performance with a substantially stronger price increase and accelerating trend, while UROY’s growth has slowed and recently plateaued.
Target Prices
No verified target price data is available from recognized analysts for IsoEnergy Ltd. and Uranium Royalty Corp. Market sentiment remains uncertain without clear analyst guidance.
Analyst Opinions Comparison
This section compares analysts’ ratings and grades for IsoEnergy Ltd. and Uranium Royalty Corp.:
Rating Comparison
IsoEnergy Ltd. Rating
- Rating: C-, considered very favorable overall.
- Discounted Cash Flow Score: 1, rated very unfavorable.
- ROE Score: 1, very unfavorable efficiency in profit.
- ROA Score: 1, very unfavorable asset utilization.
- Debt To Equity Score: 3, moderate financial risk.
- Overall Score: 1, very unfavorable financial standing.
Uranium Royalty Corp. Rating
- Rating: C-, considered very favorable overall.
- Discounted Cash Flow Score: 1, rated very unfavorable.
- ROE Score: 1, very unfavorable efficiency in profit.
- ROA Score: 1, very unfavorable asset utilization.
- Debt To Equity Score: 4, favorable financial risk level.
- Overall Score: 1, very unfavorable financial standing.
Which one is the best rated?
Both companies share the same overall rating and similarly low scores in cash flow, ROE, and ROA, with Uranium Royalty Corp. slightly better rated on debt-to-equity, indicating a more favorable financial risk profile.
Scores Comparison
The comparison of IsoEnergy Ltd. and Uranium Royalty Corp. scores is as follows:
IsoEnergy Ltd. Scores
- Altman Z-Score: 19.22, indicating a safe zone status and low bankruptcy risk.
- Piotroski Score: 2, classified as very weak financial strength.
Uranium Royalty Corp. Scores
- Altman Z-Score: 388.37, indicating a safe zone status and very low bankruptcy risk.
- Piotroski Score: 3, classified as very weak financial strength.
Which company has the best scores?
Uranium Royalty Corp. has a higher Altman Z-Score and a slightly better Piotroski Score than IsoEnergy Ltd. Both show safe zone bankruptcy risk and very weak financial strength.
Grades Comparison
Here is the comparison of grading data for IsoEnergy Ltd. and Uranium Royalty Corp.:
IsoEnergy Ltd. Grades
No reliable grades are available from verifiable grading companies for IsoEnergy Ltd. The absence of grades implies investors should consider other risk factors when evaluating this stock.
Uranium Royalty Corp. Grades
The table below summarizes the consistent grading history from HC Wainwright & Co. for Uranium Royalty Corp.:
| Grading Company | Action | New Grade | Date |
|---|---|---|---|
| HC Wainwright & Co. | Maintain | Buy | 2025-04-22 |
| HC Wainwright & Co. | Maintain | Buy | 2024-12-19 |
| HC Wainwright & Co. | Maintain | Buy | 2024-09-17 |
| HC Wainwright & Co. | Maintain | Buy | 2024-06-17 |
| HC Wainwright & Co. | Maintain | Buy | 2024-03-11 |
| HC Wainwright & Co. | Maintain | Buy | 2022-01-03 |
| HC Wainwright & Co. | Maintain | Buy | 2021-09-29 |
| HC Wainwright & Co. | Maintain | Buy | 2021-09-28 |
| HC Wainwright & Co. | Maintain | Buy | 2021-07-02 |
| HC Wainwright & Co. | Maintain | Buy | 2021-07-01 |
All grades from HC Wainwright & Co. have remained steady at “Buy,” showing a stable positive outlook for Uranium Royalty Corp.
Which company has the best grades?
Uranium Royalty Corp. clearly has the better grades with a consistent “Buy” rating from a reputable grading company. IsoEnergy Ltd. lacks any available grades, which may lead investors to rely more heavily on other factors or remain cautious. This contrast could impact portfolio decisions and risk assessments.
Strengths and Weaknesses
The table below summarizes the key strengths and weaknesses of IsoEnergy Ltd. (ISOU) and Uranium Royalty Corp. (UROY) based on their diversification, profitability, innovation, global presence, and market share using the latest financial and operational data.
| Criterion | IsoEnergy Ltd. (ISOU) | Uranium Royalty Corp. (UROY) |
|---|---|---|
| Diversification | Limited diversification, focused on uranium exploration and development | Focused on uranium royalties, limited diversification |
| Profitability | Negative profitability, ROIC -12.5%, but improving trend | Negative profitability, ROIC -1.63%, declining trend |
| Innovation | Moderate innovation potential due to exploration activities | Limited innovation focus, more on financial royalties |
| Global presence | Primarily Canada-based operations | Broader exposure via royalties in multiple jurisdictions |
| Market Share | Small market share in uranium mining | Niche player in uranium royalty market |
Key takeaways: Both companies operate in the uranium sector with narrow focus. IsoEnergy shows improving profitability but is still value destructive, while Uranium Royalty Corp. faces declining profitability and a less favorable outlook. Investors should approach cautiously, prioritizing risk management.
Risk Analysis
Below is a comparative table highlighting key risks associated with IsoEnergy Ltd. (ISOU) and Uranium Royalty Corp. (UROY) as of the most recent fiscal years.
| Metric | IsoEnergy Ltd. (ISOU) | Uranium Royalty Corp. (UROY) |
|---|---|---|
| Market Risk | Moderate (Beta 0.955) | High (Beta 2.034) |
| Debt Level | Low (Debt/Equity 0.1) | Very Low (Debt/Equity 0.0) |
| Regulatory Risk | Moderate (Energy sector, uranium mining regulations in Canada) | Moderate (Royalties tied to uranium projects globally) |
| Operational Risk | High (Exploration stage, negative ROE and ROIC) | Moderate (Royalty model lowers operational risks) |
| Environmental Risk | Moderate (Mining operations in sensitive regions) | Moderate (Dependent on multiple mining operators) |
| Geopolitical Risk | Moderate (Canada-based operations) | Moderate to High (Global exposure including U.S. and Namibia) |
IsoEnergy faces significant operational risks due to negative profitability and early-stage exploration, while Uranium Royalty Corp. bears higher market and geopolitical risks from its diverse global portfolio. Both companies operate in a regulated uranium sector, but IsoEnergy’s debt is slightly higher, though still low, and both have weak profitability metrics that investors should monitor closely.
Which Stock to Choose?
IsoEnergy Ltd. (ISOU) shows stagnant income with no revenue growth and negative profitability metrics; financial ratios reveal a mixed profile with favorable liquidity and leverage but unfavorable returns and margins; the company is shedding value despite a growing ROIC, and holds a very favorable overall rating despite poor profitability scores.
Uranium Royalty Corp. (UROY) experiences declining revenue and margins alongside negative profitability; its financial ratios are largely unfavorable except for some valuation and leverage metrics, and it is destroying value with a declining ROIC trend; the rating is very favorable overall but with weak profitability and valuation scores.
For investors prioritizing value creation and improving profitability, ISOU’s growing ROIC might appear more appealing, while those focused on financial stability and strong balance sheet metrics may find UROY’s leverage and liquidity metrics more reassuring despite its declining profitability; thus, the choice could depend on the investor’s risk tolerance and investment strategy.
Disclaimer: Investment carries a risk of loss of initial capital. The past performance is not a reliable indicator of future results. Be sure to understand risks before making an investment decision.
Go Further
I encourage you to read the complete analyses of IsoEnergy Ltd. and Uranium Royalty Corp. to enhance your investment decisions: