In the competitive uranium industry, Uranium Energy Corp. (UEC) and IsoEnergy Ltd. (ISOU) stand out as promising players with distinct strategies. UEC operates across the US, Canada, and Paraguay with a broad portfolio, while ISOU focuses on high-potential Canadian deposits. Their innovation approaches and market footprints invite comparison. This article will help you decide which company aligns best with your investment goals in this dynamic sector.
Table of contents
Companies Overview
I will begin the comparison between Uranium Energy Corp. and IsoEnergy Ltd. by providing an overview of these two companies and their main differences.
Uranium Energy Corp. Overview
Uranium Energy Corp. focuses on exploration, pre-extraction, extraction, and processing of uranium and titanium concentrates. Operating in the US, Canada, and Paraguay, it holds interests in multiple mining projects across Texas, Arizona, Colorado, Wyoming, and Paraguay. Founded in 2003 and based in Corpus Christi, Texas, the company is positioned as a notable player in the uranium industry with a market cap of 7.1B USD.
IsoEnergy Ltd. Overview
IsoEnergy Ltd. specializes in acquiring, developing, evaluating, and exploring uranium mineral properties, primarily in the Athabasca Basin of Saskatchewan, Canada. Incorporated in 2016 and headquartered in Saskatoon, it holds interests in several Canadian properties and functions as a subsidiary of NexGen Energy Ltd. The company has a market cap of 600M USD and a smaller workforce compared to its peer.
Key similarities and differences
Both companies operate in the uranium sector, focusing on exploration and development of uranium resources. Uranium Energy Corp. has a broader geographic presence including the US and Paraguay, while IsoEnergy is concentrated in Canada’s Athabasca Basin. Uranium Energy is larger by market cap and employee count, reflecting a more established position, whereas IsoEnergy, as a newer and smaller entity, operates with a more focused project portfolio.
Income Statement Comparison
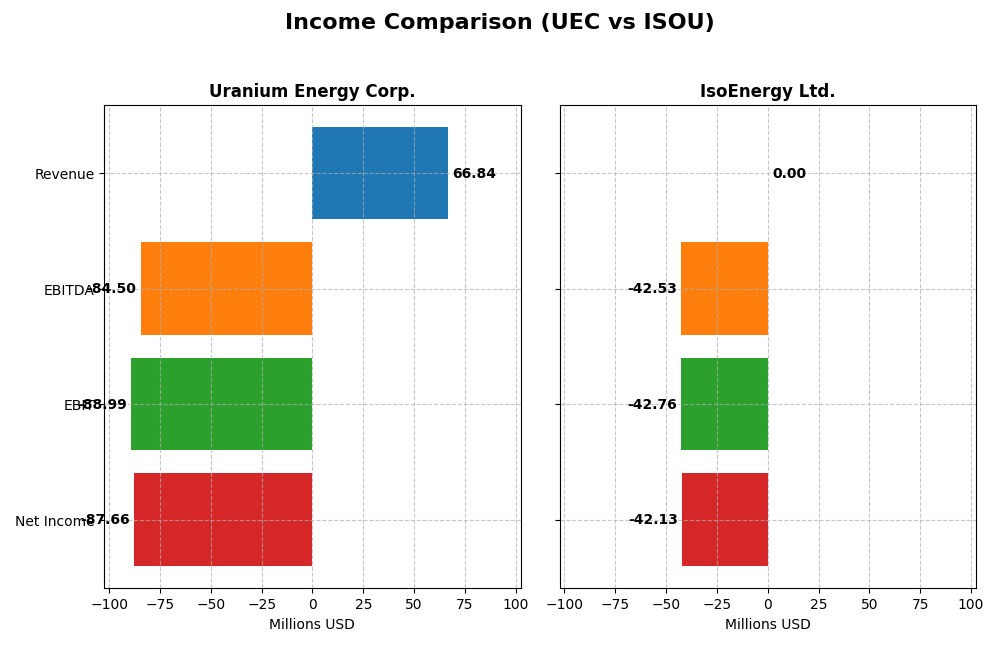
The table below compares the key income statement metrics for Uranium Energy Corp. and IsoEnergy Ltd. based on their most recent fiscal year data.
| Metric | Uranium Energy Corp. (UEC) | IsoEnergy Ltd. (ISOU) |
|---|---|---|
| Market Cap | 7.13B USD | 599M USD |
| Revenue | 67M USD | 0 CAD |
| EBITDA | -84.5M USD | -42.5M CAD |
| EBIT | -89.0M USD | -42.8M CAD |
| Net Income | -87.7M USD | -42.1M CAD |
| EPS | -0.20 USD | -1.38 CAD |
| Fiscal Year | 2025 | 2024 |
Income Statement Interpretations
Uranium Energy Corp.
Uranium Energy Corp. shows fluctuating revenue over 2021-2025, peaking at $164M in 2023 then sharply dropping to $67M in 2025. Gross margins remain favorable at 36.62%, though EBIT and net margins are deeply negative, reflecting ongoing operational challenges. The 2025 year saw significant revenue growth from 2024 but deteriorated profitability and negative net income of -$87.7M.
IsoEnergy Ltd.
IsoEnergy Ltd. recorded zero revenue consistently through 2020-2024 with persistent net losses growing from -$9.5M in 2020 to -$42.1M in 2024. Margins remain unfavorable with no gross or EBIT profits. Operating expenses and net losses increased materially in 2024 compared to prior years, indicating intensified spending without revenue generation.
Which one has the stronger fundamentals?
Both companies face unfavorable income statement conditions, with IsoEnergy’s zero revenue and growing losses signaling weaker fundamentals. Uranium Energy Corp. has some favorable gross margin and revenue growth metrics but suffers from negative EBIT and net margins. Overall, both show substantial challenges, though Uranium Energy Corp.’s scale and partial margin strength provide a comparatively firmer base.
Financial Ratios Comparison
The table below compares key financial ratios for Uranium Energy Corp. (UEC) and IsoEnergy Ltd. (ISOU) based on their most recent fiscal year data, providing insights into profitability, liquidity, leverage, and valuation metrics.
| Ratios | Uranium Energy Corp. (2025) | IsoEnergy Ltd. (2024) |
|---|---|---|
| ROE | -8.9% | -13.9% |
| ROIC | -6.6% | -12.5% |
| P/E | -42.3 | -9.6 |
| P/B | 3.77 | 1.34 |
| Current Ratio | 8.85 | 1.70 |
| Quick Ratio | 5.85 | 1.70 |
| D/E | 0.0023 | 0.101 |
| Debt-to-Assets | 0.21% | 9.0% |
| Interest Coverage | -50.7 | -32.1 |
| Asset Turnover | 0.060 | 0 |
| Fixed Asset Turnover | 0.086 | 0 |
| Payout ratio | 0 | 0 |
| Dividend yield | 0 | 0 |
Interpretation of the Ratios
Uranium Energy Corp.
Uranium Energy Corp. shows mostly unfavorable financial ratios in 2025, with negative net margin (-131.15%) and return on equity (-8.91%), signaling profitability challenges. Its current ratio is high at 8.85, but this is considered unfavorable due to potential inefficiency. The company does not pay dividends, likely reflecting reinvestment in operations or exploration activities in uranium mining.
IsoEnergy Ltd.
IsoEnergy Ltd. presents a mixed ratio profile in 2024, with 42.86% favorable ratios including a reasonable current ratio of 1.7 and low debt-to-assets at 9%. However, it suffers from negative returns such as ROE at -13.9% and no net margin. IsoEnergy does not pay dividends, suggesting a focus on growth, development, and exploration rather than shareholder payouts at this stage.
Which one has the best ratios?
Between the two, IsoEnergy Ltd. exhibits a somewhat more balanced ratio set with a higher proportion of favorable metrics and better liquidity measures. Uranium Energy Corp. struggles with more pronounced profitability issues and several unfavorable leverage and efficiency ratios. Overall, IsoEnergy’s ratios appear slightly less unfavorable in comparison.
Strategic Positioning
This section compares the strategic positioning of Uranium Energy Corp. and IsoEnergy Ltd., focusing on market position, key segments, and exposure to technological disruption:
Uranium Energy Corp.
- Established US-based uranium producer with diversified assets across multiple North American and South American projects.
- Engages in exploration, extraction, and processing of uranium and titanium concentrates; revenue driven by inventory sales and toll processing.
- Exposure to technological disruption not explicitly detailed; operates in traditional uranium mining and processing sectors.
IsoEnergy Ltd.
- Smaller Canadian uranium exploration company focused on properties in Saskatchewan’s Athabasca Basin.
- Concentrates on acquisition, development, and evaluation of uranium mineral properties without reported revenue segments.
- No explicit information on technological disruption exposure; focused on exploration activities in uranium mining.
Uranium Energy Corp. vs IsoEnergy Ltd. Positioning
Uranium Energy Corp. shows a diversified approach with multiple projects and product lines across countries, offering broader market coverage. IsoEnergy Ltd. concentrates on exploration in a single basin, limiting diversification but focusing on a specific geologic area. This difference reflects varied operational scopes and potential market risks.
Which has the best competitive advantage?
Both companies are currently shedding value according to MOAT evaluations but show growing ROIC trends. Their competitive advantages are slightly unfavorable, with Uranium Energy Corp. having a larger scale and diversified operations compared to IsoEnergy Ltd.’s more concentrated focus.
Stock Comparison
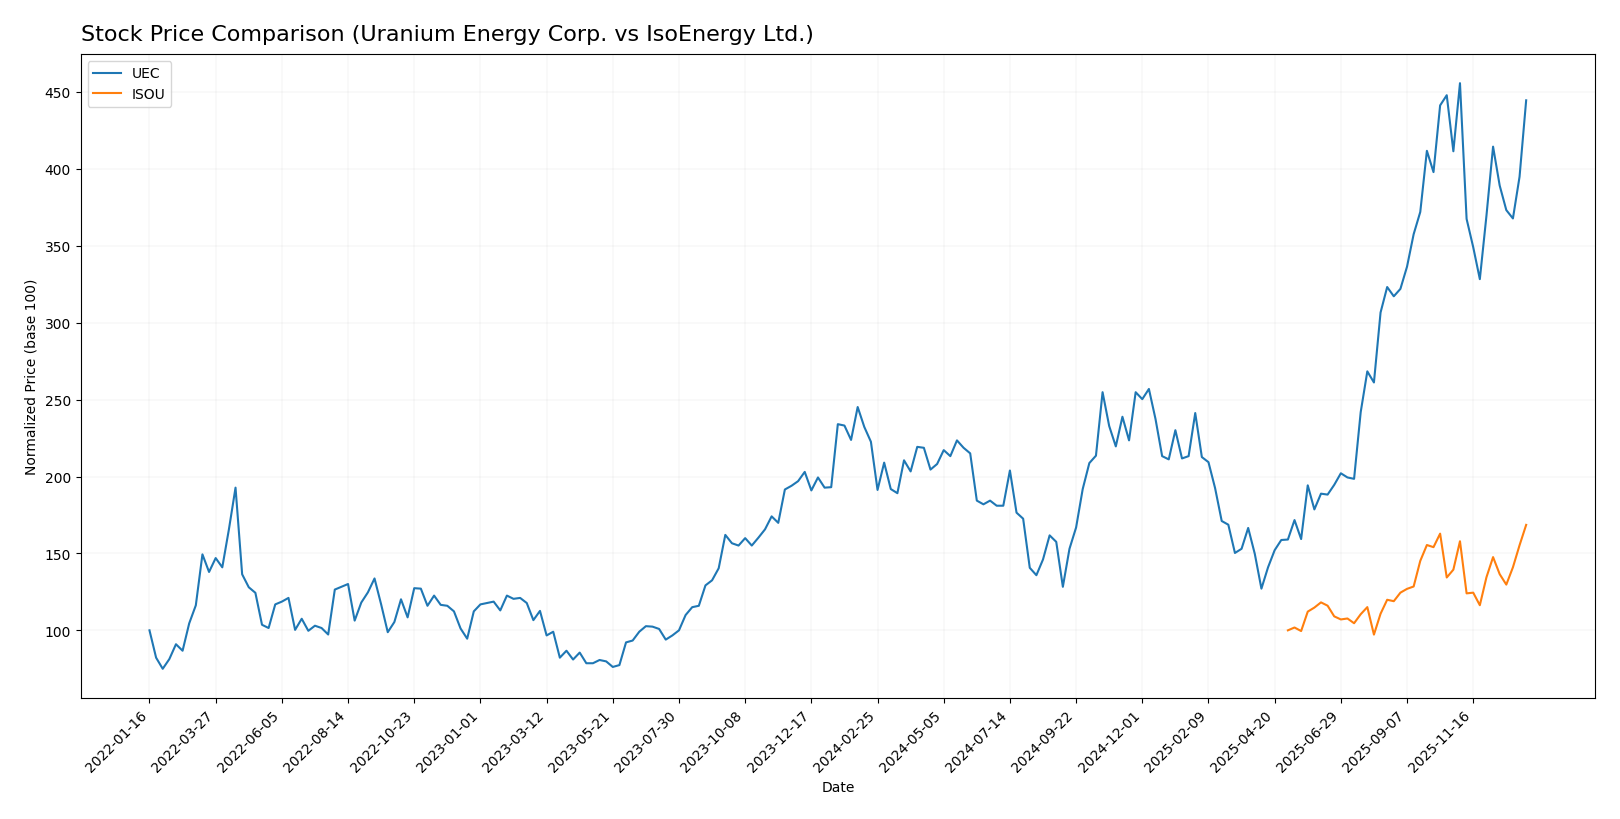
The stock price movements of Uranium Energy Corp. (UEC) and IsoEnergy Ltd. (ISOU) over the past year reveal strong bullish trends with contrasting recent momentum and trading dynamics.
Trend Analysis
Uranium Energy Corp. (UEC) shows a significant bullish trend over the past 12 months with a 99.73% price increase, though the rate of growth has decelerated recently. The stock traded between 4.22 and 15.13, with price volatility reflected by a 2.82 standard deviation.
IsoEnergy Ltd. (ISOU) also exhibits a bullish trend with a 68.57% price increase over the past year, accompanied by accelerating momentum. The price range was 6.31 to 10.94, and volatility was lower, with a 1.25 standard deviation.
Comparing the two, UEC delivered the highest overall market performance with a near 100% gain versus ISOU’s 69%, despite ISOU showing stronger recent growth acceleration.
Target Prices
The target price consensus for Uranium Energy Corp. indicates moderate upside potential.
| Company | Target High | Target Low | Consensus |
|---|---|---|---|
| Uranium Energy Corp. | 19.75 | 14 | 17.08 |
Analysts expect Uranium Energy Corp.’s stock to appreciate from its current price of 14.76 USD, suggesting a positive outlook with upside toward 17.08 USD on average. No verified target price data is available for IsoEnergy Ltd., limiting detailed consensus insights for this stock.
Analyst Opinions Comparison
This section compares analysts’ ratings and grades for Uranium Energy Corp. and IsoEnergy Ltd.:
Rating Comparison
UEC Rating
- Rating: D+, classified as Very Favorable by evaluators.
- Discounted Cash Flow Score: 1, indicating a Very Unfavorable valuation level.
- ROE Score: 1, reflecting Very Unfavorable efficiency in generating profits.
- ROA Score: 1, showing Very Unfavorable asset utilization.
- Debt To Equity Score: 1, suggesting Very Unfavorable financial risk profile.
- Overall Score: 1, representing a Very Unfavorable overall financial standing.
ISOU Rating
- Rating: C-, classified as Very Favorable by evaluators.
- Discounted Cash Flow Score: 1, indicating a Very Unfavorable valuation level.
- ROE Score: 1, reflecting Very Unfavorable efficiency in generating profits.
- ROA Score: 1, showing Very Unfavorable asset utilization.
- Debt To Equity Score: 3, indicating a Moderate financial risk profile.
- Overall Score: 1, representing a Very Unfavorable overall financial standing.
Which one is the best rated?
Based strictly on the provided data, IsoEnergy Ltd. holds a higher rating of C- compared to Uranium Energy Corp.’s D+. Both have identical low scores in most financial metrics, but ISOU’s moderate debt-to-equity score slightly improves its profile.
Scores Comparison
The scores comparison between Uranium Energy Corp. and IsoEnergy Ltd. is as follows:
Uranium Energy Corp. Scores
- Altman Z-Score: 30.44, indicating a safe zone status.
- Piotroski Score: 2, classified as very weak financial health.
IsoEnergy Ltd. Scores
- Altman Z-Score: 19.22, also in the safe zone range.
- Piotroski Score: 2, also very weak in financial strength.
Which company has the best scores?
Both companies have Altman Z-Scores placing them in the safe zone, suggesting low bankruptcy risk. However, both share a very weak Piotroski Score of 2, indicating poor financial strength by this measure.
Grades Comparison
Here is the comparison of the recent grades assigned to Uranium Energy Corp. and IsoEnergy Ltd.:
Uranium Energy Corp. Grades
This table summarizes the latest grades from recognized financial institutions for Uranium Energy Corp.:
| Grading Company | Action | New Grade | Date |
|---|---|---|---|
| Roth Capital | Maintain | Buy | 2025-12-11 |
| Goldman Sachs | Maintain | Buy | 2025-09-26 |
| Roth Capital | Maintain | Buy | 2025-09-25 |
| HC Wainwright & Co. | Maintain | Buy | 2025-09-25 |
| BMO Capital | Downgrade | Market Perform | 2025-09-25 |
| Roth Capital | Maintain | Buy | 2025-09-03 |
| HC Wainwright & Co. | Maintain | Buy | 2025-08-06 |
| HC Wainwright & Co. | Maintain | Buy | 2025-03-13 |
| HC Wainwright & Co. | Maintain | Buy | 2024-12-09 |
| Roth MKM | Maintain | Buy | 2024-10-23 |
Uranium Energy Corp. has predominantly received consistent Buy ratings, with one recent downgrade to Market Perform by BMO Capital.
IsoEnergy Ltd. Grades
No reliable grading data is available for IsoEnergy Ltd.
Which company has the best grades?
Uranium Energy Corp. has received multiple Buy ratings from credible firms, reflecting confidence despite one downgrade. IsoEnergy Ltd. lacks any available grading data, making direct comparison impossible and increasing uncertainty for investors.
Strengths and Weaknesses
Below is a comparison table highlighting the main strengths and weaknesses of Uranium Energy Corp. (UEC) and IsoEnergy Ltd. (ISOU) based on the latest financial and operational data.
| Criterion | Uranium Energy Corp. (UEC) | IsoEnergy Ltd. (ISOU) |
|---|---|---|
| Diversification | Moderate, focused mainly on uranium mining | Limited, primarily exploration stage |
| Profitability | Negative net margin (-131.15%), value destroying | Negative profitability, but improving ROIC trend |
| Innovation | Moderate, with some toll processing services | Early-stage innovation potential |
| Global presence | Primarily North America | Focused on Canadian uranium projects |
| Market Share | Established uranium producer with inventory sales | Emerging player, no significant market share yet |
Key takeaways: Both companies currently face profitability challenges and are value destroyers, though their ROICs are improving. UEC has a stronger market presence and revenue base, while ISOU shows promise with better financial ratios and growth potential but remains an earlier-stage investment with higher risk.
Risk Analysis
Below is a comparative table outlining key risks for Uranium Energy Corp. (UEC) and IsoEnergy Ltd. (ISOU) based on the most recent data available:
| Metric | Uranium Energy Corp. (UEC) | IsoEnergy Ltd. (ISOU) |
|---|---|---|
| Market Risk | Moderate (Beta 1.236, price volatility 3.85-17.8 USD) | Moderate (Beta 0.955, price range 4.52-11.5 CAD) |
| Debt level | Low (Debt-to-Equity 0.0, Debt-to-Assets 0.21%) | Low (Debt-to-Equity 0.1, Debt-to-Assets 9.0%) |
| Regulatory Risk | High (Uranium industry, US/Canada/Paraguay jurisdictions) | High (Uranium exploration in Canada, stringent regulations) |
| Operational Risk | Elevated (Negative net margin -131%, low asset turnover) | Elevated (Negative net margin 0%, zero asset turnover) |
| Environmental Risk | Significant (Uranium mining environmental impact) | Significant (Exploration in sensitive Athabasca Basin) |
| Geopolitical Risk | Moderate (Operations in US, Canada, Paraguay) | Moderate (Exposure to Canadian regulatory and geopolitical environment) |
The most likely and impactful risks for both companies stem from regulatory and environmental factors inherent to uranium mining and exploration. UEC’s highly negative profitability and operational inefficiencies raise caution, while ISOU’s early-stage status shows financial weakness but manageable debt. Investors should weigh regulatory hurdles and environmental liabilities heavily in their risk management.
Which Stock to Choose?
Uranium Energy Corp. (UEC) shows a mixed income evolution with a strong revenue growth of 29,738% in one year, yet persistent negative profitability indicators and a global unfavorable financial ratio profile. Despite solid liquidity and low debt levels, its return on equity is negative at -8.91%, and its overall rating is D+ with a very unfavorable score on multiple financial metrics.
IsoEnergy Ltd. (ISOU) demonstrates stagnant income growth with consistently negative profitability and a slightly unfavorable financial ratio profile. It maintains moderate liquidity and manageable debt, with a return on equity of -13.9%. The company holds a C- rating, reflecting very unfavorable overall scores but some moderate scores in debt-to-equity and price-to-book ratios.
For investors focused on growth potential, UEC’s remarkable revenue surge and improving profitability might appear attractive despite its financial weaknesses. Conversely, those prioritizing financial stability and moderate risk exposure could see ISOU’s steadier financial ratios and slightly better credit metrics as more favorable, given its slightly less adverse income and ratio evaluations.
Disclaimer: Investment carries a risk of loss of initial capital. The past performance is not a reliable indicator of future results. Be sure to understand risks before making an investment decision.
Go Further
I encourage you to read the complete analyses of Uranium Energy Corp. and IsoEnergy Ltd. to enhance your investment decisions: