In the evolving uranium sector, Ur-Energy Inc. and IsoEnergy Ltd. stand out as key players with overlapping ambitions in mineral exploration and development. Both companies focus on acquiring and operating uranium properties, yet they differ in geographic footprint and growth strategies. This comparison aims to clarify which firm offers the most promising investment potential in 2026. Let’s explore their profiles to identify the best fit for your portfolio.
Table of contents
Companies Overview
I will begin the comparison between Ur-Energy Inc. and IsoEnergy Ltd. by providing an overview of these two companies and their main differences.
Ur-Energy Inc. Overview
Ur-Energy Inc. focuses on the acquisition, exploration, development, and operation of uranium mineral properties primarily in the United States. Founded in 2004 and headquartered in Littleton, Colorado, the company manages 12 projects, with its flagship Lost Creek project spanning approximately 48,000 acres in Wyoming’s Great Divide Basin. Ur-Energy is positioned as a key player in the uranium industry with a market cap near 600M USD.
IsoEnergy Ltd. Overview
IsoEnergy Ltd., incorporated in 2016 and based in Saskatoon, Canada, is engaged in acquiring, developing, evaluating, and exploring uranium mineral properties mainly in the Athabasca Basin, Saskatchewan. It holds interests in multiple properties, including Larocque East and Geiger, and operates as a subsidiary of NexGen Energy Ltd. IsoEnergy has a market cap close to 600M USD and a smaller workforce compared to Ur-Energy.
Key similarities and differences
Both companies operate in the uranium sector with similar market capitalizations around 600M USD and are listed on the AMEX exchange. Ur-Energy has a longer operational history and a significantly larger employee base, focusing on U.S. properties, while IsoEnergy is newer, Canadian-based, and benefits from being a subsidiary of a larger energy company. Their business models share exploration and development activities but differ in geographic focus and scale.
Income Statement Comparison
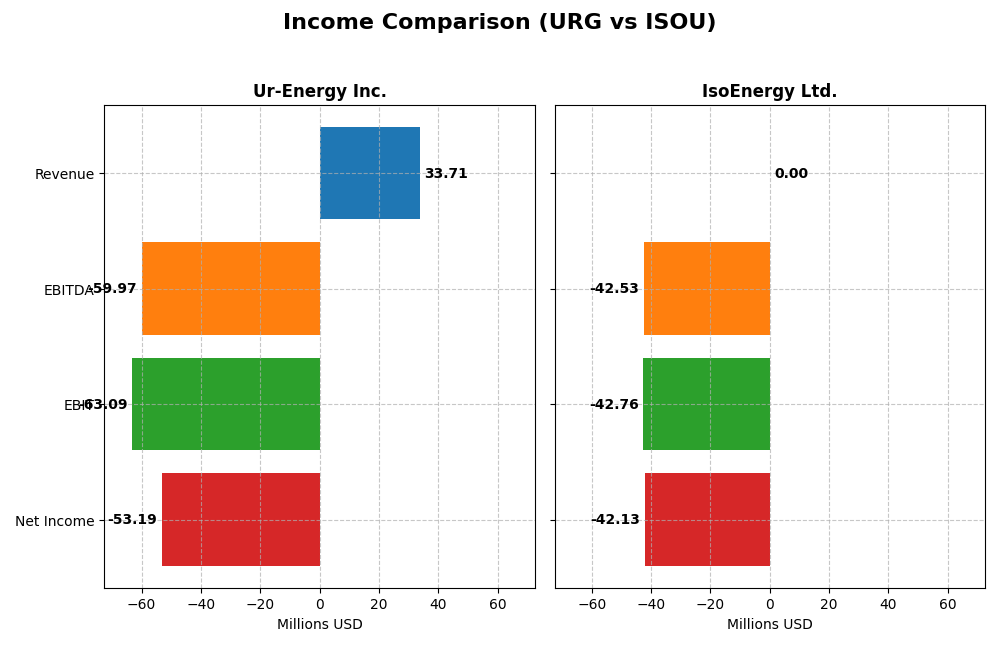
The table below compares key income statement metrics for Ur-Energy Inc. and IsoEnergy Ltd. for the fiscal year 2024, reflecting their financial performance in their respective currencies.
| Metric | Ur-Energy Inc. (URG) | IsoEnergy Ltd. (ISOU) |
|---|---|---|
| Market Cap | 598M USD | 599M CAD |
| Revenue | 33.7M USD | 0 CAD |
| EBITDA | -59.97M USD | -42.53M CAD |
| EBIT | -63.09M USD | -42.76M CAD |
| Net Income | -53.19M USD | -42.14M CAD |
| EPS | -0.17 USD | -1.38 CAD |
| Fiscal Year | 2024 | 2024 |
Income Statement Interpretations
Ur-Energy Inc.
Over 2020-2024, Ur-Energy’s revenue rose significantly by 305% but net income declined by 260%, reflecting persistent losses. Margins remained negative, with gross margin at -26.6% and net margin at -157.8%. In 2024, revenue nearly doubled compared to 2023, yet gross profit sharply worsened, deepening operating losses despite a slight improvement in net margin.
IsoEnergy Ltd.
IsoEnergy displayed no revenue over 2020-2024, maintaining zero gross profit and negative net income, which worsened by over 340%. Margins stayed unfavorable with zero gross and EBIT margins, though interest expenses were controlled. The 2024 fiscal year showed increased operating losses and a steep 77% EPS decline, reflecting continued operational challenges without growth.
Which one has the stronger fundamentals?
Both companies show unfavorable overall income statement performance, but Ur-Energy’s significant revenue growth and partial margin improvement contrast with IsoEnergy’s stagnant revenue and deeper net losses. Ur-Energy’s ability to grow sales and improve net margin slightly provides somewhat stronger fundamentals despite ongoing losses, whereas IsoEnergy remains heavily loss-making without revenue generation.
Financial Ratios Comparison
Below is a comparison table of the most recent key financial ratios for Ur-Energy Inc. and IsoEnergy Ltd., reflecting their fiscal year 2024 performance.
| Ratios | Ur-Energy Inc. (URG) | IsoEnergy Ltd. (ISOU) |
|---|---|---|
| ROE | -40.1% | -13.9% |
| ROIC | -36.0% | -12.5% |
| P/E | -6.87 | -9.64 |
| P/B | 2.75 | 1.34 |
| Current Ratio | 5.99 | 1.70 |
| Quick Ratio | 4.91 | 1.70 |
| D/E (Debt to Equity) | 0.009 | 0.10 |
| Debt-to-Assets | 0.64% | 9.0% |
| Interest Coverage | 0 | -32.1 |
| Asset Turnover | 0.17 | 0 |
| Fixed Asset Turnover | 0 | 0 |
| Payout ratio | 0 | 0 |
| Dividend yield | 0 | 0 |
Interpretation of the Ratios
Ur-Energy Inc.
Ur-Energy Inc. shows several unfavorable ratios, including negative net margin (-157.8%) and return on equity (-40.05%), indicating profitability challenges. Its current ratio is high at 5.99 but marked unfavorable, implying possible inefficient asset use. The company does not pay dividends, likely reflecting reinvestment or development phase priorities.
IsoEnergy Ltd.
IsoEnergy Ltd. presents more balanced ratios with 42.86% favorable and 50% unfavorable. It has a moderate current ratio of 1.7, which is favorable, but suffers from negative return on equity (-13.9%) and an unfavorable interest coverage ratio (-31.1). IsoEnergy also does not pay dividends, consistent with a growth or exploration focus.
Which one has the best ratios?
IsoEnergy Ltd. has a slightly more favorable ratio profile overall, with higher proportions of positive liquidity and solvency metrics compared to Ur-Energy Inc. However, both companies face profitability and operational challenges, reflected in negative returns and interest coverage issues, suggesting caution when interpreting the financial strength of either.
Strategic Positioning
This section compares the strategic positioning of Ur-Energy Inc. and IsoEnergy Ltd. including Market position, Key segments, and disruption:
Ur-Energy Inc.
- Operates 12 uranium projects in the US with moderate market cap, facing typical industry competition.
- Key driver is uranium exploration and production, flagship Lost Creek project in Wyoming dominates portfolio.
- No explicit indication of exposure to technological disruption in uranium mining sector from provided data.
IsoEnergy Ltd.
- Focuses on uranium properties in Canada’s Athabasca Basin, similarly sized market cap but smaller workforce.
- Concentrates on uranium acquisition and exploration, with several properties in Saskatchewan, Canada.
- No explicit indication of exposure to technological disruption in uranium mining sector from provided data.
Ur-Energy Inc. vs IsoEnergy Ltd. Positioning
Ur-Energy has a diversified US-based uranium portfolio with multiple projects, while IsoEnergy concentrates on Canadian properties with fewer employees. Ur-Energy’s larger asset base contrasts with IsoEnergy’s focused regional footprint, reflecting different strategic scales and operational scopes.
Which has the best competitive advantage?
Both companies are shedding value with ROIC below WACC; Ur-Energy shows a very unfavorable moat, while IsoEnergy’s slightly unfavorable moat reflects improving profitability but still no value creation.
Stock Comparison
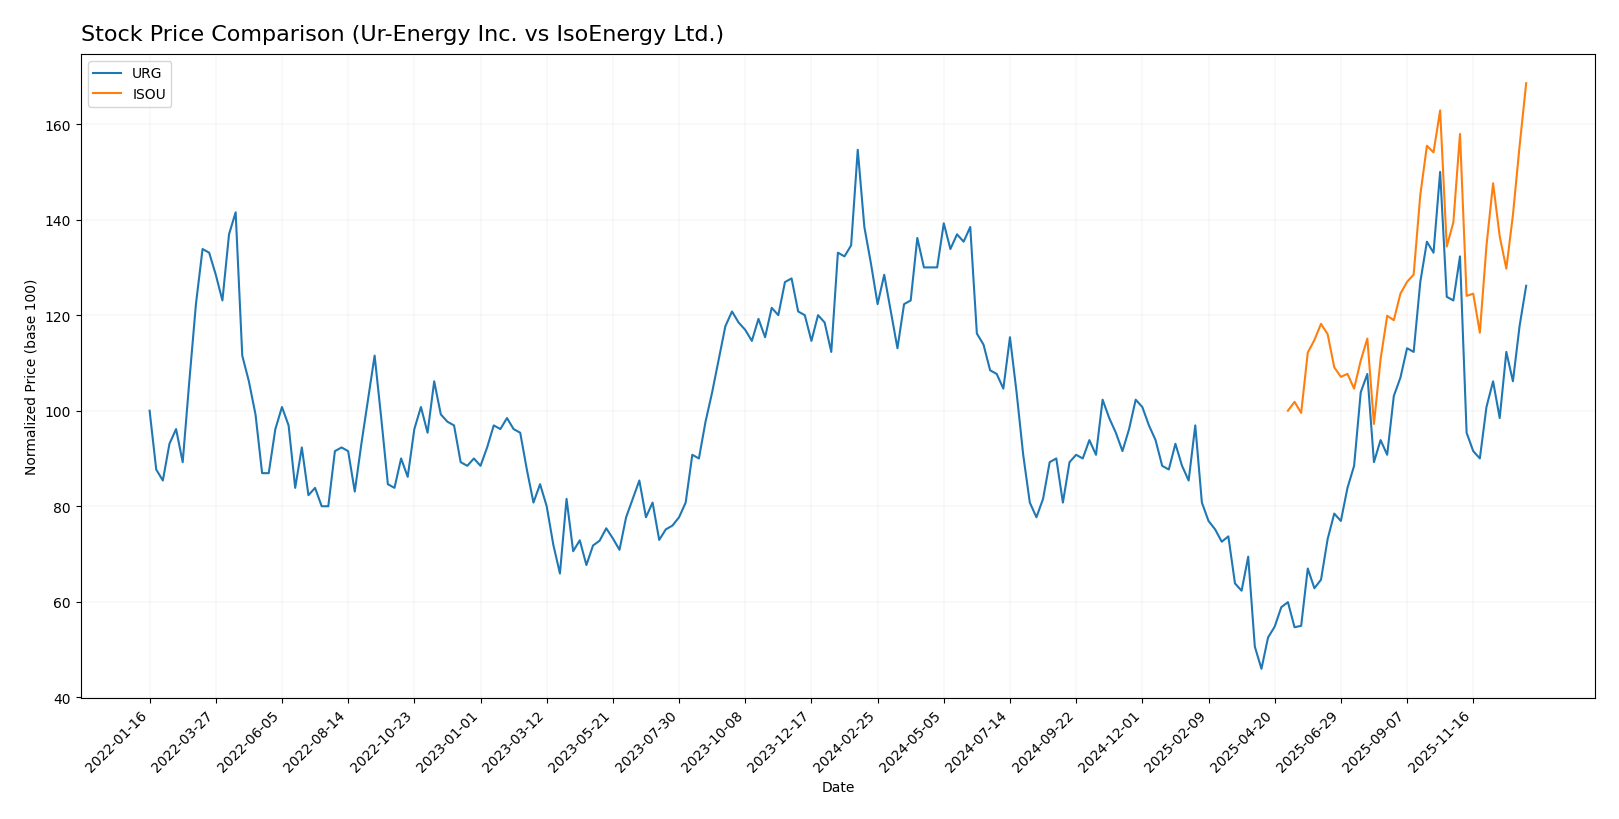
The stock price chart reflects contrasting dynamics over the past year, with Ur-Energy Inc. showing a moderate decline and IsoEnergy Ltd. experiencing significant gains alongside increasing trading volumes.
Trend Analysis
Ur-Energy Inc. (URG) exhibited a bearish trend over the past 12 months with a -3.53% price change and acceleration in the downward movement, fluctuating between 0.6 and 1.95, with modest volatility at 0.31 std deviation.
IsoEnergy Ltd. (ISOU) demonstrated a strong bullish trend with a 68.57% price increase and accelerating momentum, reaching a high of 10.94 and a low of 6.31, accompanied by higher volatility of 1.25 std deviation.
Comparing both, IsoEnergy Ltd. delivered the highest market performance with substantial gains and buyer dominance, while Ur-Energy Inc. showed a declining trend despite recent modest recovery.
Target Prices
The target price consensus for Ur-Energy Inc. indicates potential upside from current levels.
| Company | Target High | Target Low | Consensus |
|---|---|---|---|
| Ur-Energy Inc. | 2.60 | 2.15 | 2.38 |
Analysts expect Ur-Energy’s stock to trade between $2.15 and $2.60, with a consensus target of $2.38, well above the current price of $1.64. No verified target price data is available for IsoEnergy Ltd.
Analyst Opinions Comparison
This section compares analysts’ ratings and grades for Ur-Energy Inc. and IsoEnergy Ltd.:
Rating Comparison
URG Rating
- Rating: D+ indicating a very favorable rating status.
- Discounted Cash Flow Score: 1, very unfavorable, suggesting poor cash flow valuation.
- ROE Score: 1, very unfavorable, showing inefficient profit generation from equity.
- ROA Score: 1, very unfavorable, reflecting poor asset utilization.
- Debt To Equity Score: 2, moderate, indicating average financial risk.
- Overall Score: 1, very unfavorable, indicating weak financial standing.
ISOU Rating
- Rating: C- indicating a very favorable rating status.
- Discounted Cash Flow Score: 1, very unfavorable, indicating similar valuation concerns.
- ROE Score: 1, very unfavorable, also indicating low profit efficiency.
- ROA Score: 1, very unfavorable, similarly poor asset use.
- Debt To Equity Score: 3, moderate, showing slightly better balance sheet strength.
- Overall Score: 1, very unfavorable, reflecting similar financial challenges.
Which one is the best rated?
Based strictly on the data, IsoEnergy Ltd. holds a slightly better debt-to-equity score than Ur-Energy Inc., but both have identical overall and profitability scores, making their ratings broadly comparable with minor differences in financial risk.
Scores Comparison
The scores of Ur-Energy Inc. and IsoEnergy Ltd. are compared below based on their Altman Z-Score and Piotroski Score:
URG Scores
- Altman Z-Score: 0.60, indicating financial distress and high bankruptcy risk.
- Piotroski Score: 2, classified as very weak financial strength.
ISOU Scores
- Altman Z-Score: 19.22, indicating a safe zone with very low bankruptcy risk.
- Piotroski Score: 2, classified as very weak financial strength.
Which company has the best scores?
IsoEnergy Ltd. shows a significantly stronger Altman Z-Score, placing it in a safe financial zone, while both companies share equally weak Piotroski Scores. Thus, IsoEnergy holds the better overall financial stability score based on this data.
Grades Comparison
Here is a detailed comparison of the latest grades assigned to the two companies:
Ur-Energy Inc. Grades
The table below shows recent grades from notable grading companies for Ur-Energy Inc.:
| Grading Company | Action | New Grade | Date |
|---|---|---|---|
| HC Wainwright & Co. | Maintain | Buy | 2025-11-04 |
| B. Riley Securities | Maintain | Buy | 2025-09-25 |
| Roth Capital | Maintain | Buy | 2025-09-23 |
| HC Wainwright & Co. | Maintain | Buy | 2025-04-15 |
| HC Wainwright & Co. | Maintain | Buy | 2025-02-11 |
| Roth MKM | Maintain | Buy | 2024-10-23 |
| B. Riley Securities | Maintain | Buy | 2024-08-20 |
| HC Wainwright & Co. | Maintain | Buy | 2024-08-14 |
| HC Wainwright & Co. | Maintain | Buy | 2024-07-17 |
| Roth MKM | Maintain | Buy | 2024-05-09 |
Ur-Energy Inc. consistently receives “Buy” ratings from multiple reputable grading companies over recent periods, indicating a stable positive outlook.
There are no reliable grades available for IsoEnergy Ltd., indicating a lack of consensus analyst coverage or public grading data.
Which company has the best grades?
Ur-Energy Inc. clearly has superior and consistent grades compared to IsoEnergy Ltd., which lacks any available grades. This consistency may suggest stronger analyst confidence in Ur-Energy, potentially influencing investor sentiment and portfolio decisions accordingly.
Strengths and Weaknesses
Below is a comparison of key strengths and weaknesses for Ur-Energy Inc. (URG) and IsoEnergy Ltd. (ISOU) based on the most recent financial and strategic data.
| Criterion | Ur-Energy Inc. (URG) | IsoEnergy Ltd. (ISOU) |
|---|---|---|
| Diversification | Limited diversification; focused uranium | Limited diversification; focused uranium |
| Profitability | Very unfavorable; negative net margin (-157.8%), negative ROIC (-36%) | Slightly unfavorable; zero net margin, negative ROIC (-12.5%) but improving |
| Innovation | No significant indicators of innovation | No significant indicators of innovation |
| Global presence | Modest; primarily North American market | Modest; primarily Canadian market |
| Market Share | Small player in uranium sector | Small player in uranium sector |
Key takeaways: Both companies operate in a niche uranium market with limited diversification and modest global presence. Ur-Energy shows significantly deteriorating profitability and value destruction, while IsoEnergy, despite current losses, demonstrates improving profitability trends. Investors should exercise caution and monitor profitability improvements closely before committing capital.
Risk Analysis
Below is a comparative table highlighting key risks for Ur-Energy Inc. (URG) and IsoEnergy Ltd. (ISOU) based on the most recent data from 2024-2026.
| Metric | Ur-Energy Inc. (URG) | IsoEnergy Ltd. (ISOU) |
|---|---|---|
| Market Risk | Moderate (Beta 1.04, volatile uranium sector) | Moderate (Beta 0.96, uranium exploration) |
| Debt level | Very Low (Debt/Equity 0.01, minimal leverage) | Low (Debt/Equity 0.10, manageable debt) |
| Regulatory Risk | High (US mining regulations, environmental permits) | High (Canadian uranium mining permits, regulatory scrutiny) |
| Operational Risk | Moderate (12 US projects, operational complexity) | Moderate (Focus on Athabasca Basin, exploration stage) |
| Environmental Risk | Significant (uranium mining impact, Wyoming site) | Significant (exploration in sensitive Canadian regions) |
| Geopolitical Risk | Moderate (US policies on nuclear energy) | Moderate (Canada’s uranium export policies, global nuclear demand) |
Both companies face substantial regulatory and environmental risks due to uranium mining’s sensitive nature. Ur-Energy shows very low debt but suffers financial distress signals, while IsoEnergy has a safer financial position but remains in early development stages. Regulatory changes and uranium market volatility represent the most impactful risks for investors.
Which Stock to Choose?
Ur-Energy Inc. (URG) shows a mixed income evolution with a 90.66% revenue growth in 2024 but an overall unfavorable income statement and declining profitability. Its financial ratios are mostly unfavorable, though it maintains low debt and a very favorable rating despite weak scores.
IsoEnergy Ltd. (ISOU) exhibits stagnant income evolution without growth in revenue or profit, coupled with largely unfavorable financial ratios. Despite low debt and a slightly better rating than URG, its profitability remains negative, though ROIC shows a positive trend.
Investors focused on value creation and improving profitability might see ISOU’s growing ROIC and moderate financial health as a sign of potential, while those emphasizing market cap stability and low debt could interpret URG’s strong rating and recent revenue growth differently. The choice could depend on an investor’s tolerance for risk and preference for either improving profitability or financial leverage.
Disclaimer: Investment carries a risk of loss of initial capital. The past performance is not a reliable indicator of future results. Be sure to understand risks before making an investment decision.
Go Further
I encourage you to read the complete analyses of Ur-Energy Inc. and IsoEnergy Ltd. to enhance your investment decisions: