NexGen Energy Ltd. (NXE) and IsoEnergy Ltd. (ISOU) are two prominent players in the uranium mining industry, both operating primarily in Canada’s Athabasca Basin. While NexGen is a well-established exploration and development company, IsoEnergy, a subsidiary of NexGen, focuses on complementary uranium properties with a leaner operation. This article will analyze their strategies and market positions to help you decide which uranium stock deserves a place in your investment portfolio.

Table of contents
Companies Overview
I will begin the comparison between NexGen Energy Ltd. and IsoEnergy Ltd. by providing an overview of these two companies and their main differences.
NexGen Energy Ltd. Overview
NexGen Energy Ltd. is an exploration and development stage company focused on uranium properties in Canada. Its main asset, the Rook I project, covers 35,065 hectares in the southwestern Athabasca Basin of Saskatchewan. Headquartered in Vancouver, NexGen operates in the energy sector with a market cap of approximately 7B USD, employing 133 full-time staff.
IsoEnergy Ltd. Overview
IsoEnergy Ltd. engages in the acquisition, development, evaluation, and exploration of uranium mineral properties primarily in the Athabasca Basin of Saskatchewan. Incorporated in 2016 and based in Saskatoon, the company holds interests in multiple properties and functions as a subsidiary of NexGen. IsoEnergy has a market cap near 600M USD and employs 18 people.
Key similarities and differences
Both companies operate in the uranium industry within Canada’s Athabasca Basin, focusing on exploration and development of mineral properties. NexGen is the larger parent company with a significantly higher market cap and workforce, while IsoEnergy is a smaller subsidiary with multiple property interests. Their business models align on uranium exploration but differ in scale and corporate structure.
Income Statement Comparison
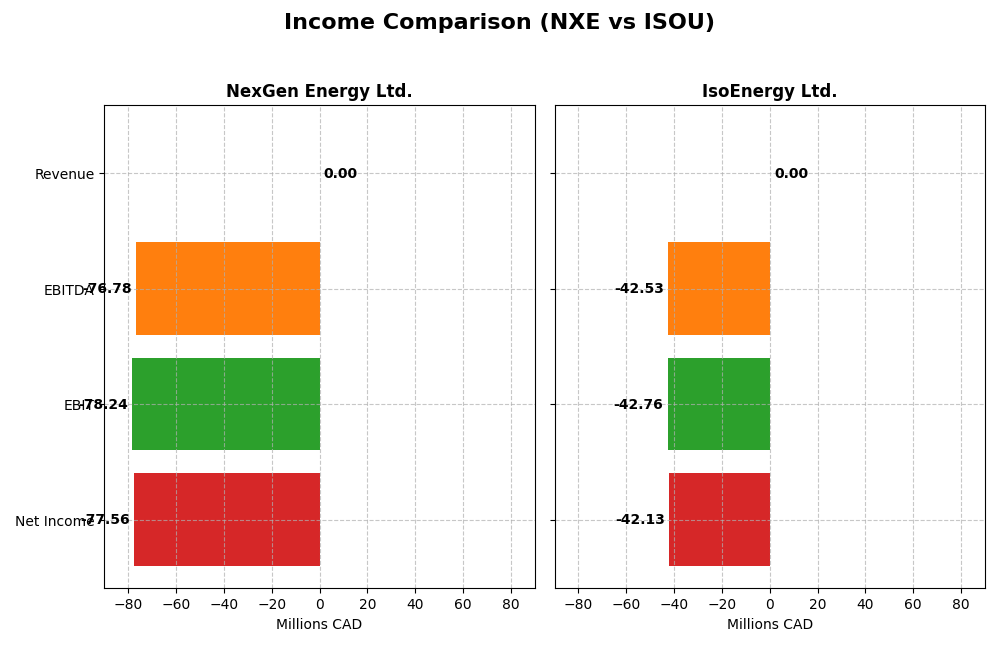
The table below presents a side-by-side comparison of key income statement metrics for NexGen Energy Ltd. and IsoEnergy Ltd. for the fiscal year 2024.
| Metric | NexGen Energy Ltd. | IsoEnergy Ltd. |
|---|---|---|
| Market Cap | 7.0B | 599M |
| Revenue | 0 | 0 |
| EBITDA | -76.8M | -42.5M |
| EBIT | -78.2M | -42.8M |
| Net Income | -77.6M | -42.1M |
| EPS | -0.14 | -1.38 |
| Fiscal Year | 2024 | 2024 |
Income Statement Interpretations
NexGen Energy Ltd.
NexGen Energy Ltd. reported zero revenue consistently from 2020 to 2024, with net income fluctuating from a loss of -86M CAD in 2020 to a profit of 81M CAD in 2023, then back to a loss of -78M CAD in 2024. Margins remained unfavorable with no gross or EBIT margin reported, though interest expense control was favorable. The 2024 year saw a sharp decline in EBIT and net income, signaling volatility.
IsoEnergy Ltd.
IsoEnergy Ltd. also recorded zero revenue throughout 2020-2024, with increasing net losses worsening from -9.5M CAD in 2020 to -42M CAD in 2024. Margins consistently showed unfavorable gross, EBIT, and net margin metrics. The 2024 performance revealed further deterioration in EBIT and EPS, with operating expenses rising sharply relative to previous years, indicating increased financial pressure.
Which one has the stronger fundamentals?
Both companies show unfavorable income statement fundamentals, lacking revenue generation and reporting losses in recent years. NexGen Energy’s net income exhibited volatility but improved net income and EPS over the longer term, contrasting with IsoEnergy’s persistent and deepening losses. However, both companies face challenges with unprofitable operations and weak margins, reflecting high risk in their financial profiles.
Financial Ratios Comparison
The table below presents the key financial ratios for NexGen Energy Ltd. (NXE) and IsoEnergy Ltd. (ISOU) based on their most recent fiscal year 2024 data, providing a snapshot of their financial health and performance.
| Ratios | NexGen Energy Ltd. (NXE) | IsoEnergy Ltd. (ISOU) |
|---|---|---|
| ROE | -6.58% | -13.90% |
| ROIC | -4.39% | -12.50% |
| P/E | -67.80 | -9.64 |
| P/B | 4.46 | 1.34 |
| Current Ratio | 1.03 | 1.70 |
| Quick Ratio | 1.03 | 1.70 |
| D/E (Debt-to-Equity) | 0.39 | 0.10 |
| Debt-to-Assets | 27.56% | 9.00% |
| Interest Coverage | -2.33 | -32.10 |
| Asset Turnover | 0 | 0 |
| Fixed Asset Turnover | 0 | 0 |
| Payout Ratio | 0% | 0% |
| Dividend Yield | 0% | 0% |
Interpretation of the Ratios
NexGen Energy Ltd.
NexGen Energy Ltd. shows mostly unfavorable ratios in 2024, including negative returns on equity (-6.58%) and invested capital (-4.39%), combined with a high weighted average cost of capital (12.21%). However, capital structure ratios such as debt-to-equity (0.39) and debt-to-assets (27.56%) are favorable. The company does not pay dividends, reflecting its exploration and development stage, focusing on reinvestment rather than shareholder returns.
IsoEnergy Ltd.
IsoEnergy Ltd. presents a mixed ratio profile with 42.86% favorable and 50% unfavorable ratios in 2024. It has a weaker return on equity (-13.9%) and return on invested capital (-12.5%) but benefits from strong liquidity (current ratio 1.7) and low leverage (debt-to-equity 0.1). IsoEnergy also pays no dividends, likely prioritizing growth and resource development as a subsidiary of NexGen Energy Ltd.
Which one has the best ratios?
Between the two, IsoEnergy Ltd. holds a slightly more favorable ratio profile with higher liquidity and lower leverage, while NexGen Energy Ltd. faces more pronounced profitability challenges and higher cost of capital. Neither company pays dividends, consistent with their exploration focus and reinvestment strategies, but IsoEnergy’s ratios suggest a marginally stronger financial position in 2024.
Strategic Positioning
This section compares the strategic positioning of NexGen Energy Ltd. and IsoEnergy Ltd., focusing on market position, key segments, and exposure to disruption:
NexGen Energy Ltd.
- Larger market cap of 7B USD, facing typical uranium sector pressures.
- Focused on uranium exploration and development, principal asset Rook I project.
- Both companies operate in uranium exploration with no explicit tech disruption info.
IsoEnergy Ltd.
- Smaller market cap of 600M USD, subsidiary status limits independence.
- Concentrated on uranium exploration with multiple Athabasca Basin properties.
- Similar exposure as a uranium explorer, no technological disruption detailed.
NexGen Energy Ltd. vs IsoEnergy Ltd. Positioning
NexGen maintains a larger, more established market presence with a primary asset focus, while IsoEnergy operates as a smaller, subsidiary company with multiple uranium properties. Both are concentrated in uranium exploration, limiting diversification benefits.
Which has the best competitive advantage?
Both companies show slightly unfavorable MOAT evaluations, shedding value but with improving profitability trends, indicating limited but growing competitive advantages based on ROIC versus WACC analysis.
Stock Comparison
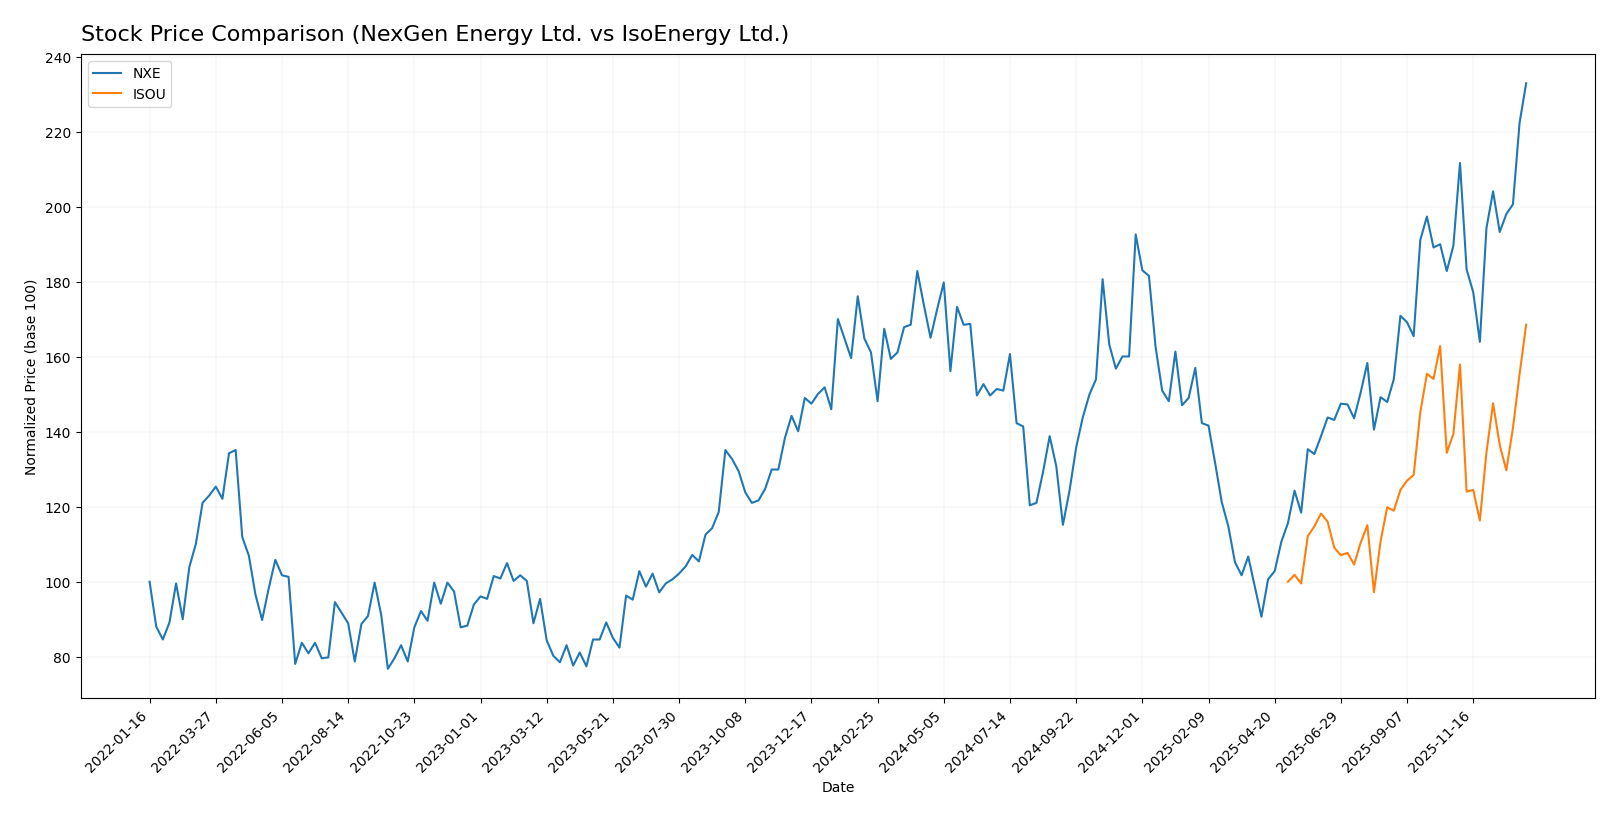
The stock price chart highlights significant bullish momentum for both NexGen Energy Ltd. (NXE) and IsoEnergy Ltd. (ISOU) over the past 12 months, with accelerating upward trends and increasing buyer dominance in trading activity.
Trend Analysis
NexGen Energy Ltd. (NXE) exhibited a 44.55% price increase over the past year, confirming a bullish trend with acceleration. The stock traded between 4.18 and 10.74, showing moderate volatility (1.3 std deviation).
IsoEnergy Ltd. (ISOU) showed a 68.57% price gain over the same period, also a bullish trend with acceleration. Price ranged from 6.31 to 10.94, with slightly lower volatility (1.25 std deviation).
IsoEnergy outperformed NexGen in market performance with a higher overall price appreciation of 68.57% compared to 44.55% over the past year.
Target Prices
No verified target price data is available from recognized analysts for NexGen Energy Ltd. and IsoEnergy Ltd. Market sentiment for these uranium stocks remains speculative without consensus guidance.
Analyst Opinions Comparison
This section compares analysts’ ratings and grades for NexGen Energy Ltd. and IsoEnergy Ltd.:
Rating Comparison
NexGen Energy Ltd. Rating
- Rating: D+ with a very favorable overall status.
- Discounted Cash Flow Score: 2, indicating moderate valuation.
- ROE Score: 1, very unfavorable efficiency in equity returns.
- ROA Score: 1, very unfavorable asset utilization.
- Debt To Equity Score: 1, very unfavorable financial risk.
- Overall Score: 1, very unfavorable summary rating.
IsoEnergy Ltd. Rating
- Rating: C- with a very favorable overall status.
- Discounted Cash Flow Score: 1, indicating very unfavorable valuation.
- ROE Score: 1, very unfavorable efficiency in equity returns.
- ROA Score: 1, very unfavorable asset utilization.
- Debt To Equity Score: 3, moderate financial risk.
- Overall Score: 1, very unfavorable summary rating.
Which one is the best rated?
Based strictly on the data, NexGen Energy Ltd. and IsoEnergy Ltd. share the same very unfavorable overall score of 1. NexGen has a better discounted cash flow score, but IsoEnergy shows a more moderate debt-to-equity score, reflecting differing financial risk profiles.
Scores Comparison
The comparison of NexGen Energy Ltd. and IsoEnergy Ltd. scores is as follows:
NexGen Energy Ltd. Scores
- Altman Z-Score: 6.89, indicating strong financial stability in the safe zone.
- Piotroski Score: 1, indicating very weak financial strength.
IsoEnergy Ltd. Scores
- Altman Z-Score: 19.22, indicating very strong financial stability in the safe zone.
- Piotroski Score: 2, indicating very weak financial strength.
Which company has the best scores?
IsoEnergy Ltd. has a notably higher Altman Z-Score than NexGen Energy Ltd., indicating stronger financial stability. Both companies have very weak Piotroski Scores, with IsoEnergy slightly higher but still in the very weak range.
Grades Comparison
The following section compares the available grade data for NexGen Energy Ltd. and IsoEnergy Ltd.:
NexGen Energy Ltd. Grades
This table summarizes the latest analyst action consensus for NexGen Energy Ltd.:
| Grading Company | Action | New Grade | Date |
|---|---|---|---|
| Consensus | Buy | Buy | N/A |
The overall trend for NexGen Energy Ltd. shows a unanimous buy consensus from analysts, indicating positive market sentiment.
IsoEnergy Ltd. Grades
No reliable grade data is available for IsoEnergy Ltd., preventing further analysis.
Which company has the best grades?
NexGen Energy Ltd. holds the better grades with a clear buy consensus, while IsoEnergy Ltd. lacks grade data; this may influence investors seeking more transparent analyst coverage.
Strengths and Weaknesses
Below is a comparison of key strengths and weaknesses for NexGen Energy Ltd. (NXE) and IsoEnergy Ltd. (ISOU) based on the most recent financial and operational data.
| Criterion | NexGen Energy Ltd. (NXE) | IsoEnergy Ltd. (ISOU) |
|---|---|---|
| Diversification | Limited product/service diversification; focused on uranium exploration | Limited diversification; also uranium-focused but with a smaller asset base |
| Profitability | Negative ROIC (-4.39%), shedding value but with growing profitability trend | Negative ROIC (-12.5%), shedding value but profitability improving moderately |
| Innovation | Moderate innovation capacity; improving operational efficiency | Smaller scale innovation efforts; focused on exploration technology improvements |
| Global presence | Limited global footprint, primarily Canadian operations | Primarily Canadian operations with limited global reach |
| Market Share | Emerging player in uranium market with growth potential | Smaller market share, niche player in uranium exploration |
Key takeaways: Both companies face challenges in profitability and diversification, with NXE showing a slightly better trajectory in ROIC improvement. IsoEnergy maintains a stronger balance sheet but remains a smaller player. Investors should weigh growth potential against current value destruction risks.
Risk Analysis
Below is a comparative table of key risks for NexGen Energy Ltd. (NXE) and IsoEnergy Ltd. (ISOU) based on the most recent data from 2024–2026.
| Metric | NexGen Energy Ltd. (NXE) | IsoEnergy Ltd. (ISOU) |
|---|---|---|
| Market Risk | High beta 1.856, volatile price range (3.91-11.33 USD) | Moderate beta 0.955, less volatile (4.52-11.5 USD) |
| Debt level | Moderate debt-to-assets 27.56%, debt/equity 0.39 (favorable) | Low debt-to-assets 9%, debt/equity 0.1 (favorable) |
| Regulatory Risk | Exposure to uranium mining regulations in Canada; potential changes in nuclear policy | Similar regulatory environment, subsidiary status may add complexity |
| Operational Risk | Development-stage project with no current revenue; weak financial ratios (negative ROE, ROIC) | Early-stage exploration; very limited operational scale, negative profitability |
| Environmental Risk | Uranium mining with potential environmental liabilities, requires strict compliance | Same industry risks; smaller scale but similar exposure |
| Geopolitical Risk | Canadian jurisdiction stable but global uranium market sensitive to geopolitical tensions | Same geographic and market risks; subsidiary linked to NXE |
The most likely and impactful risks for both companies are operational and market risks due to their early development stages and exposure to uranium price fluctuations. NexGen’s higher beta suggests more price volatility, while both companies face significant regulatory and environmental compliance challenges inherent in uranium mining. Financially, both show weak profitability and coverage ratios, signaling elevated risk.
Which Stock to Choose?
NexGen Energy Ltd. (NXE) shows an unfavorable income statement with stagnant revenue and net margin, coupled with mostly unfavorable financial ratios, despite a few favorable debt metrics. The company’s profitability remains negative, and its rating is very favorable overall but reflects significant financial weaknesses.
IsoEnergy Ltd. (ISOU) also faces an unfavorable income trend with declining net income and earnings per share. Financial ratios are slightly less unfavorable than NXE’s, especially in liquidity and debt metrics, but profitability is negative and the overall rating is very favorable, indicating ongoing financial challenges.
For investors prioritizing financial stability and moderate leverage, ISOU’s slightly better liquidity and debt ratios might appear more favorable, while those focused on potential growth amid financial strain could find NXE’s improving profitability trend and market capitalization more relevant. The choice might therefore depend on the investor’s risk tolerance and strategy preferences.
Disclaimer: Investment carries a risk of loss of initial capital. The past performance is not a reliable indicator of future results. Be sure to understand risks before making an investment decision.
Go Further
I encourage you to read the complete analyses of NexGen Energy Ltd. and IsoEnergy Ltd. to enhance your investment decisions: