In the dynamic uranium industry, IsoEnergy Ltd. and enCore Energy Corp. stand out as key players with distinct strategies and market footprints. IsoEnergy focuses on Canadian uranium mineral properties, while enCore Energy develops extensive U.S. projects. Both companies emphasize resource acquisition and development, vying for leadership through innovation and strategic positioning. This article will help you determine which company presents the most compelling investment opportunity in 2026.
Table of contents
Companies Overview
I will begin the comparison between IsoEnergy Ltd. and enCore Energy Corp. by providing an overview of these two companies and their main differences.
IsoEnergy Ltd. Overview
IsoEnergy Ltd. focuses on the acquisition, development, evaluation, and exploration of uranium mineral properties, primarily in the Athabasca Basin of Saskatchewan, Canada. Incorporated in 2016, it operates as a subsidiary of NexGen Energy Ltd., positioning itself as a specialized player in the uranium sector with a market cap of approximately 600M USD and a relatively modest workforce of 18 employees.
enCore Energy Corp. Overview
enCore Energy Corp. is engaged in the acquisition, exploration, and development of uranium resources across several projects in the United States, including locations in New Mexico, Utah, South Dakota, and Wyoming. Founded in 2011 and headquartered in Corpus Christi, Texas, enCore holds extensive land positions totaling hundreds of thousands of acres with a market cap near 519M USD, highlighting its substantial footprint in the U.S. uranium industry.
Key similarities and differences
Both IsoEnergy and enCore operate in the uranium industry, focusing on exploration and development of uranium mineral properties. IsoEnergy concentrates on Canadian properties with a smaller market cap and employee base, while enCore has a broader geographic presence across the U.S. and larger land holdings. IsoEnergy is a subsidiary of NexGen Energy, contrasting with enCore’s independent status, reflecting differences in corporate structure and scale.
Income Statement Comparison
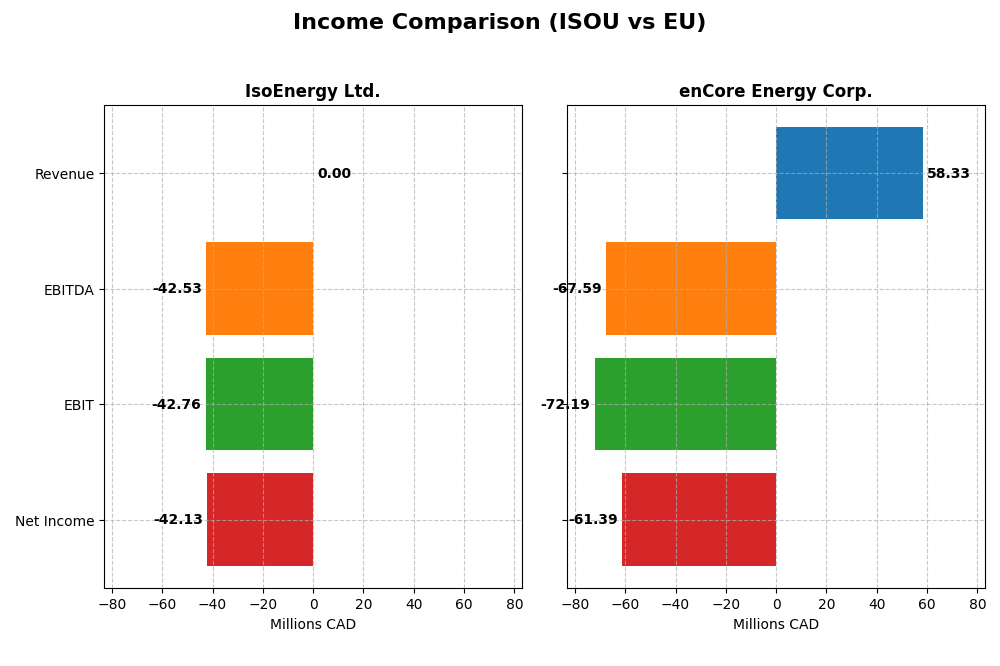
The table below compares the key income statement metrics for IsoEnergy Ltd. and enCore Energy Corp. for the fiscal year 2024.
| Metric | IsoEnergy Ltd. (ISOU) | enCore Energy Corp. (EU) |
|---|---|---|
| Market Cap | 599M CAD | 519M USD |
| Revenue | 0 | 58.3M USD |
| EBITDA | -42.5M CAD | -67.6M USD |
| EBIT | -42.8M CAD | -72.2M USD |
| Net Income | -42.1M CAD | -61.4M USD |
| EPS | -1.38 CAD | -0.34 USD |
| Fiscal Year | 2024 | 2024 |
Income Statement Interpretations
IsoEnergy Ltd.
IsoEnergy Ltd. has consistently reported zero revenue from 2020 to 2024, with net income deteriorating from -7.4M CAD in 2022 to -42.1M CAD in 2024. Margins remain unfavorable, with no gross or EBIT margin recorded due to absence of sales. The 2024 fiscal year saw a sharp increase in operating expenses and net loss, indicating worsening profitability despite stable interest expense ratios.
enCore Energy Corp.
enCore Energy Corp. experienced significant revenue growth in 2024, rising to 58.3M USD from 22.1M USD in 2023. However, gross and EBIT margins remained negative and deteriorated further, with net income declining to -61.4M USD. While revenue growth was favorable, rising costs and expenses led to continued net losses and negative earnings per share, reflecting operational challenges.
Which one has the stronger fundamentals?
Both IsoEnergy and enCore Energy show unfavorable income statement fundamentals marked by sustained net losses and negative margins. IsoEnergy’s lack of revenue and steep net income decline contrast with enCore’s revenue growth yet worsening profitability. While enCore shows some favorable revenue growth metrics, neither company demonstrates overall income statement strength, reflecting ongoing financial challenges.
Financial Ratios Comparison
Below is a comparison of key financial ratios for IsoEnergy Ltd. (ISOU) and enCore Energy Corp. (EU) based on their most recent fiscal year data (2024).
| Ratios | IsoEnergy Ltd. (ISOU) | enCore Energy Corp. (EU) |
|---|---|---|
| ROE | -13.9% | -21.5% |
| ROIC | -12.5% | -17.3% |
| P/E | -9.64 | -10.11 |
| P/B | 1.34 | 2.17 |
| Current Ratio | 1.70 | 2.91 |
| Quick Ratio | 1.70 | 2.21 |
| D/E | 0.10 | 0.07 |
| Debt-to-Assets | 9.0% | 5.2% |
| Interest Coverage | -32.1 | -41.6 |
| Asset Turnover | 0 | 0.15 |
| Fixed Asset Turnover | 0 | 0.20 |
| Payout ratio | 0 | 0 |
| Dividend yield | 0 | 0 |
Interpretation of the Ratios
IsoEnergy Ltd.
IsoEnergy Ltd. displays a mixed ratio profile with 42.86% favorable and 50% unfavorable ratios, leading to a slightly unfavorable overall evaluation. Strengths include a solid current ratio of 1.7 and low debt levels, while concerns arise from negative returns on equity and assets, and poor interest coverage. The company does not pay dividends, likely reflecting its exploration stage and reinvestment strategy.
enCore Energy Corp.
enCore Energy Corp. shows an unfavorable ratio set with 35.71% favorable and 57.14% unfavorable ratios. While liquidity ratios are strong, including a current ratio of 2.91, the firm suffers from negative profitability measures and weak asset turnover. It also pays no dividends, consistent with its developmental focus and prioritization of growth and resource acquisition.
Which one has the best ratios?
Between the two, IsoEnergy Ltd. has a slightly better ratio profile, with a higher proportion of favorable ratios and a stronger balance sheet in terms of leverage and liquidity. However, both companies face significant profitability challenges and do not provide shareholder returns through dividends, indicating risks associated with their current financial performance.
Strategic Positioning
This section compares the strategic positioning of IsoEnergy Ltd. and enCore Energy Corp. in terms of market position, key segments, and exposure to technological disruption:
IsoEnergy Ltd.
- Mid-sized uranium company with moderate market cap and lower beta, facing typical energy sector competition.
- Focused on uranium exploration and development in the Athabasca Basin, Canada, with several key property interests.
- Operating in traditional uranium mining with no explicit mention of technological disruption exposure.
enCore Energy Corp.
- Uranium company with slightly smaller market cap but higher beta, operating under NASDAQ with higher volatility.
- Concentrated uranium exploration and development across multiple U.S. projects, holding large acreage in key districts.
- Also focused on conventional uranium resource properties without noted technological disruption factors.
IsoEnergy Ltd. vs enCore Energy Corp. Positioning
IsoEnergy exhibits a more geographically concentrated approach in Canada with fewer employees, while enCore operates multiple U.S. sites spanning larger land areas. IsoEnergy’s slightly larger market cap contrasts with enCore’s broader asset base but higher stock volatility.
Which has the best competitive advantage?
Both companies are shedding value relative to their cost of capital; however, IsoEnergy shows a growing ROIC trend, indicating improving profitability, whereas enCore’s declining ROIC suggests weakening value creation and a less favorable competitive moat.
Stock Comparison
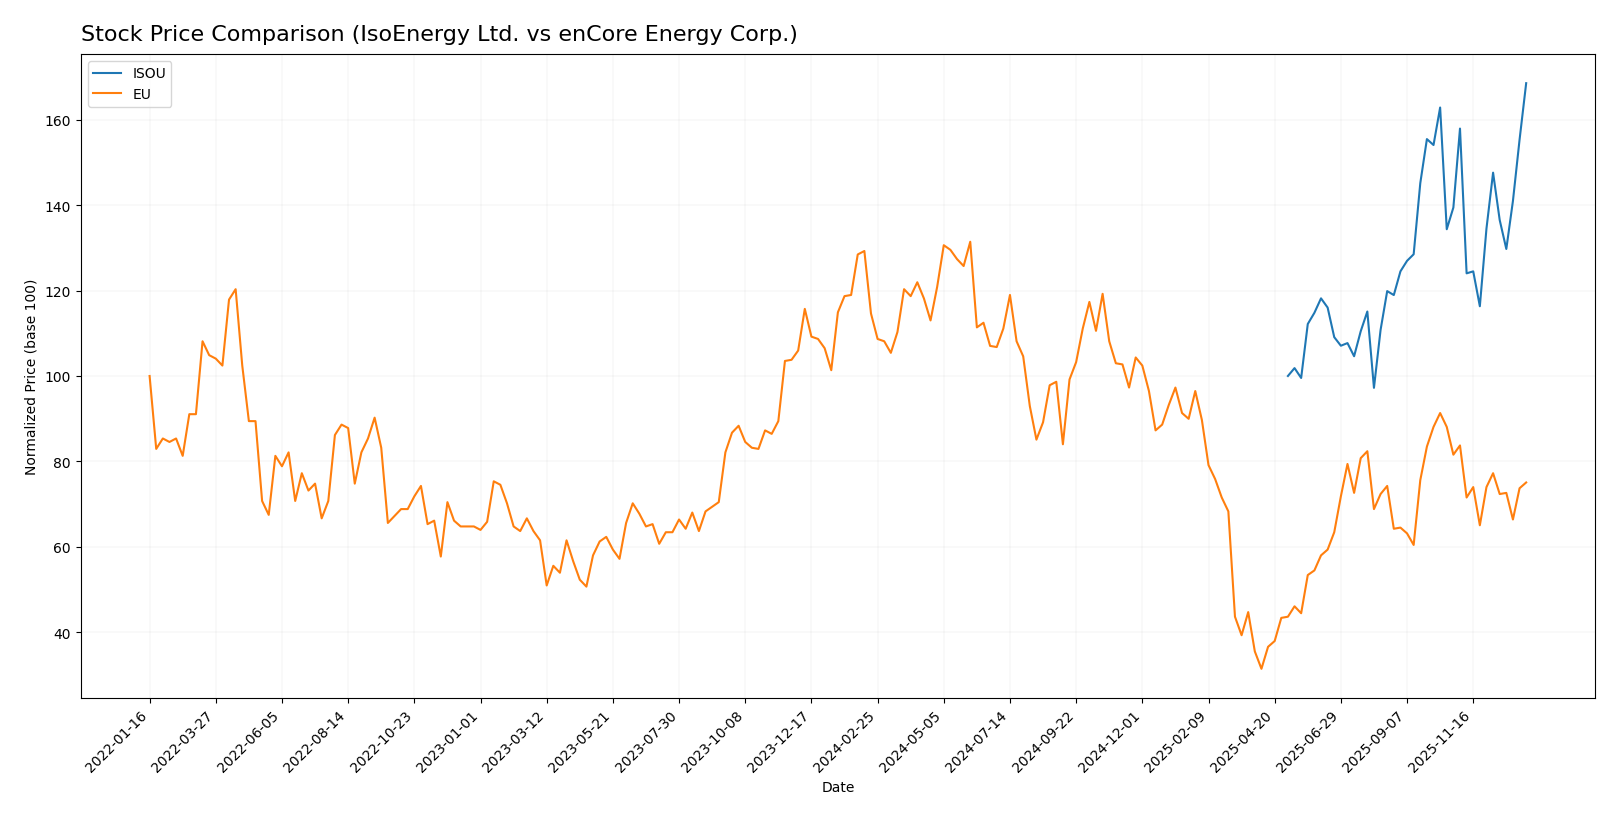
The stock price chart reveals significant price appreciation for IsoEnergy Ltd. (ISOU) contrasted with a marked decline for enCore Energy Corp. (EU) over the past 12 months, reflecting divergent trading dynamics and investor sentiment.
Trend Analysis
IsoEnergy Ltd. (ISOU) exhibited a strong bullish trend over the past year, with a 68.57% price increase and acceleration in momentum. The stock ranged between 6.31 and 10.94, with moderate volatility (std deviation 1.25). Recent months show continued positive momentum.
enCore Energy Corp. (EU) followed a bearish trend over the same period, declining 34.52% with deceleration observed. The price fluctuated between 1.16 and 4.85, showing lower volatility (std deviation 0.92). Recent trend confirms continued downward slope.
Comparing the two, IsoEnergy Ltd. outperformed enCore Energy Corp. significantly, delivering the highest market performance in the 12-month span analyzed.
Target Prices
For enCore Energy Corp., analysts show a clear and unanimous price target consensus.
| Company | Target High | Target Low | Consensus |
|---|---|---|---|
| enCore Energy Corp. | 3.5 | 3.5 | 3.5 |
The $3.5 target consensus suggests analysts expect moderate upside from the current $2.77 stock price. This reflects a generally positive but cautious outlook for enCore Energy.
No verified target price data is available from recognized analysts for IsoEnergy Ltd.
Analyst Opinions Comparison
This section compares analysts’ ratings and grades for IsoEnergy Ltd. and enCore Energy Corp.:
Rating Comparison
IsoEnergy Ltd. Rating
- Rating: C-, considered very favorable by analysts.
- Discounted Cash Flow Score: 1, marked very unfavorable, indicating potential overvaluation risks.
- ROE Score: 1, very unfavorable, suggesting low efficiency in generating profit from equity.
- ROA Score: 1, very unfavorable, showing ineffective asset utilization.
- Debt To Equity Score: 3, moderate, reflecting a balanced financial risk profile.
- Overall Score: 1, very unfavorable, summarizing weak financial standing.
enCore Energy Corp. Rating
- Rating: C-, also considered very favorable.
- Discounted Cash Flow Score: 1, similarly very unfavorable.
- ROE Score: 1, very unfavorable, matching IsoEnergy.
- ROA Score: 1, very unfavorable, identical to IsoEnergy.
- Debt To Equity Score: 2, moderate but indicating slightly higher financial risk than IsoEnergy.
- Overall Score: 1, very unfavorable, equally signifying weak financial health.
Which one is the best rated?
Both IsoEnergy Ltd. and enCore Energy Corp. share the same overall rating of C- and identical unfavorable scores in most financial metrics. IsoEnergy has a slightly better debt-to-equity score, suggesting marginally lower financial risk, but overall, their analyst ratings are very similar.
Scores Comparison
Here is a comparison of IsoEnergy Ltd. and enCore Energy Corp. scores:
IsoEnergy Ltd. Scores
- Altman Z-Score: 19.22, indicating a safe zone.
- Piotroski Score: 2, classified as very weak.
enCore Energy Corp. Scores
- Altman Z-Score: 1.17, indicating a distress zone.
- Piotroski Score: 4, classified as average.
Which company has the best scores?
IsoEnergy Ltd. has a much higher Altman Z-Score, placing it in the safe zone, while enCore Energy is in distress. Conversely, enCore has a better Piotroski Score, indicating stronger financial health compared to IsoEnergy’s very weak score.
Grades Comparison
The following is a comparison of the available grades for IsoEnergy Ltd. and enCore Energy Corp.:
IsoEnergy Ltd. Grades
No reliable grading data is available for IsoEnergy Ltd. from verifiable grading companies. The absence of grades implies limited analyst coverage, which may increase uncertainty for investors.
enCore Energy Corp. Grades
The table below summarizes recent grades assigned to enCore Energy Corp. by recognized grading firms:
| Grading Company | Action | New Grade | Date |
|---|---|---|---|
| HC Wainwright & Co. | Maintain | Buy | 2025-08-12 |
| HC Wainwright & Co. | Maintain | Buy | 2025-05-13 |
| HC Wainwright & Co. | Maintain | Buy | 2025-03-18 |
| HC Wainwright & Co. | Maintain | Buy | 2024-11-19 |
| HC Wainwright & Co. | Maintain | Buy | 2024-10-07 |
| HC Wainwright & Co. | Maintain | Buy | 2024-08-15 |
| HC Wainwright & Co. | Maintain | Buy | 2024-06-14 |
| B. Riley Securities | Maintain | Buy | 2024-05-15 |
The grades for enCore Energy Corp. consistently reflect a “Buy” consensus, indicating stable positive analyst sentiment over the past two years.
Which company has the best grades?
enCore Energy Corp. has consistently received “Buy” grades from reputable grading firms, while IsoEnergy Ltd. lacks any available analyst grades. This suggests enCore Energy enjoys stronger analyst support, potentially providing investors with clearer guidance and reduced uncertainty compared to IsoEnergy.
Strengths and Weaknesses
Below is a comparative overview of the strengths and weaknesses of IsoEnergy Ltd. (ISOU) and enCore Energy Corp. (EU) based on their latest financial and strategic metrics.
| Criterion | IsoEnergy Ltd. (ISOU) | enCore Energy Corp. (EU) |
|---|---|---|
| Diversification | Limited product lines, focused on uranium | Limited product lines, focused on uranium |
| Profitability | Negative ROIC (-12.5%), shedding value; slightly improving trend | Negative ROIC (-17.3%), shedding value; declining trend |
| Innovation | Moderate innovation efforts; improving ROIC trend indicates potential | Limited innovation impact; declining profitability |
| Global presence | Primarily North American operations | Primarily North American operations |
| Market Share | Small player in uranium exploration sector | Small player in uranium exploration sector |
Key takeaways: Both companies currently struggle with profitability and value creation, with negative ROICs indicating value destruction. IsoEnergy shows a slightly improving profitability trend, whereas enCore’s profitability is deteriorating. Both have limited diversification and focus on uranium, which adds sector-specific risk.
Risk Analysis
Below is a comparative risk assessment of IsoEnergy Ltd. (ISOU) and enCore Energy Corp. (EU) based on their latest financial and operational data from 2024.
| Metric | IsoEnergy Ltd. (ISOU) | enCore Energy Corp. (EU) |
|---|---|---|
| Market Risk | Moderate (Beta 0.955, price range $4.52–$11.5) | Higher (Beta 1.438, price range $1.01–$4.18) |
| Debt level | Low (Debt/Equity 0.1, Debt to Assets 9%) | Very Low (Debt/Equity 0.07, Debt to Assets 5.2%) |
| Regulatory Risk | Moderate (Canadian uranium sector, stable but subject to mining regulations) | Moderate to high (U.S. uranium projects, sensitive to regulatory shifts and environmental permits) |
| Operational Risk | Low (small team of 18 employees, focused projects in Athabasca Basin) | Moderate (multiple project sites across several states, operational complexity) |
| Environmental Risk | Moderate (uranium exploration impacts, Canadian environmental standards) | Moderate to High (multiple sites in sensitive U.S. regions with stricter environmental scrutiny) |
| Geopolitical Risk | Low (Canada is politically stable with supportive mining policies) | Moderate (U.S. uranium industry influenced by national energy policies and international trade tensions) |
Synthesis: enCore Energy faces higher market volatility and geopolitical risk due to its U.S. operations and higher beta, coupled with financial distress signals (Altman Z-Score in distress zone). IsoEnergy shows a safer financial profile with low debt and a strong Altman Z-Score but carries moderate regulatory and environmental risks typical of uranium mining. Investors should weigh operational complexity and regulatory environments carefully, as these are the most impactful risks for both companies.
Which Stock to Choose?
IsoEnergy Ltd. (ISOU) has shown a stagnant income evolution with no revenue growth over the past five years, coupled with mostly unfavorable profitability and financial ratios, yet maintains low debt levels and a slightly unfavorable global financial ratios evaluation. Its MOAT indicates value destruction but with a growing ROIC trend, while its rating is very favorable despite poor profitability scores.
enCore Energy Corp. (EU) exhibits volatile income growth with a strong one-year revenue increase but overall unfavorable profitability and financial ratios, maintaining low debt and a very unfavorable global ratios evaluation. The company is shedding value with a declining ROIC trend, its rating is very favorable, though financial stability scores are weak.
For investors prioritizing financial stability and improving profitability metrics, IsoEnergy’s growing ROIC and slightly more balanced financial ratios might appear more favorable, whereas those focused on recent revenue growth but facing greater value destruction risks may find enCore Energy’s profile more aligned with their risk tolerance.
Disclaimer: Investment carries a risk of loss of initial capital. The past performance is not a reliable indicator of future results. Be sure to understand risks before making an investment decision.
Go Further
I encourage you to read the complete analyses of IsoEnergy Ltd. and enCore Energy Corp. to enhance your investment decisions: