Home > Comparison > Real Estate > IRM vs WY
The strategic rivalry between Iron Mountain Incorporated and Weyerhaeuser Company shapes the Real Estate sector’s specialty REIT landscape. Iron Mountain operates a capital-intensive storage and information management network, while Weyerhaeuser focuses on sustainable timberland ownership and wood product manufacturing. This analysis pits a data-driven infrastructure model against a natural resource asset base, aiming to identify which offers superior risk-adjusted returns for a diversified portfolio.
Table of contents
Companies Overview
Iron Mountain and Weyerhaeuser are pivotal players in the specialty REIT sector, each commanding unique market niches.
Iron Mountain Incorporated: Global Storage and Information Management Leader
Iron Mountain dominates the specialty REIT market with its extensive real estate network of 90M+ square feet across 1,450 facilities in 50 countries. Its core revenue stems from secure records storage, information management, digital transformation, and data services. In 2026, the company focuses strategically on expanding digital and cloud-based solutions to complement its traditional storage assets.
Weyerhaeuser Company: Timberland Giant and Wood Products Manufacturer
Weyerhaeuser stands as one of the largest private owners of timberlands in North America, managing 11M acres sustainably. Its revenue engine combines timberland management with large-scale wood product manufacturing. The firm’s 2026 strategic emphasis centers on sustainable forestry practices and scaling wood product output to meet rising demand for eco-friendly building materials.
Strategic Collision: Similarities & Divergences
Both firms operate as specialty REITs but pursue contrasting business models: Iron Mountain thrives on a digital and physical asset hybrid, while Weyerhaeuser leverages natural resource stewardship. They compete indirectly through capital allocation in real estate and sustainability-focused investments. Their distinct market positions create divergent risk-return profiles—Iron Mountain emphasizes data security growth, Weyerhaeuser bets on sustainable commodity cycles.
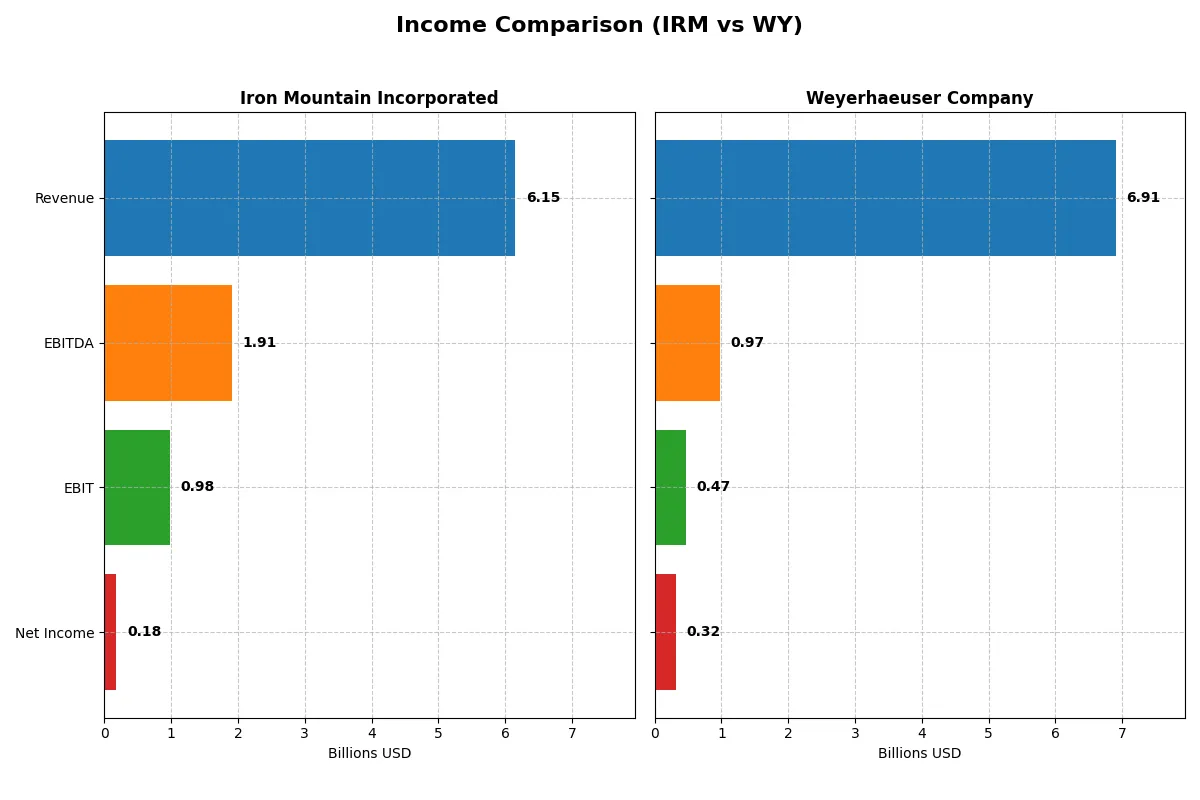
Income Statement Comparison
This data dissects the core profitability and scalability of both corporate engines to reveal who dominates the bottom line:
| Metric | Iron Mountain (IRM) | Weyerhaeuser (WY) |
|---|---|---|
| Revenue | 6.15B | 7.12B |
| Cost of Revenue | 2.70B | 5.81B |
| Operating Expenses | 2.44B | 628M |
| Gross Profit | 3.45B | 1.31B |
| EBITDA | 1.91B | 1.20B |
| EBIT | 981M | 696M |
| Interest Expense | 736M | 269M |
| Net Income | 180M | 396M |
| EPS | 0.61 | 0.54 |
| Fiscal Year | 2024 | 2024 |
Income Statement Analysis: The Bottom-Line Duel
This income statement comparison reveals the true efficiency and profitability strength of Iron Mountain and Weyerhaeuser’s business models.
Iron Mountain Incorporated Analysis
Iron Mountain shows steady revenue growth, rising from 4.1B in 2020 to 6.1B in 2024. Despite this, net income declined sharply over the period, falling to 180M in 2024 from 557M in 2022, signaling margin pressure. The gross margin remains healthy at 56.15%, but net margin contracts to just 2.93%. Operating efficiency improved with EBIT growth of 18.8% in 2024, yet interest expenses weigh heavily, nearly 12% of revenue.
Weyerhaeuser Company Analysis
Weyerhaeuser’s revenue decreased by 32% over five years, sliding to 6.9B in 2025 from 10.2B in 2021. Net income dropped even more dramatically, down 88% to 324M in 2025. Margins are tight, with gross margin at 14.84% and EBIT margin at 6.73%, reflecting cost challenges. The latest year shows declining profitability and a 3% revenue drop, marking weakening momentum and eroding operational leverage.
Margin Strength vs. Revenue Decline
Iron Mountain maintains superior margin control despite net income pressure, driven by solid gross margins and operating leverage. Weyerhaeuser, while larger in revenue scale initially, suffers from steep top-line and bottom-line declines with weak margins. Iron Mountain’s profile favors investors seeking margin resilience; Weyerhaeuser’s shrinking earnings and margins present higher risk with less operational efficiency.
Financial Ratios Comparison
These vital ratios act as a diagnostic tool to expose the underlying fiscal health, valuation premiums, and capital efficiency of the companies compared below:
| Ratios | Iron Mountain (IRM) | Weyerhaeuser (WY) |
|---|---|---|
| ROE | -35.8% | 3.4% |
| ROIC | 4.6% | 2.9% |
| P/E | 171.2 | 52.9 |
| P/B | -61.3 | 1.82 |
| Current Ratio | 0.55 | 1.29 |
| Quick Ratio | 0.55 | 1.29 |
| D/E (Debt-to-Equity) | -32.5 | 0.59 |
| Debt-to-Assets | 87.5% | 33.5% |
| Interest Coverage | 1.37 | 0.00* |
| Asset Turnover | 0.33 | 0.42 |
| Fixed Asset Turnover | 0.61 | 2.50 |
| Payout ratio | 438% | 187% |
| Dividend yield | 2.56% | 3.54% |
| Fiscal Year | 2024 | 2025 |
*Weyerhaeuser’s interest coverage ratio reported as zero for 2025, which is unusual and signals potential reporting or operational issues.
Efficiency & Valuation Duel: The Vital Signs
Financial ratios serve as a company’s DNA, uncovering hidden risks and operational strengths that raw numbers alone cannot reveal.
Iron Mountain Incorporated
Iron Mountain shows weak profitability with a negative ROE at -35.81% and slim margins around 2.93%. Its P/E ratio of 171.16 signals an expensive valuation, far stretched beyond sector norms. Despite financial stress, the company returns value through a 2.56% dividend yield, reflecting a preference for shareholder payouts over reinvestment.
Weyerhaeuser Company
Weyerhaeuser posts modest profitability with an ROE of 3.44% and a net margin of 4.69%, both below industry averages. Its P/E of 52.88 indicates a high but less extreme valuation than Iron Mountain. The firm supports shareholders with a 3.54% dividend yield and maintains a healthier liquidity profile, signaling cautious capital management.
Premium Valuation vs. Operational Safety
Iron Mountain’s valuation appears highly stretched and profitability weak, increasing its risk profile despite dividend payouts. Weyerhaeuser offers a more balanced risk-reward with moderate profitability and better liquidity. Investors seeking stability may lean toward Weyerhaeuser, while those tolerating risk might consider Iron Mountain’s premium valuation.
Which one offers the Superior Shareholder Reward?
Iron Mountain (IRM) pays a 2.56% dividend yield with a very high payout ratio near 438%, signaling strained dividend sustainability. Its free cash flow is negative, raising red flags. IRM’s buyback activity appears limited. Conversely, Weyerhaeuser (WY) yields 3.54% with a more moderate payout ratio around 187%, backed by positive free cash flow and consistent buybacks. WY’s capital allocation balances dividends and buybacks sustainably. I conclude Weyerhaeuser offers a superior total shareholder return profile in 2026, blending yield with prudent cash flow management and buybacks.
Comparative Score Analysis: The Strategic Profile
The radar chart reveals the fundamental DNA and trade-offs of Iron Mountain and Weyerhaeuser, showcasing their distinct financial strengths and weaknesses side by side:
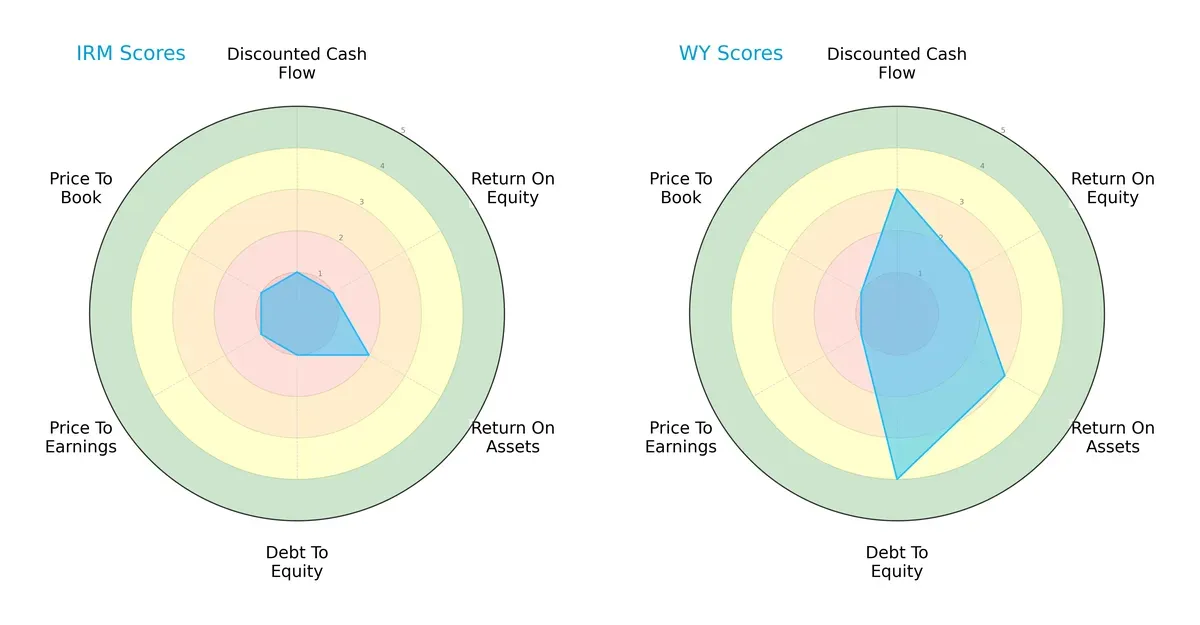
Weyerhaeuser outperforms Iron Mountain in discounted cash flow (3 vs. 1), ROE (2 vs. 1), ROA (3 vs. 2), and debt-to-equity (4 vs. 1), reflecting a more balanced and financially stable profile. Iron Mountain’s scores cluster at the low end, relying heavily on its moderate asset efficiency but struggling with leverage and valuation metrics. Weyerhaeuser’s superior capital allocation and risk management position it as the more resilient choice.
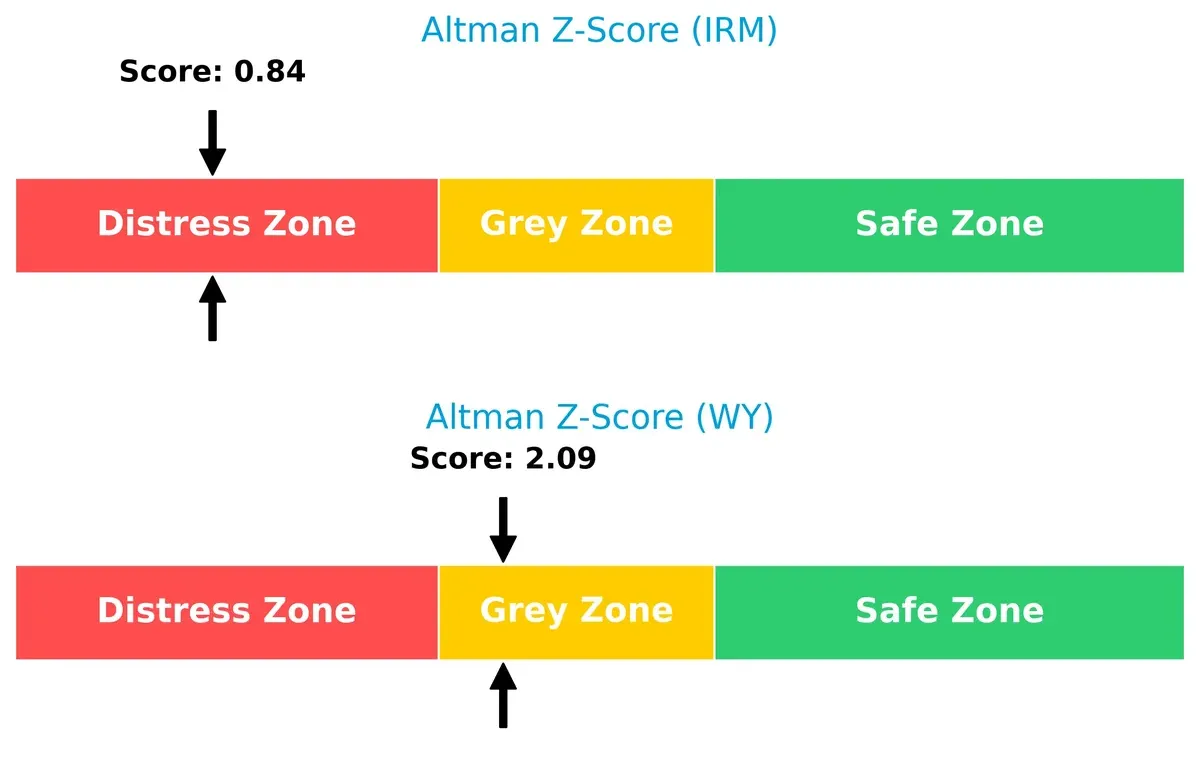
Bankruptcy Risk: Solvency Showdown
Iron Mountain’s Altman Z-Score of 0.84 places it firmly in the distress zone, signaling a high bankruptcy risk. Weyerhaeuser’s 2.09 score lands in the grey zone, indicating moderate default risk but better survival prospects in this economic cycle:
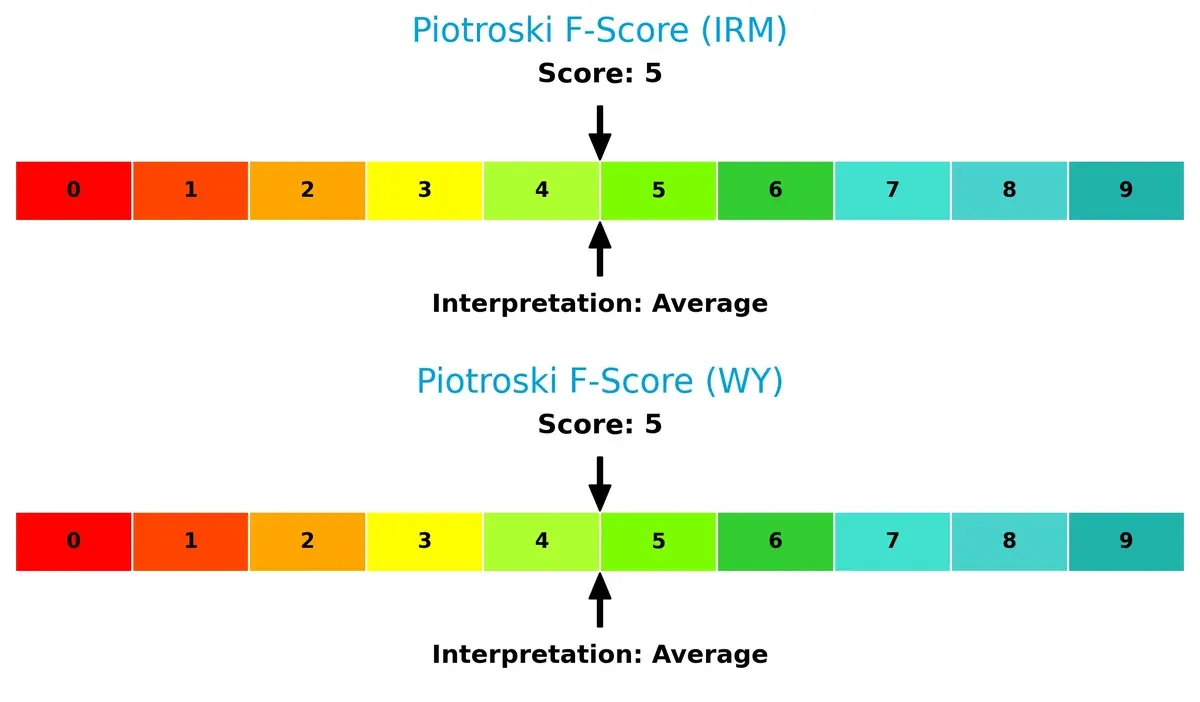
Financial Health: Quality of Operations
Both firms hold an average Piotroski F-Score of 5, signaling moderate financial health. Neither company shows alarming internal red flags, but neither stands out as a model of operational strength:
How are the two companies positioned?
This section dissects the operational DNA of Iron Mountain and Weyerhaeuser by comparing their revenue distribution and internal strengths and weaknesses. The goal is to confront their economic moats and identify which business model offers the most resilient, sustainable advantage today.
Revenue Segmentation: The Strategic Mix
This visual comparison dissects how Iron Mountain Incorporated and Weyerhaeuser Company diversify their income streams and where their primary sector bets lie:
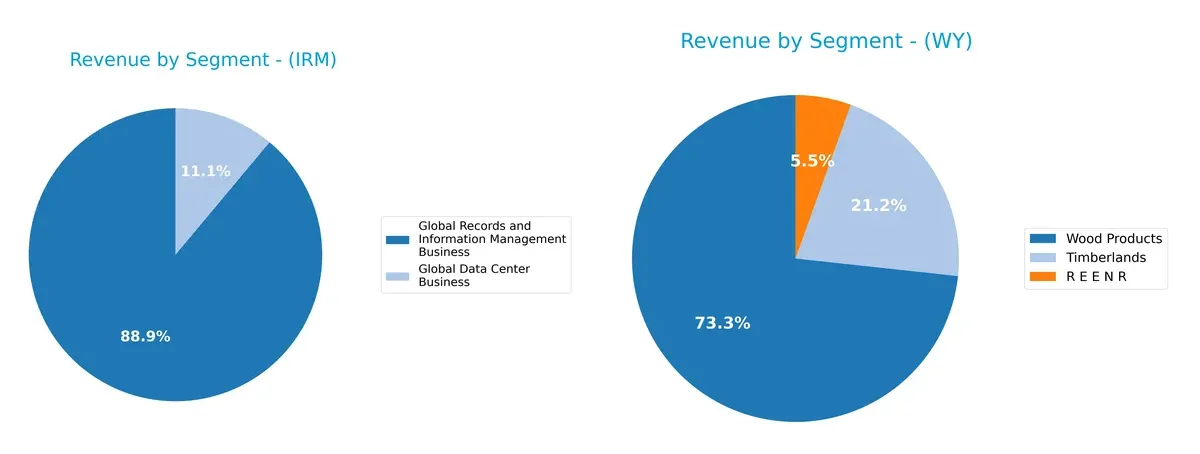
Iron Mountain anchors revenue in its Global Records and Information Management business with $4.98B in 2024, dwarfs its $620M data center segment, showing concentration risk but strong ecosystem lock-in. Weyerhaeuser pivots around Wood Products at $5.22B, supplemented by Timberlands at $1.51B and a smaller R E E N R segment at $391M, revealing a more diversified and balanced portfolio with infrastructure dominance in forestry.
Strengths and Weaknesses Comparison
This table compares the Strengths and Weaknesses of Iron Mountain (IRM) and Weyerhaeuser (WY):
IRM Strengths
- Diversified revenue streams with strong Records and Information Management and growing Data Center business
- Global presence spanning United States, United Kingdom, Canada, and Australia
- Favorable WACC below ROIC benchmark
- Positive dividend yield at 2.56%
WY Strengths
- Broad product portfolio including Timberlands, Wood Products, and REENR segments
- Strong global footprint with significant US and Canadian sales plus Asia exposure
- Favorable interest coverage with infinite ratio
- Dividend yield at 3.54% slightly above IRM
IRM Weaknesses
- Low profitability metrics with negative ROE and low net margin
- High debt-to-assets ratio at 87.46% posing financial risk
- Weak liquidity with current and quick ratios at 0.55
- Asset turnover and fixed asset turnover ratios are unfavorable
- Elevated P/E ratio indicating potentially stretched valuation
WY Weaknesses
- Profitability is low with slightly positive but still unfavorable ROE and net margin
- ROIC below WACC indicating weak capital efficiency
- Neutral to unfavorable liquidity metrics, current ratio 1.29 and debt to assets 33.54%
- Moderate asset turnover and mixed valuation ratios with P/E of 52.88
Both companies show strengths in dividend yield and global diversification. IRM faces greater financial leverage and profitability challenges, while WY maintains better liquidity but also struggles with capital efficiency. These factors shape their strategic priorities around cost control, capital allocation, and market expansion.
The Moat Duel: Analyzing Competitive Defensibility
A structural moat shields long-term profits from competition’s relentless erosion. Let’s examine how Iron Mountain and Weyerhaeuser defend their turf:
Iron Mountain Incorporated: Intangible Assets Powering Information Security
Iron Mountain’s competitive edge stems from its vast, trusted information storage network and regulatory compliance expertise. This drives stable margins despite intense cost pressures. In 2026, digital transformation services could deepen its moat or face disruption from cloud innovators.
Weyerhaeuser Company: Natural Resource Scale and Sustainable Timber Management
Weyerhaeuser’s moat relies on massive timberland ownership and sustainable forestry certification, creating high barriers to entry. Unlike Iron Mountain’s asset-light model, it leverages physical assets but faces margin pressure. Expansion into wood product innovation may offer growth amid declining ROIC trends.
Asset Intangibility vs. Physical Scale: Who Holds the Stronger Moat?
Both firms suffer declining ROIC below WACC, signaling value destruction. Yet Iron Mountain’s intangible asset moat supports higher margin stability and growth potential. I judge Iron Mountain better positioned to protect market share in a competitive, evolving landscape.
Which stock offers better returns?
Over the past year, Iron Mountain’s shares gained steadily, while Weyerhaeuser’s stock faced significant declines before showing recent recovery signs.
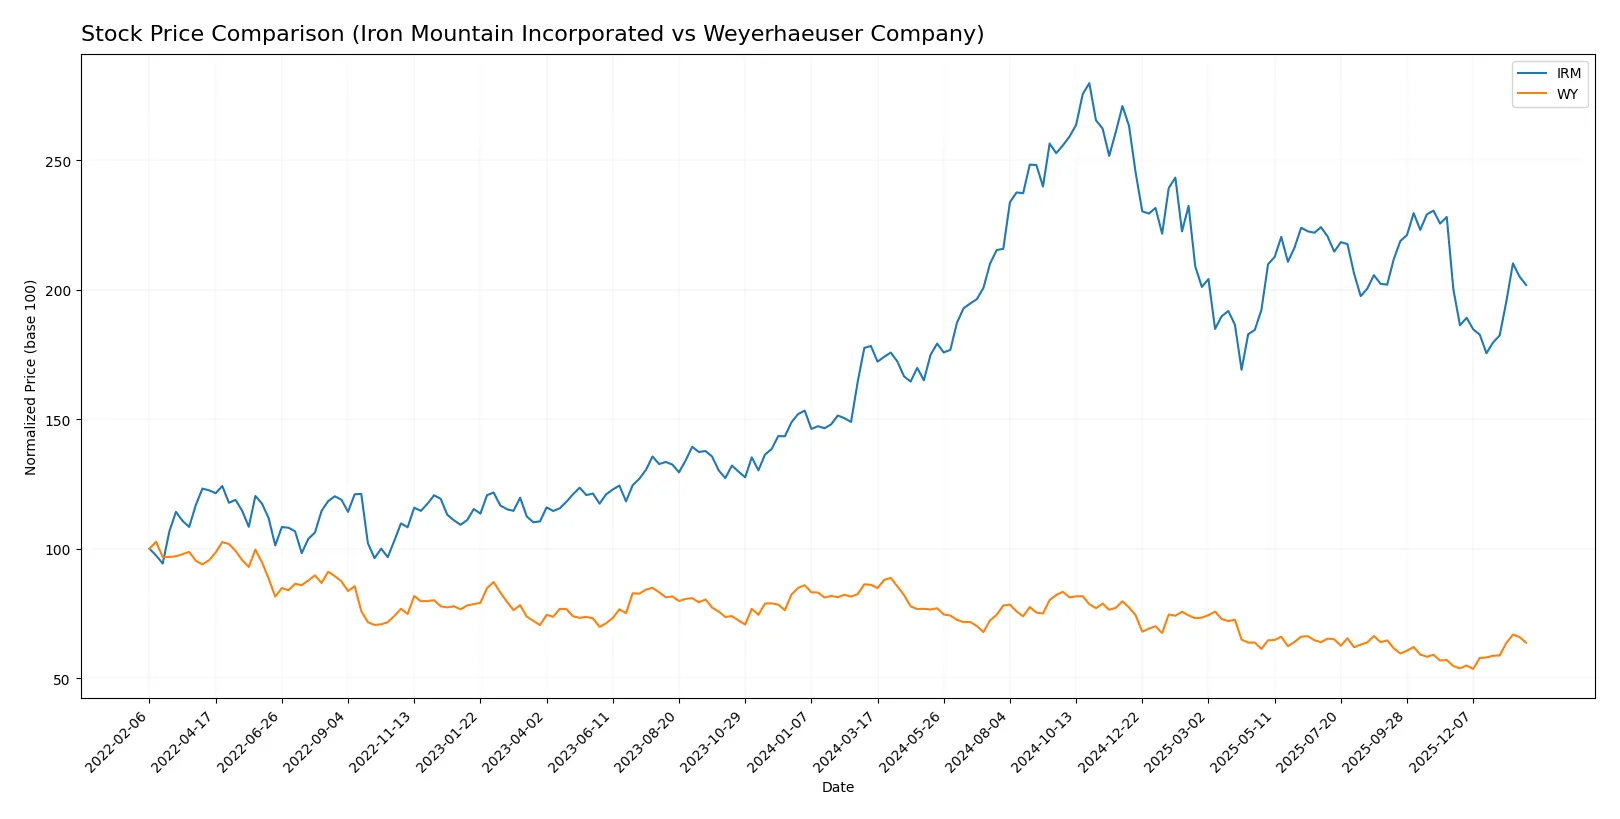
Trend Comparison
Iron Mountain’s stock rose 13.22% over the past 12 months, showing a bullish trend with accelerating momentum and a high volatility of 13.08%. The price ranged between 75.1 and 127.7.
Weyerhaeuser’s stock declined 26.0% over the same period, marking a bearish trend with accelerating downward pressure and lower volatility at 3.42%. Prices fluctuated from 21.69 to 35.91.
Iron Mountain outperformed Weyerhaeuser in total market returns, maintaining a positive trend while Weyerhaeuser underperformed despite recent short-term gains.
Target Prices
Analyst consensus points to moderate upside potential for both Iron Mountain Incorporated and Weyerhaeuser Company.
| Company | Target Low | Target High | Consensus |
|---|---|---|---|
| Iron Mountain Incorporated | 120 | 126 | 123 |
| Weyerhaeuser Company | 28 | 33 | 30 |
The target consensus for Iron Mountain at $123 suggests a 33% premium over the current $92 stock price. Weyerhaeuser’s $30 consensus implies a 16% upside from its $25.78 level. Both indicate analyst confidence above market pricing.

Don’t Let Luck Decide Your Entry Point
Optimize your entry points with our advanced ProRealTime indicators. You’ll get efficient buy signals with precise price targets for maximum performance. Start outperforming now!
How do institutions grade them?
Iron Mountain Incorporated Grades
The following table shows recent grades by reputable financial institutions for Iron Mountain Incorporated:
| Grading Company | Action | New Grade | Date |
|---|---|---|---|
| Barclays | Maintain | Overweight | 2025-11-12 |
| JP Morgan | Maintain | Overweight | 2025-11-06 |
| Barclays | Maintain | Overweight | 2025-08-20 |
| JP Morgan | Maintain | Overweight | 2025-08-07 |
| Barclays | Maintain | Overweight | 2025-05-27 |
| Barclays | Maintain | Overweight | 2025-03-20 |
| JP Morgan | Maintain | Overweight | 2025-02-18 |
| Wells Fargo | Maintain | Overweight | 2025-02-04 |
| Barclays | Maintain | Overweight | 2025-01-28 |
| RBC Capital | Maintain | Outperform | 2024-11-27 |
Weyerhaeuser Company Grades
Below is a summary of recent grades assigned by verified institutions for Weyerhaeuser Company:
| Grading Company | Action | New Grade | Date |
|---|---|---|---|
| Citigroup | Maintain | Buy | 2026-01-14 |
| Truist Securities | Maintain | Hold | 2026-01-06 |
| CIBC | Maintain | Outperform | 2025-12-12 |
| B of A Securities | Downgrade | Neutral | 2025-11-17 |
| JP Morgan | Maintain | Overweight | 2025-11-14 |
| Citigroup | Maintain | Buy | 2025-11-12 |
| RBC Capital | Maintain | Outperform | 2025-11-03 |
| DA Davidson | Maintain | Buy | 2025-11-03 |
| Citigroup | Maintain | Buy | 2025-10-27 |
| Truist Securities | Maintain | Hold | 2025-10-13 |
Which company has the best grades?
Weyerhaeuser Company has a broader range of grades, including multiple Buy and Outperform ratings. Iron Mountain’s grades consistently show Overweight and Outperform. Weyerhaeuser’s more bullish ratings could attract investors seeking growth, while Iron Mountain offers stable, consensus overweight support.
Risks specific to each company
The following categories identify critical pressure points and systemic threats facing Iron Mountain Incorporated and Weyerhaeuser Company in the 2026 market environment:
1. Market & Competition
Iron Mountain Incorporated
- Faces intense competition in digital transformation and data management services.
Weyerhaeuser Company
- Competes in cyclical timber and wood products markets with commodity price sensitivity.
2. Capital Structure & Debt
Iron Mountain Incorporated
- High debt-to-assets ratio at 87.5% poses financial risk; interest coverage barely above 1.3x.
Weyerhaeuser Company
- Moderate leverage with 33.5% debt-to-assets and strong infinite interest coverage.
3. Stock Volatility
Iron Mountain Incorporated
- Beta of 1.15 indicates above-market volatility and sensitivity to economic cycles.
Weyerhaeuser Company
- Beta of 1.05 implies near-market volatility, slightly less sensitive to swings.
4. Regulatory & Legal
Iron Mountain Incorporated
- Subject to strict data privacy, storage regulations worldwide; compliance costs rising.
Weyerhaeuser Company
- Faces environmental regulations and sustainable forestry mandates impacting operations.
5. Supply Chain & Operations
Iron Mountain Incorporated
- Relies on secure, global real estate network; operational disruptions could be costly.
Weyerhaeuser Company
- Timber supply depends on natural resource management and weather conditions.
6. ESG & Climate Transition
Iron Mountain Incorporated
- Faces pressure to reduce carbon footprint in data centers and facilities.
Weyerhaeuser Company
- Listed on Dow Jones Sustainability Index; strong focus on sustainable forestry.
7. Geopolitical Exposure
Iron Mountain Incorporated
- Operates in ~50 countries, exposing it to diverse geopolitical risks.
Weyerhaeuser Company
- Mainly US and Canada timberlands, less global geopolitical risk exposure.
Which company shows a better risk-adjusted profile?
Iron Mountain’s greatest risk lies in its stretched capital structure and weak interest coverage, raising default concerns in rising rate environments. Weyerhaeuser’s main risk is commodity price volatility inherent to timber markets. Weyerhaeuser’s moderate leverage and stronger financial stability give it a better risk-adjusted profile. Its Altman Z-score in the grey zone contrasts starkly with Iron Mountain’s distress zone, reflecting Iron Mountain’s heightened bankruptcy risk. This divergence underscores Weyerhaeuser’s superior balance sheet resilience in 2026.
Final Verdict: Which stock to choose?
Iron Mountain’s superpower lies in its robust operational cash flow and a niche market position as a trusted data storage and information management provider. However, its heavy debt load and weakening profitability serve as a point of vigilance. It suits investors with a high tolerance for risk seeking aggressive growth opportunities.
Weyerhaeuser’s strategic moat is its vast timberland assets and recurring income from sustainable forestry operations. It offers better liquidity and financial stability compared to Iron Mountain, appealing to investors who prioritize steadiness. This stock fits well within a GARP (Growth at a Reasonable Price) portfolio.
If you prioritize aggressive growth and can weather financial volatility, Iron Mountain presents a compelling case with its niche dominance and cash-generation potential. However, if you seek a more stable investment with a tangible asset base and predictable income, Weyerhaeuser offers better stability despite its slower growth trajectory. Both face challenges in value creation, demanding careful risk management.
Disclaimer: Investment carries a risk of loss of initial capital. The past performance is not a reliable indicator of future results. Be sure to understand risks before making an investment decision.
Go Further
I encourage you to read the complete analyses of Iron Mountain Incorporated and Weyerhaeuser Company to enhance your investment decisions: