In the fast-evolving healthcare sector, IQVIA Holdings Inc. and Waters Corporation stand out as leaders in medical diagnostics and research. IQVIA excels in data analytics and clinical research services, while Waters focuses on advanced analytical instruments like chromatography and mass spectrometry. Their shared commitment to innovation and market presence makes this comparison essential. Join me as we explore which company presents the most compelling investment opportunity in 2026.
Table of contents
Companies Overview
I will begin the comparison between IQVIA Holdings Inc. and Waters Corporation by providing an overview of these two companies and their main differences.
IQV Overview
IQVIA Holdings Inc. operates in the healthcare sector, providing advanced analytics, technology solutions, and clinical research services worldwide. Its business spans three segments: Technology & Analytics Solutions, Research & Development Solutions, and Contract Sales & Medical Solutions. IQVIA focuses on enabling life sciences and healthcare customers to improve patient outcomes through data-driven insights and clinical trial support. It is headquartered in Durham, North Carolina, and employs about 89,000 people.
Waters Overview
Waters Corporation is a specialty measurement company in the healthcare sector, offering analytical workflow solutions primarily through its Waters and TA segments. It designs and manufactures high-performance liquid chromatography, mass spectrometry instruments, and related software for drug discovery, clinical trials, and quality assurance. Waters serves life sciences, pharmaceutical, environmental, and industrial sectors. The company is based in Milford, Massachusetts, with approximately 7,600 employees.
Key similarities and differences
Both companies operate in the healthcare diagnostics and research industry and are listed on the NYSE. IQVIA focuses broadly on analytics, clinical research, and commercial services, leveraging cloud technology and data insights. Waters specializes in manufacturing analytical instruments and software for laboratory applications. IQVIA’s workforce is significantly larger, reflecting its diverse service offerings, whereas Waters concentrates on precision instrumentation and measurement technologies.
Income Statement Comparison
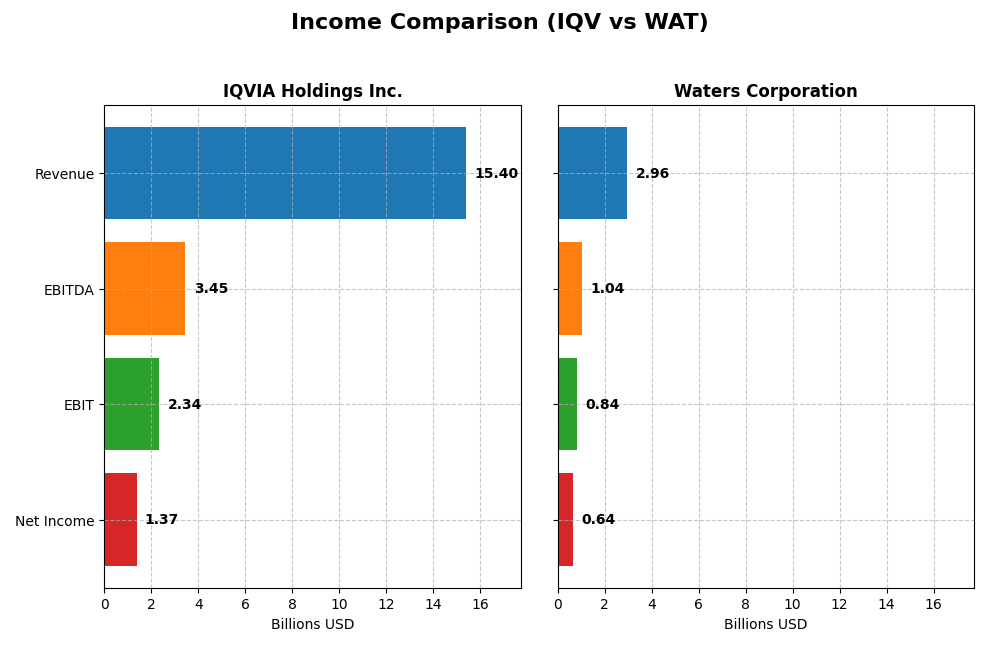
The table below presents a side-by-side comparison of key income statement metrics for IQVIA Holdings Inc. and Waters Corporation for the fiscal year 2024.
| Metric | IQVIA Holdings Inc. | Waters Corporation |
|---|---|---|
| Market Cap | 41.3B | 23.6B |
| Revenue | 15.4B | 2.96B |
| EBITDA | 3.45B | 1.04B |
| EBIT | 2.34B | 845M |
| Net Income | 1.37B | 638M |
| EPS | 7.57 | 10.75 |
| Fiscal Year | 2024 | 2024 |
Income Statement Interpretations
IQVIA Holdings Inc.
IQVIA’s revenue steadily increased from $11.4B in 2020 to $15.4B in 2024, with net income rising sharply from $279M to $1.37B over the same period. Margins improved notably, with a gross margin of 34.9% and an EBIT margin of 15.2% in 2024. Despite a modest revenue growth slowdown of 2.8% in the latest year, operating efficiency gains supported a 9.8% EBIT increase.
Waters Corporation
Waters Corporation’s revenue grew moderately from $2.37B in 2020 to nearly $2.96B in 2024, while net income increased from $522M to $638M. The company maintained strong margins, boasting a gross margin of 59.4% and an EBIT margin of 28.6% in 2024. However, growth has largely plateaued recently, with a near-flat 0.07% revenue increase and slight declines in net margin and EPS.
Which one has the stronger fundamentals?
IQVIA demonstrates stronger fundamentals with more robust revenue and net income growth over five years, alongside expanding margins and favorable operational leverage. Waters maintains superior margin levels but faces stagnation in top-line growth and declining net margin trends, reflecting less momentum in profitability expansion compared to IQVIA’s favorable margin and income growth trajectory.
Financial Ratios Comparison
The table below presents a side-by-side comparison of key financial ratios for IQVIA Holdings Inc. (IQV) and Waters Corporation (WAT) based on their most recent fiscal year data (2024).
| Ratios | IQVIA Holdings Inc. (IQV) | Waters Corporation (WAT) |
|---|---|---|
| ROE | 22.6% | 34.9% |
| ROIC | 8.6% | 18.4% |
| P/E | 25.9 | 34.5 |
| P/B | 5.87 | 12.04 |
| Current Ratio | 0.84 | 2.11 |
| Quick Ratio | 0.84 | 1.51 |
| D/E (Debt-to-Equity) | 2.33 | 0.93 |
| Debt-to-Assets | 52.6% | 37.4% |
| Interest Coverage | 3.29 | 9.21 |
| Asset Turnover | 0.57 | 0.65 |
| Fixed Asset Turnover | 19.93 | 4.08 |
| Payout Ratio | 0% | 0% |
| Dividend Yield | 0% | 0% |
Interpretation of the Ratios
IQVIA Holdings Inc.
IQVIA’s ratios present a mixed picture with a favorable return on equity at 22.63% but several unfavorable indicators including a low current ratio (0.84) and high debt-to-equity ratio (2.33). Price multiples such as PE (25.95) and PB (5.87) are also unfavorable. The company does not pay dividends, likely prioritizing reinvestment or managing debt, as reflected by a zero dividend yield and negative free cash flow to equity.
Waters Corporation
Waters Corporation shows stronger ratios overall, including a favorable net margin of 21.56% and return on equity at 34.88%. Its liquidity ratios are solid with a current ratio of 2.11 and quick ratio of 1.51, while debt levels are moderate. Despite a zero dividend yield, the company’s financial health supports a reinvestment strategy or growth focus rather than shareholder payouts at this time.
Which one has the best ratios?
Waters Corporation holds the advantage in ratio strength with more favorable metrics, especially in profitability, liquidity, and interest coverage. IQVIA’s higher leverage and weaker liquidity ratios weigh against it, despite a decent return on equity. Overall, Waters’ financial ratios appear more balanced and robust as of 2024 fiscal year data.
Strategic Positioning
This section compares the strategic positioning of IQVIA Holdings Inc. and Waters Corporation regarding market position, key segments, and exposure to technological disruption:
IQVIA Holdings Inc.
- Leading global player in life sciences with high market cap and competitive pressure from healthcare analytics and research sectors.
- Diversified revenue from Technology & Analytics, Research & Development, and Contract Sales & Medical Solutions segments driving growth.
- Moderate exposure through cloud-based applications and advanced analytics in life sciences; innovation focused on virtual trials and strategic consulting.
Waters Corporation
- Specialty measurement company with strong presence in chromatography and mass spectrometry, facing competitive pressure in analytical instruments.
- Concentrated in analytical workflow solutions including instruments, consumables, and services supporting drug discovery and quality assurance.
- Exposure through development of advanced chromatography and mass spectrometry technology systems and related software products.
IQVIA Holdings Inc. vs Waters Corporation Positioning
IQVIA exhibits a diversified approach with multiple business segments across technology, research, and sales services, supporting broad life sciences needs. Waters focuses on specialized analytical instruments and consumables, concentrating on precise measurement solutions, which may limit diversification but strengthen niche expertise.
Which has the best competitive advantage?
Waters Corporation shows a slightly favorable moat by creating value with ROIC above WACC despite a declining trend, whereas IQVIA has a slightly unfavorable moat, destroying value but improving profitability through growing ROIC. Waters currently holds a stronger competitive advantage.
Stock Comparison
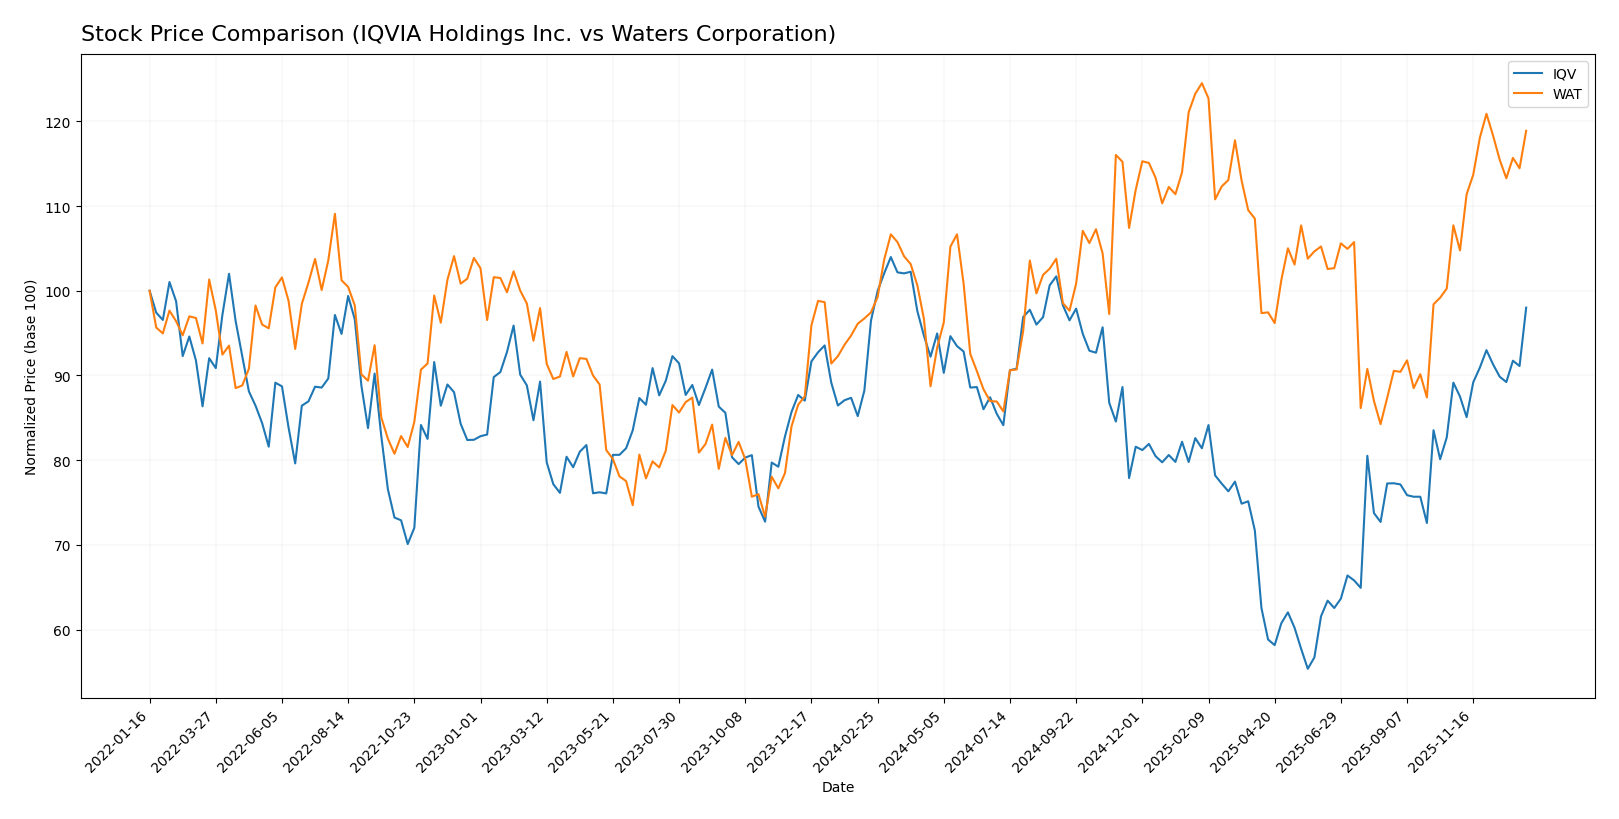
The stock price chart highlights significant bullish trends for both IQVIA Holdings Inc. and Waters Corporation over the past year, with notable gains and increasing trading volumes reflecting active market dynamics.
Trend Analysis
IQVIA Holdings Inc. recorded a 1.6% price increase over the past year, indicating a neutral trend with acceleration. It experienced a high of 257.18 and a low of 137.0, with moderate volatility (std deviation 30.97).
Waters Corporation showed a 22.0% price rise over the same period, confirming a strong bullish trend with acceleration. Price ranged from 281.2 to 415.48, and volatility was slightly higher (std deviation 33.33).
Comparing both, Waters Corporation delivered the highest market performance with a 22.0% increase, outperforming IQVIA’s more modest 1.6% gain over the past year.
Target Prices
The consensus target prices from recognized analysts indicate positive upside potential for both IQVIA Holdings Inc. and Waters Corporation.
| Company | Target High | Target Low | Consensus |
|---|---|---|---|
| IQVIA Holdings Inc. | 290 | 214 | 253.2 |
| Waters Corporation | 480 | 315 | 406.86 |
Analysts expect IQVIA’s stock to rise moderately above its current price of 242.41 USD, while Waters Corporation shows a stronger upside potential compared to its current 396.75 USD price.
Analyst Opinions Comparison
This section compares analysts’ ratings and grades for IQVIA Holdings Inc. and Waters Corporation:
Rating Comparison
IQV Rating
- Rating: B+ with a very favorable overall rating status.
- Discounted Cash Flow Score: 4, indicating favorable valuation based on cash flow.
- ROE Score: 5, very favorable efficiency in generating profit from equity.
- ROA Score: 4, favorable use of assets to generate earnings.
- Debt To Equity Score: 1, very unfavorable financial risk due to high debt.
- Overall Score: 3, moderate summary assessment of financial standing.
WAT Rating
- Rating: B+ with a very favorable overall rating status.
- Discounted Cash Flow Score: 4, also favorable for valuation based on cash flow.
- ROE Score: 5, very favorable in profit generation from shareholders’ equity.
- ROA Score: 5, very favorable asset utilization for earnings.
- Debt To Equity Score: 1, very unfavorable financial risk from debt level.
- Overall Score: 3, moderate overall financial assessment.
Which one is the best rated?
Both IQV and WAT share the same overall rating of B+ and identical scores for discounted cash flow, ROE, debt-to-equity, and overall score. WAT slightly outperforms IQV on return on assets, suggesting marginally better asset efficiency.
Scores Comparison
The following table presents a comparison of the Altman Z-Score and Piotroski Score for IQVIA Holdings Inc. and Waters Corporation:
IQV Scores
- Altman Z-Score: 2.15, in the grey zone, indicating moderate bankruptcy risk.
- Piotroski Score: 5, classified as average financial strength.
WAT Scores
- Altman Z-Score: 9.73, in the safe zone, indicating low bankruptcy risk.
- Piotroski Score: 6, classified as average financial strength.
Which company has the best scores?
Based on the provided data, Waters Corporation has a clearly stronger Altman Z-Score, indicating lower bankruptcy risk. Both companies have average Piotroski Scores, with Waters slightly ahead. Waters shows overall better financial stability in these scores.
Grades Comparison
Here is the comparison of recent grades and rating trends for IQVIA Holdings Inc. and Waters Corporation:
IQVIA Holdings Inc. Grades
The table below summarizes recent grades from reputable grading companies for IQVIA Holdings Inc.:
| Grading Company | Action | New Grade | Date |
|---|---|---|---|
| Truist Securities | Maintain | Buy | 2026-01-08 |
| UBS | Maintain | Buy | 2026-01-08 |
| Morgan Stanley | Maintain | Overweight | 2025-12-02 |
| TD Cowen | Downgrade | Hold | 2025-11-03 |
| Baird | Upgrade | Outperform | 2025-10-29 |
| Truist Securities | Maintain | Buy | 2025-10-29 |
| JP Morgan | Maintain | Overweight | 2025-10-29 |
| Stifel | Maintain | Buy | 2025-10-29 |
| Citigroup | Maintain | Neutral | 2025-10-29 |
| UBS | Maintain | Buy | 2025-10-29 |
IQVIA’s grades predominantly indicate a buy or overweight stance with occasional upgrades and a single recent downgrade, showing a generally positive and stable rating environment.
Waters Corporation Grades
The table below summarizes recent grades from reputable grading companies for Waters Corporation:
| Grading Company | Action | New Grade | Date |
|---|---|---|---|
| Wells Fargo | Maintain | Equal Weight | 2025-12-15 |
| Wolfe Research | Upgrade | Outperform | 2025-12-10 |
| Wells Fargo | Maintain | Equal Weight | 2025-11-05 |
| TD Cowen | Maintain | Hold | 2025-11-05 |
| JP Morgan | Maintain | Neutral | 2025-10-09 |
| Wells Fargo | Maintain | Equal Weight | 2025-08-05 |
| Deutsche Bank | Maintain | Hold | 2025-08-05 |
| Jefferies | Maintain | Buy | 2025-08-04 |
| Baird | Maintain | Outperform | 2025-07-16 |
| Wells Fargo | Downgrade | Equal Weight | 2025-07-15 |
Waters Corporation’s grades mostly range from hold to equal weight, with some outperform and buy ratings, but also a recent downgrade, reflecting a more cautious market view.
Which company has the best grades?
IQVIA Holdings Inc. has received consistently stronger grades, mainly buy and overweight ratings, compared to Waters Corporation’s predominantly hold and equal weight grades. This suggests IQVIA is viewed more favorably by analysts, which could influence investor confidence and portfolio positioning.
Strengths and Weaknesses
The table below summarizes key strengths and weaknesses of IQVIA Holdings Inc. (IQV) and Waters Corporation (WAT) based on recent financial and operational data.
| Criterion | IQVIA Holdings Inc. (IQV) | Waters Corporation (WAT) |
|---|---|---|
| Diversification | High diversification across R&D, technology, and contract sales segments with $8.53B in R&D solutions and $6.16B in technology & analytics solutions. | Diversified product portfolio including instrument systems and services, with balanced revenue streams (e.g., $1.03B Waters Instrument Systems, $1.01B Waters Service). |
| Profitability | Neutral net margin (8.91%), ROIC near WACC (8.59% vs 8.69%), indicating slight value destruction but improving trend. | Strong profitability with 21.56% net margin and 18.43% ROIC well above WACC (8.93%), though ROIC trend is declining. |
| Innovation | Robust investment in R&D solutions reflecting strong innovation capacity. | Consistent innovation in analytical instruments and consumables, supporting market leadership. |
| Global presence | Large global footprint supporting diverse healthcare services and technology solutions. | Global operations with significant sales in instrument systems and consumables worldwide. |
| Market Share | Growing presence in clinical research and analytics markets, though faced with competitive pressure. | Strong market share in analytical instruments and consumables, maintaining leadership despite some profitability pressure. |
In summary, IQVIA shows strong diversification and innovation but currently struggles with value creation, though its profitability is improving. Waters Corporation is highly profitable with a solid market presence but faces challenges in sustaining ROIC growth. Investors should weigh IQV’s growth potential against Waters’ current profitability and market strength.
Risk Analysis
Below is a comparison of key risk factors for IQVIA Holdings Inc. (IQV) and Waters Corporation (WAT) based on the latest available data for 2024.
| Metric | IQVIA Holdings Inc. (IQV) | Waters Corporation (WAT) |
|---|---|---|
| Market Risk | Beta 1.37, higher volatility | Beta 1.16, moderate volatility |
| Debt level | High leverage (D/E 2.33), debt-to-assets 52.6% (unfavorable) | Moderate leverage (D/E 0.93), debt-to-assets 37.4% (neutral) |
| Regulatory Risk | Significant due to healthcare industry compliance | Moderate, related to medical device regulations |
| Operational Risk | Large global operations, complexity in clinical trials | Technology and manufacturing risks in analytical instruments |
| Environmental Risk | Moderate, indirect impact through client industries | Moderate, environmental regulations on manufacturing |
| Geopolitical Risk | Exposure in Americas, Europe, Asia-Pacific | Exposure mainly in Americas, Asia, Europe |
IQV’s most impactful risks are its high debt levels and associated financial leverage, increasing vulnerability to interest rate changes and credit conditions. Waters shows better financial stability but faces risks from regulatory changes and manufacturing dependencies. Both companies operate in regulated healthcare sectors, implying ongoing compliance risks.
Which Stock to Choose?
IQVIA Holdings Inc. shows favorable income statement metrics with strong gross and EBIT margins and significant net income growth over five years. However, its financial ratios reveal some concerns including high debt levels and a low current ratio, leading to a slightly unfavorable global ratios opinion. Its economic moat is slightly unfavorable as ROIC remains below WACC despite improving profitability, and the overall rating stands at very favorable with moderate overall scores.
Waters Corporation exhibits higher profitability ratios with a notably strong net margin and return on equity. Its financial ratios are more favorable, featuring lower leverage and robust liquidity, which contribute to a slightly favorable global ratios opinion. The company is creating value with ROIC exceeding WACC, albeit with a declining trend. Its rating is also very favorable, supported by a safe Altman Z-Score and average Piotroski score.
Investors prioritizing stable profitability and liquidity might find Waters Corporation more aligned with their profile, while those focusing on improving profitability trends despite higher leverage could see IQVIA Holdings Inc. as a potential fit. The decision may depend on the investor’s tolerance for debt levels and preference between growth in profitability versus financial stability.
Disclaimer: Investment carries a risk of loss of initial capital. The past performance is not a reliable indicator of future results. Be sure to understand risks before making an investment decision.
Go Further
I encourage you to read the complete analyses of IQVIA Holdings Inc. and Waters Corporation to enhance your investment decisions: