Home > Comparison > Healthcare > TMO vs IQV
The strategic rivalry between Thermo Fisher Scientific Inc. and IQVIA Holdings Inc. shapes the healthcare diagnostics and research landscape. Thermo Fisher operates as a capital-intensive leader in life sciences solutions and biopharma services. In contrast, IQVIA excels as a technology-driven analytics and clinical research provider. This analysis delves into their differing growth models to assess which offers a superior risk-adjusted profile for a diversified portfolio in 2026.

Table of contents
Companies Overview
Thermo Fisher Scientific and IQVIA Holdings lead critical segments within medical diagnostics and research.
Thermo Fisher Scientific Inc.: Global Life Sciences Powerhouse
Thermo Fisher Scientific dominates the life sciences solutions market, generating revenue from reagents, instruments, and biopharma services worldwide. Its core strength lies in providing comprehensive tools for drug discovery, vaccine production, and clinical diagnostics. In 2026, the company emphasizes expanding its specialty diagnostics and biopharma services, reinforcing its integrated product and service ecosystem.
IQVIA Holdings Inc.: Data-Driven Clinical Research Leader
IQVIA Holdings stands out as a leader in advanced analytics and clinical research services, supporting life sciences firms with cloud-based technology and strategic consulting. It earns primarily through technology & analytics, R&D solutions, and contract sales services. The company’s 2026 focus centers on enhancing real-world evidence platforms and virtual trials to optimize healthcare decision-making and patient outcomes.
Strategic Collision: Similarities & Divergences
Both companies operate in healthcare but diverge sharply in approach. Thermo Fisher builds a broad product and service ecosystem, while IQVIA prioritizes data analytics and outsourced clinical research. Their primary battleground is the life sciences sector, with Thermo Fisher targeting laboratory and biopharma tools versus IQVIA’s focus on digital healthcare solutions. This contrast defines their unique investment appeal—one rooted in tangible assets, the other in intellectual capital and innovation.
Income Statement Comparison
The following data dissects the core profitability and scalability of both corporate engines to reveal who dominates the bottom line:
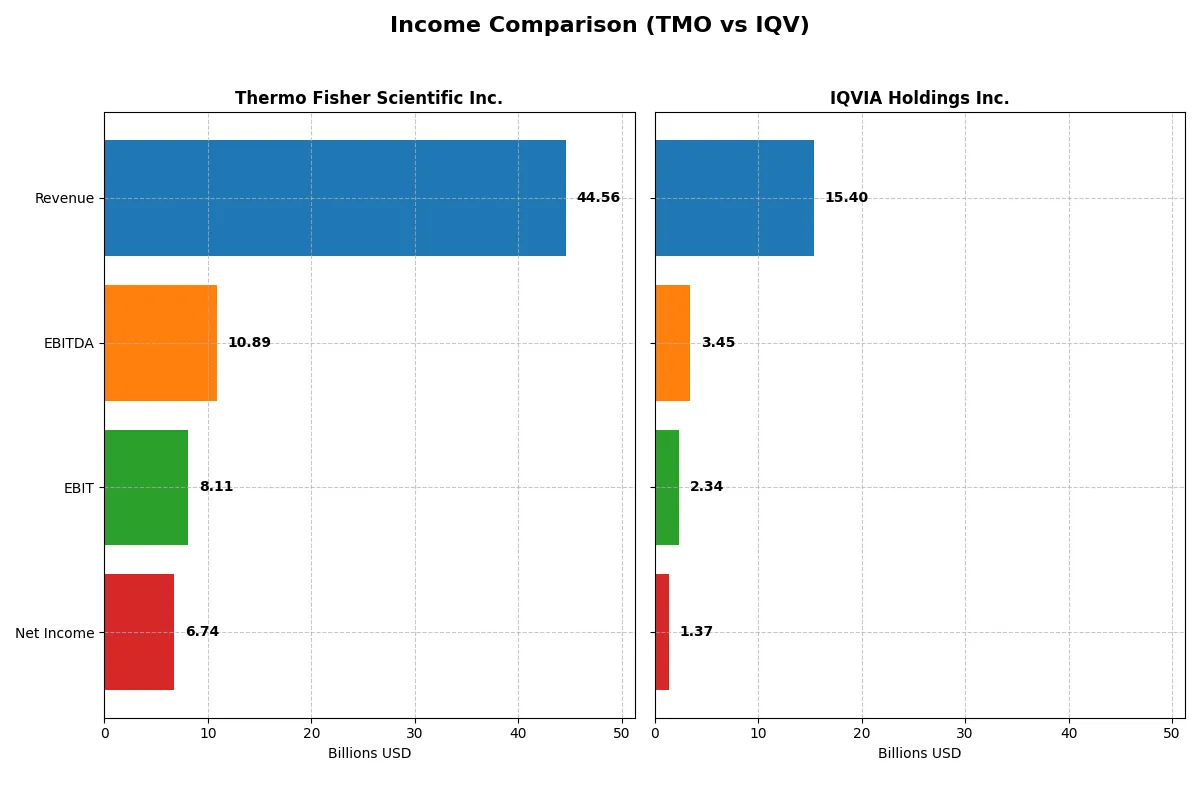
| Metric | Thermo Fisher Scientific Inc. (TMO) | IQVIA Holdings Inc. (IQV) |
|---|---|---|
| Revenue | 44.6B | 15.4B |
| Cost of Revenue | 27.8B | 10.0B |
| Operating Expenses | 8.7B | 3.2B |
| Gross Profit | 16.8B | 5.4B |
| EBITDA | 10.9B | 3.5B |
| EBIT | 8.1B | 2.3B |
| Interest Expense | 1.4B | 670M |
| Net Income | 6.7B | 1.4B |
| EPS | 17.77 | 7.57 |
| Fiscal Year | 2025 | 2024 |
Income Statement Analysis: The Bottom-Line Duel
This income statement comparison exposes the true efficiency and profitability of each company’s financial engine over recent years.
Thermo Fisher Scientific Inc. Analysis
Thermo Fisher’s revenue grows moderately, reaching $44.6B in 2025, while net income declines to $6.7B. Its gross margin contracts from 42.3% in 2022 to 37.7% in 2025, reflecting pressure on cost efficiency. Despite a dip in EBIT and gross profit last year, improved net margin and EPS growth signal solid bottom-line resilience.
IQVIA Holdings Inc. Analysis
IQVIA’s revenue climbs steadily to $15.4B in 2024, with net income surging to $1.37B. Gross margin holds firm near 35%, while EBIT margin rises to 15.2%. The company shows strong multi-year growth in net income and EPS, underpinned by favorable operational leverage despite a slight net margin dip last year.
Margin Strength vs. Growth Momentum
Thermo Fisher leads with superior scale and higher absolute profits but faces margin erosion and flat net income growth. IQVIA delivers robust earnings and margin expansion on smaller revenue, reflecting agile cost control and growth execution. For investors, IQVIA’s dynamic profit momentum contrasts with Thermo Fisher’s scale-driven but margin-challenged profile.
Financial Ratios Comparison
These vital ratios act as a diagnostic tool to expose the underlying fiscal health, valuation premiums, and capital efficiency of these companies:
| Ratios | Thermo Fisher Scientific Inc. (TMO) | IQVIA Holdings Inc. (IQV) |
|---|---|---|
| ROE | 12.6% | 22.6% |
| ROIC | 7.6% | 8.6% |
| P/E | 32.3 | 25.9 |
| P/B | 4.08 | 5.87 |
| Current Ratio | 1.89 | 0.84 |
| Quick Ratio | 1.53 | 0.84 |
| D/E (Debt-to-Equity) | 0.74 | 2.33 |
| Debt-to-Assets | 35.7% | 52.6% |
| Interest Coverage | 5.71 | 3.29 |
| Asset Turnover | 0.40 | 0.57 |
| Fixed Asset Turnover | 4.22 | 19.93 |
| Payout ratio | 9.4% | 0% |
| Dividend yield | 0.29% | 0% |
| Fiscal Year | 2025 | 2024 |
Efficiency & Valuation Duel: The Vital Signs
Ratios act as a company’s DNA, revealing operational strengths and hidden risks that shape investment potential.
Thermo Fisher Scientific Inc.
Thermo Fisher posts a solid 12.6% ROE and a favorable 15.12% net margin, indicating consistent profitability. Its P/E of 32.34 signals an expensive valuation relative to earnings, while a modest 0.29% dividend yield reflects limited shareholder cash returns. The company reinvests heavily in R&D, fueling growth and operational efficiency.
IQVIA Holdings Inc.
IQVIA delivers a strong 22.6% ROE but a lower 8.91% net margin, showing efficient equity use despite thinner profitability. Its P/E ratio of 25.95 is less stretched but still pricey. IQV pays no dividend, signaling a focus on reinvestment and expansion. However, its elevated debt ratios and weak liquidity raise caution flags.
Premium Valuation vs. Operational Safety
Thermo Fisher trades at a higher premium with balanced profitability and favorable liquidity. IQV offers superior ROE but struggles with leverage and current assets. Thermo Fisher suits investors prioritizing stability; IQV fits those willing to accept higher risk for growth potential.
Which one offers the Superior Shareholder Reward?
I find Thermo Fisher Scientific (TMO) offers a superior shareholder reward compared to IQVIA Holdings (IQV). TMO pays a modest but well-covered dividend yielding ~0.29%, with a sustainable payout ratio near 9%. Its strong free cash flow (16.7/share) comfortably funds dividends and capital expenditure, supported by a robust dividend and capex coverage ratio of 3.6x. TMO also executes share buybacks, enhancing total return. In contrast, IQV pays no dividend, instead reinvesting free cash flow (~11.7/share) into growth and acquisitions. IQV’s high debt leverage (debt/equity ~2.3) and weaker cash ratios pose risks. While IQV’s aggressive reinvestment supports growth, TMO’s balanced distribution and buyback strategy offers a more reliable and attractive total return profile for long-term investors in 2026.
Comparative Score Analysis: The Strategic Profile
The radar chart reveals the fundamental DNA and trade-offs of Thermo Fisher Scientific and IQVIA Holdings, highlighting their financial strengths and vulnerabilities:
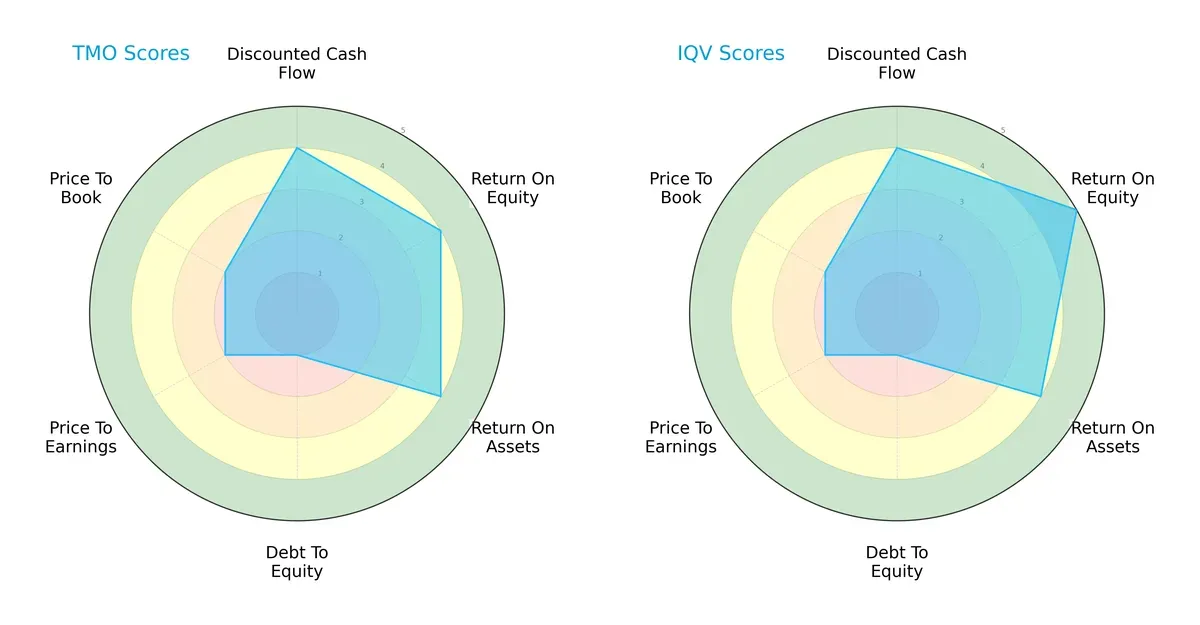
Thermo Fisher and IQVIA both score a solid 4 on discounted cash flow, reflecting favorable valuation. IQVIA leads in return on equity with a 5 versus Thermo Fisher’s 4, signaling superior profit generation from equity. Both post equal return on assets scores of 4, showing efficient asset use. Their debt-to-equity scores are weak at 1, indicating high leverage risk for both. Valuation metrics (P/E and P/B) hold moderate parity at 2. IQVIA’s edge in ROE suggests a more focused profitability advantage, while Thermo Fisher presents a more balanced profile across earnings and asset returns.
Bankruptcy Risk: Solvency Showdown
Thermo Fisher’s Altman Z-Score of 3.09 places it firmly in the safe zone, while IQVIA’s 2.15 situates it in the grey zone, implying a moderate bankruptcy risk:
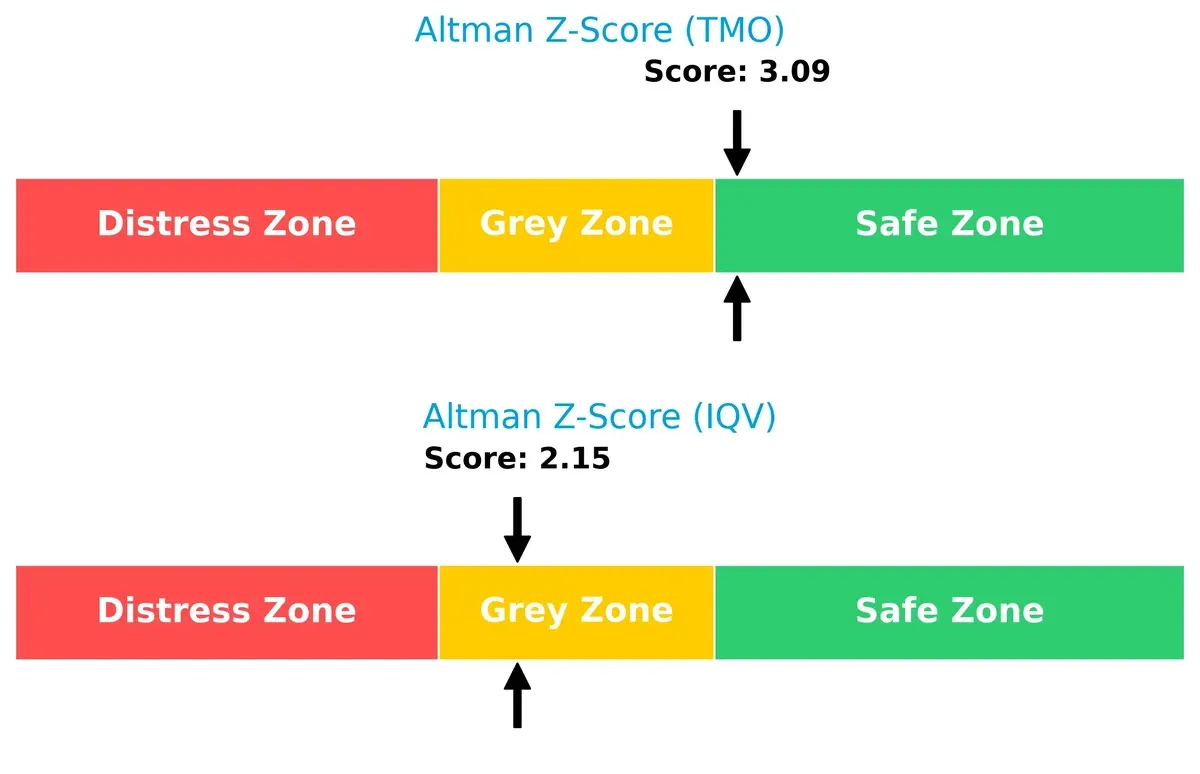
This differential suggests Thermo Fisher maintains stronger solvency and resilience in volatile cycles. IQVIA’s score warns investors to monitor financial stability closely amid tightening credit conditions.
Financial Health: Quality of Operations
Both firms report average Piotroski F-Scores, with Thermo Fisher at 6 and IQVIA at 5, signaling satisfactory but not peak financial health:
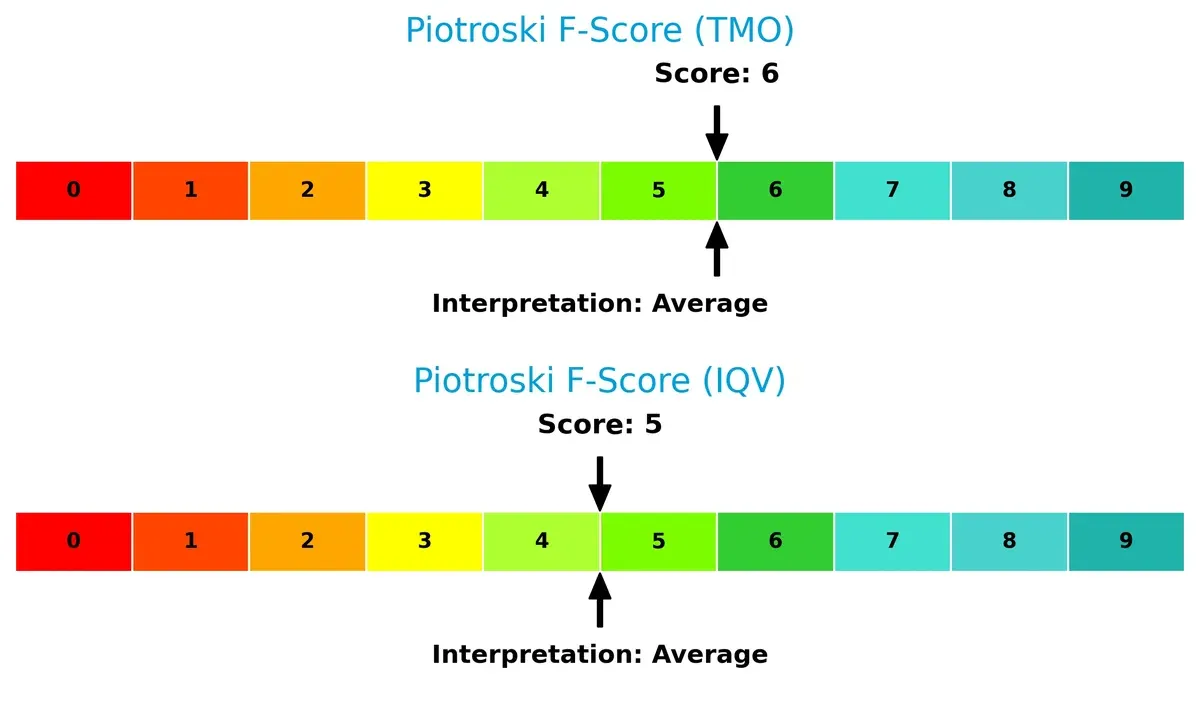
Thermo Fisher’s slightly higher score hints at better internal financial controls and operational efficiency. Neither company exhibits red flags, but investors should note the moderate scores imply room for improvement in profitability and liquidity metrics.
How are the two companies positioned?
This section dissects the operational DNA of Thermo Fisher Scientific and IQVIA by comparing their revenue distribution and internal dynamics. The goal is to confront their economic moats and identify which model offers the most resilient competitive advantage today.
Revenue Segmentation: The Strategic Mix
This visual comparison dissects how Thermo Fisher Scientific and IQVIA Holdings diversify their income streams and where their primary sector bets lie:
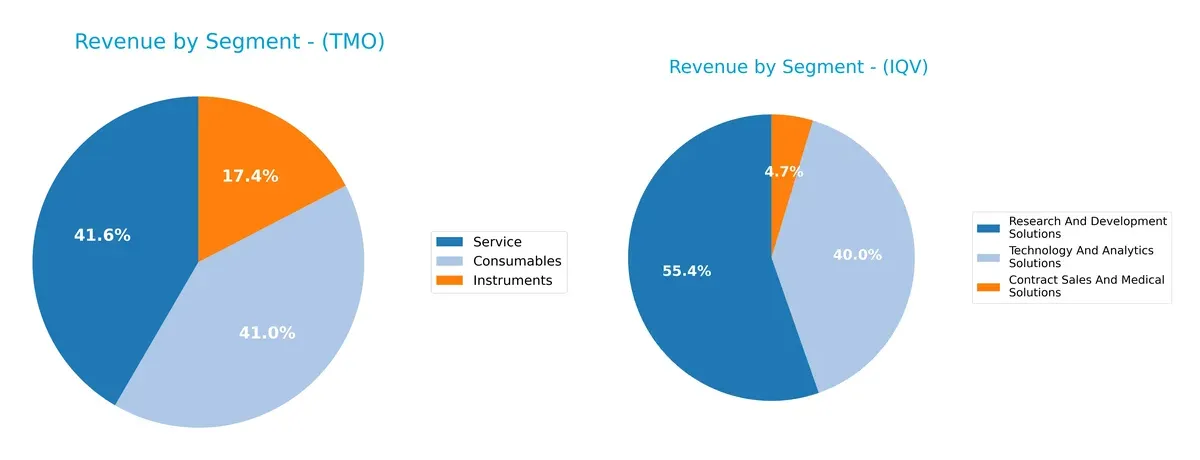
Thermo Fisher Scientific anchors its revenue with $17.9B in Consumables and $17.8B in Services, showing a balanced three-segment portfolio including $7.4B in Instruments. IQVIA pivots heavily on Research and Development Solutions at $8.5B, with Technology and Analytics Solutions at $6.2B and a smaller $718M from Contract Sales. Thermo Fisher’s broader diversification mitigates risk, while IQVIA’s concentration in R&D solutions fuels its ecosystem lock-in.
Strengths and Weaknesses Comparison
This table compares the Strengths and Weaknesses of Thermo Fisher Scientific Inc. (TMO) and IQVIA Holdings Inc. (IQV):
TMO Strengths
- Diversified revenue from consumables, instruments, and services
- Favorable net margin at 15.12%
- Strong current and quick ratios indicate good liquidity
- Favorable fixed asset turnover at 4.22
- Global presence with large US and Europe sales
IQV Strengths
- Favorable ROE at 22.63% showing high profitability
- Favorable fixed asset turnover at 19.93
- Balanced revenue streams in R&D and technology solutions
- Significant Americas and EMEA geographic revenue
- Neutral net margin and ROIC support stable core operations
TMO Weaknesses
- Unfavorable valuation multiples (PE 32.34, PB 4.08) suggest premium pricing
- Neutral ROE and ROIC imply moderate capital efficiency
- Unfavorable asset turnover at 0.40 signals lower asset utilization
- Low dividend yield at 0.29% may deter income investors
IQV Weaknesses
- Unfavorable leverage ratios with high debt to equity (2.33) and debt to assets (52.63%)
- Unfavorable liquidity with current ratio at 0.84
- Unfavorable valuation multiples (PE 25.95, PB 5.87)
- Zero dividend yield limits shareholder income
- Neutral interest coverage ratio may constrain debt servicing
Overall, TMO shows strength in diversified revenue and liquidity but faces valuation and asset efficiency challenges. IQV exhibits strong profitability and asset turnover but struggles with leverage and liquidity risks. These factors shape each company’s strategic priorities in capital allocation and risk management.
The Moat Duel: Analyzing Competitive Defensibility
A structural moat protects long-term profits from relentless competition erosion. Let’s dissect how Thermo Fisher and IQVIA defend their turf:
Thermo Fisher Scientific Inc.: Diversified Life Sciences Moat
Thermo Fisher’s moat relies on intangible assets and broad product integration. High ROIC historically underpinned margin stability, though recent declines pose risks. New biopharma and diagnostics innovations in 2026 could deepen this advantage if managed well.
IQVIA Holdings Inc.: Data-Driven Analytics Moat
IQVIA’s moat centers on network effects via proprietary data and analytics platforms, contrasting Thermo Fisher’s product breadth. Its rising ROIC signals strengthening competitive positioning. Expansion into virtual trials and technology solutions promises growth and market disruption.
Intangible Assets vs. Network Effects: The Moat Showdown
Both firms currently shed value relative to cost of capital, but IQVIA’s improving ROIC trend outpaces Thermo Fisher’s decline. IQVIA’s data-driven moat appears deeper and more durable. It is better positioned to defend and grow market share in evolving healthcare landscapes.
Which stock offers better returns?
The past year shows divergent price dynamics: Thermo Fisher Scientific’s stock declined moderately but with accelerating losses, while IQVIA Holdings faced a sharper fall before recent signs of recovery.
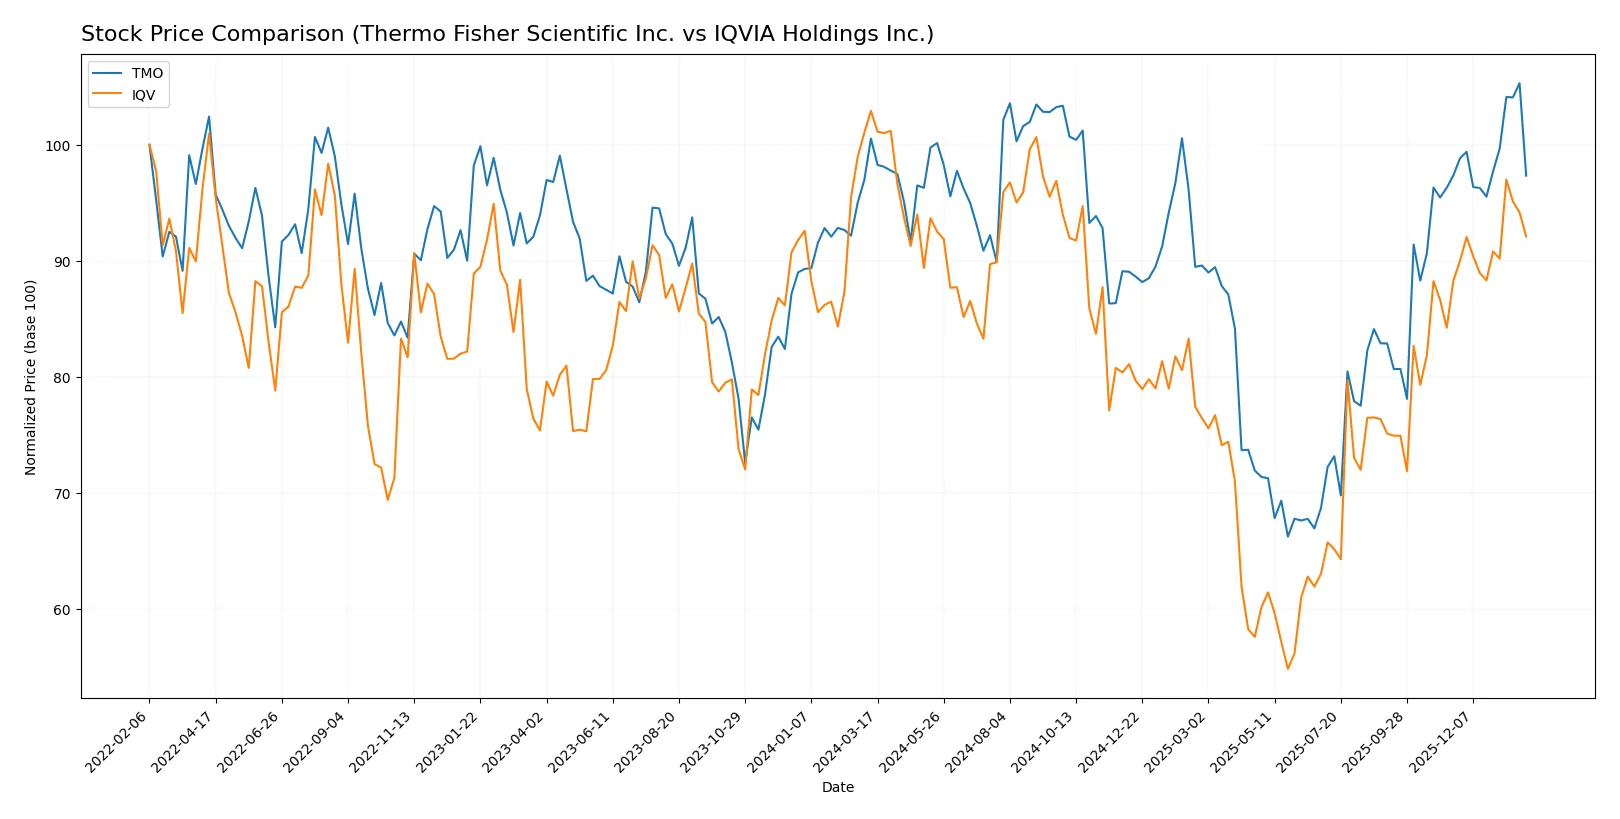
Trend Comparison
Thermo Fisher Scientific’s stock fell 3.18% over the past 12 months, marking a bearish trend with accelerating decline and significant volatility (std dev 64.8). Recent weeks show a slight positive slope but minimal price change (-0.02%).
IQVIA Holdings’ stock dropped 10.51% in the same period, a pronounced bearish trend also accelerating, with moderate volatility (std dev 30.57). The last few months reveal a rebound of 4.32%, indicating a nascent bullish phase.
Comparing both, Thermo Fisher Scientific delivered a smaller loss and higher overall price stability. IQVIA’s sharper decline offset by recent recovery points to higher volatility but weaker full-year performance.
Target Prices
Analysts present a confident target price consensus for both Thermo Fisher Scientific Inc. and IQVIA Holdings Inc.
| Company | Target Low | Target High | Consensus |
|---|---|---|---|
| Thermo Fisher Scientific Inc. | 561 | 750 | 643.69 |
| IQVIA Holdings Inc. | 214 | 290 | 253.2 |
Thermo Fisher’s consensus target of 644 USD exceeds its current 579 USD price, implying upside potential. IQVIA’s target consensus at 253 USD also suggests room for growth from the current 230 USD level.

Don’t Let Luck Decide Your Entry Point
Optimize your entry points with our advanced ProRealTime indicators. You’ll get efficient buy signals with precise price targets for maximum performance. Start outperforming now!
How do institutions grade them?
Here is a summary of the latest institutional grades for both companies:
Thermo Fisher Scientific Inc. Grades
The table below shows recent analyst grades for Thermo Fisher Scientific Inc. from major firms.
| Grading Company | Action | New Grade | Date |
|---|---|---|---|
| TD Cowen | Maintain | Buy | 2026-01-30 |
| Barclays | Maintain | Overweight | 2026-01-30 |
| Citigroup | Maintain | Buy | 2026-01-30 |
| Stifel | Maintain | Buy | 2026-01-09 |
| TD Cowen | Maintain | Buy | 2026-01-07 |
| Wells Fargo | Maintain | Overweight | 2025-12-15 |
| Citigroup | Upgrade | Buy | 2025-12-11 |
| Keybanc | Upgrade | Overweight | 2025-12-08 |
| Morgan Stanley | Maintain | Overweight | 2025-12-02 |
| HSBC | Upgrade | Buy | 2025-12-01 |
IQVIA Holdings Inc. Grades
The table below presents recent analyst grades for IQVIA Holdings Inc. from recognized institutions.
| Grading Company | Action | New Grade | Date |
|---|---|---|---|
| TD Cowen | Maintain | Hold | 2026-01-22 |
| Truist Securities | Maintain | Buy | 2026-01-08 |
| UBS | Maintain | Buy | 2026-01-08 |
| Morgan Stanley | Maintain | Overweight | 2025-12-02 |
| TD Cowen | Downgrade | Hold | 2025-11-03 |
| Truist Securities | Maintain | Buy | 2025-10-29 |
| Baird | Upgrade | Outperform | 2025-10-29 |
| Stifel | Maintain | Buy | 2025-10-29 |
| JP Morgan | Maintain | Overweight | 2025-10-29 |
| UBS | Maintain | Buy | 2025-10-29 |
Which company has the best grades?
Thermo Fisher Scientific consistently receives buy and overweight ratings from top firms. IQVIA’s grades vary more, including holds and a downgrade. Investors may view Thermo Fisher as having stronger institutional confidence.
Risks specific to each company
The following categories identify the critical pressure points and systemic threats facing both firms in the 2026 market environment:
1. Market & Competition
Thermo Fisher Scientific Inc. (TMO)
- Dominates life sciences solutions with strong global footprint but faces intense innovation pressure.
IQVIA Holdings Inc. (IQV)
- Focused on analytics and clinical research, contends with rising competition in tech-driven healthcare services.
2. Capital Structure & Debt
Thermo Fisher Scientific Inc. (TMO)
- Maintains moderate leverage (D/E 0.74), balanced debt-to-assets (36%), and solid interest coverage (5.7x).
IQVIA Holdings Inc. (IQV)
- High leverage (D/E 2.33) and debt-to-assets (53%) increase financial risk despite neutral interest coverage (3.5x).
3. Stock Volatility
Thermo Fisher Scientific Inc. (TMO)
- Beta of 0.91 suggests below-market volatility, supporting steadier stock performance.
IQVIA Holdings Inc. (IQV)
- Beta of 1.37 indicates higher sensitivity to market swings, posing greater price risk.
4. Regulatory & Legal
Thermo Fisher Scientific Inc. (TMO)
- Operates in heavily regulated diagnostics and biopharma sectors with ongoing compliance costs.
IQVIA Holdings Inc. (IQV)
- Faces complex regulatory landscape in clinical research and data privacy, increasing compliance burden.
5. Supply Chain & Operations
Thermo Fisher Scientific Inc. (TMO)
- Global supply chain complexity risks disruptions but benefits from scale and diversification.
IQVIA Holdings Inc. (IQV)
- Relies on seamless integration of tech platforms and trial operations; disruption could delay projects.
6. ESG & Climate Transition
Thermo Fisher Scientific Inc. (TMO)
- Increasing ESG initiatives with moderate exposure to climate risks in manufacturing and logistics.
IQVIA Holdings Inc. (IQV)
- ESG efforts growing but faces challenges in managing data center energy use and emissions.
7. Geopolitical Exposure
Thermo Fisher Scientific Inc. (TMO)
- Broad international presence exposes TMO to trade tensions and regulatory shifts globally.
IQVIA Holdings Inc. (IQV)
- IQV’s global clinical trials and data operations are vulnerable to geopolitical instability and regulatory divergence.
Which company shows a better risk-adjusted profile?
Thermo Fisher’s strongest risk is market competition amid innovation demands; IQV’s greatest risk lies in its high leverage. Despite both holding very favorable ratings, TMO’s safer capital structure and lower volatility provide a better risk-adjusted profile. The disparity in debt levels—TMO’s moderate versus IQV’s elevated—justifies my heightened caution toward IQV’s financial risk.
Final Verdict: Which stock to choose?
Thermo Fisher Scientific Inc. (TMO) stands out as a cash-generating powerhouse with solid operational efficiency and a resilient balance sheet. Its key point of vigilance is the declining return on invested capital, signaling potential pressure on future profitability. TMO suits portfolios seeking steady, slightly favorable exposure in healthcare innovation.
IQVIA Holdings Inc. (IQV) benefits from a strategic moat rooted in its growing return on invested capital and robust return on equity, reflecting improving profitability and operational execution. Despite higher leverage and tighter liquidity, IQV offers a more dynamic growth profile with a moderate risk buffer, fitting growth-at-a-reasonable-price (GARP) portfolios.
If you prioritize stable cash flow and operational resilience, Thermo Fisher Scientific appears the compelling choice due to its consistent income statement strength and balance sheet health. However, if you seek accelerating profitability and growth potential, IQV offers better scalability and improving capital efficiency, though with higher financial risk. Both present analytical scenarios worth considering based on individual risk tolerance and investment horizon.
Disclaimer: Investment carries a risk of loss of initial capital. The past performance is not a reliable indicator of future results. Be sure to understand risks before making an investment decision.
Go Further
I encourage you to read the complete analyses of Thermo Fisher Scientific Inc. and IQVIA Holdings Inc. to enhance your investment decisions: