In the dynamic healthcare sector, IQVIA Holdings Inc. and Revvity, Inc. stand out as influential players in medical diagnostics and research. Both companies leverage cutting-edge technology and innovation to serve life sciences and diagnostics markets globally, yet they differ in scale and strategic focus. This comparison will help investors discern which company offers the most compelling growth and value potential in today’s evolving landscape. Let’s explore which stock could best enhance your investment portfolio.

Table of contents
Companies Overview
I will begin the comparison between IQVIA Holdings Inc. and Revvity, Inc. by providing an overview of these two companies and their main differences.
IQVIA Overview
IQVIA Holdings Inc. operates in the healthcare sector, providing advanced analytics, technology solutions, and clinical research services to the life sciences industry worldwide. The company’s mission focuses on improving patient outcomes through data-driven insights and technology. With 89,000 employees and a market cap of $41.3B, IQVIA is a major player in medical diagnostics and research, serving pharmaceutical, biotechnology, and consumer health companies.
Revvity Overview
Revvity, Inc. delivers products and services to diagnostics, life sciences, and applied services markets globally. It operates through Discovery & Analytical Solutions and Diagnostics segments, supporting research breakthroughs and early disease detection. Founded in 1937 and employing 11,000 people, Revvity has a market cap of $12.4B and targets pharmaceutical, biotech, academic, and public health sectors with its technologies and solutions.
Key similarities and differences
Both IQVIA and Revvity operate in the medical diagnostics and research industry, serving life sciences clients with technology-driven solutions. However, IQVIA emphasizes advanced analytics and clinical research services, while Revvity focuses more on instruments, reagents, and diagnostic platforms. IQVIA’s larger scale contrasts with Revvity’s specialized product offerings. Both companies are US-based and listed on the NYSE, but they differ in segment structure and market capitalization.
Income Statement Comparison
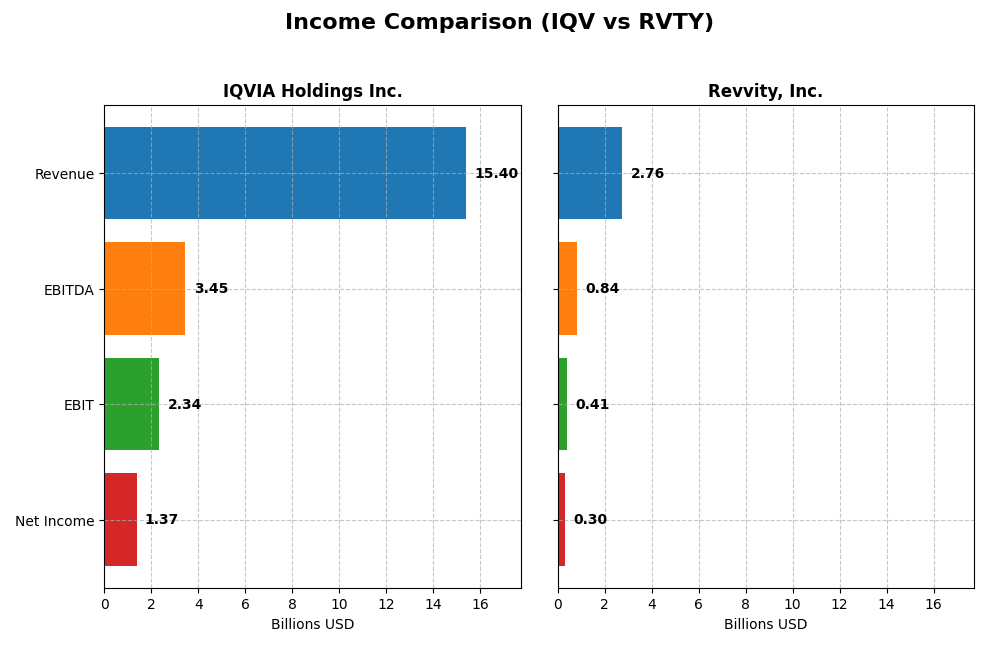
This table compares the key income statement metrics for IQVIA Holdings Inc. and Revvity, Inc. for the fiscal year 2024, providing a snapshot of their financial performance.
| Metric | IQVIA Holdings Inc. | Revvity, Inc. |
|---|---|---|
| Market Cap | 41.3B | 12.4B |
| Revenue | 15.4B | 2.8B |
| EBITDA | 3.45B | 840M |
| EBIT | 2.34B | 412M |
| Net Income | 1.37B | 296M |
| EPS | 7.57 | 2.41 |
| Fiscal Year | 2024 | 2024 |
Income Statement Interpretations
IQVIA Holdings Inc.
IQVIA has shown consistent revenue growth from 11.36B in 2020 to 15.41B in 2024, with net income rising sharply from 279M to 1.37B over the same period. Margins remain stable and favorable, with a gross margin near 35% and net margin around 9%. The 2024 performance saw slower revenue growth at 2.81% but improved EBIT growth of 9.76%, reflecting operational efficiency gains.
Revvity, Inc.
Revvity’s revenue decreased from 3.78B in 2020 to 2.76B in 2024, alongside a sharp net income decline, from 728M to 296M, despite a positive turnaround from a 2023 loss. Gross and EBIT margins are favorable, near 48% and 15%, respectively. The latest year saw almost flat revenue growth but strong net margin and EPS improvements, signaling initial recovery after prior setbacks.
Which one has the stronger fundamentals?
IQVIA demonstrates stronger fundamentals, with sustained revenue and substantial net income growth over five years, supported by favorable margin trends and effective cost control. Revvity, while showing promising margin recovery in 2024, faces challenges from overall declining revenues and net income. IQVIA’s consistent profitability and margin expansion indicate a more stable income statement profile.
Financial Ratios Comparison
The table below presents a side-by-side comparison of key financial ratios for IQVIA Holdings Inc. and Revvity, Inc. based on their most recent fiscal year data, facilitating an objective view of their financial metrics.
| Ratios | IQVIA Holdings Inc. (2024) | Revvity, Inc. (2024) |
|---|---|---|
| ROE | 22.63% | 3.86% |
| ROIC | 8.59% | 3.12% |
| P/E | 25.95 | 46.19 |
| P/B | 5.87 | 1.78 |
| Current Ratio | 0.84 | 3.60 |
| Quick Ratio | 0.84 | 3.03 |
| D/E (Debt-to-Equity) | 2.33 | 0.43 |
| Debt-to-Assets | 52.63% | 26.84% |
| Interest Coverage | 3.29 | 4.26 |
| Asset Turnover | 0.57 | 0.22 |
| Fixed Asset Turnover | 19.93 | 4.24 |
| Payout Ratio | 0% | 11.65% |
| Dividend Yield | 0% | 0.25% |
Interpretation of the Ratios
IQVIA Holdings Inc.
IQVIA shows a mixed ratio profile with a favorable return on equity at 22.63% but unfavorable price-to-earnings (PE) and price-to-book (PB) ratios at 25.95 and 5.87 respectively. The company’s current ratio at 0.84 and debt-to-equity of 2.33 indicate liquidity and leverage concerns. IQVIA does not pay dividends, reflecting a possible reinvestment strategy or prioritization of growth and R&D.
Revvity, Inc.
Revvity presents favorable net margin at 10.74% and a strong quick ratio of 3.03, indicating good liquidity. However, its return on equity is low at 3.86%, with an unfavorable PE of 46.19. The company pays a modest dividend yield of 0.25%, suggesting some shareholder returns but with risks due to its relatively low profitability and high valuation multiples.
Which one has the best ratios?
Revvity has a more balanced ratio structure with several favorable liquidity and leverage metrics, though profitability remains weak. IQVIA offers stronger profitability returns but faces challenges in liquidity and valuation ratios. Overall, Revvity’s neutral global ratio opinion contrasts with IQVIA’s slightly unfavorable profile, reflecting differing strengths and weaknesses.
Strategic Positioning
This section compares the strategic positioning of IQVIA Holdings Inc. and Revvity, Inc., covering market position, key segments, and exposure to technological disruption:
IQVIA Holdings Inc.
- Large market cap of $41B with strong competitive presence in medical diagnostics and research sectors.
- Diverse revenue streams: Technology & Analytics, R&D Solutions, and Contract Sales & Medical Solutions.
- Operates advanced analytics and cloud-based tech solutions, suggesting moderate exposure to tech disruption.
Revvity, Inc.
- Market cap of $12.4B, facing moderate competitive pressure in diagnostics and life sciences markets.
- Two main segments: Discovery & Analytical Solutions and Diagnostics, focused on instruments and assays.
- Provides detection, imaging, and genomic technologies, indicating significant exposure to technological disruption.
IQVIA Holdings Inc. vs Revvity, Inc. Positioning
IQVIA pursues a diversified business model across multiple life sciences service segments, offering resilience through varied revenue drivers. Revvity maintains a more concentrated focus on diagnostics and analytical solutions, potentially enabling specialization but increasing reliance on fewer segments.
Which has the best competitive advantage?
Both companies currently shed value relative to their cost of capital, but IQVIA shows a growing ROIC trend, suggesting improving profitability. Revvity faces declining ROIC, indicating weakening competitive advantage and value destruction over recent years.
Stock Comparison
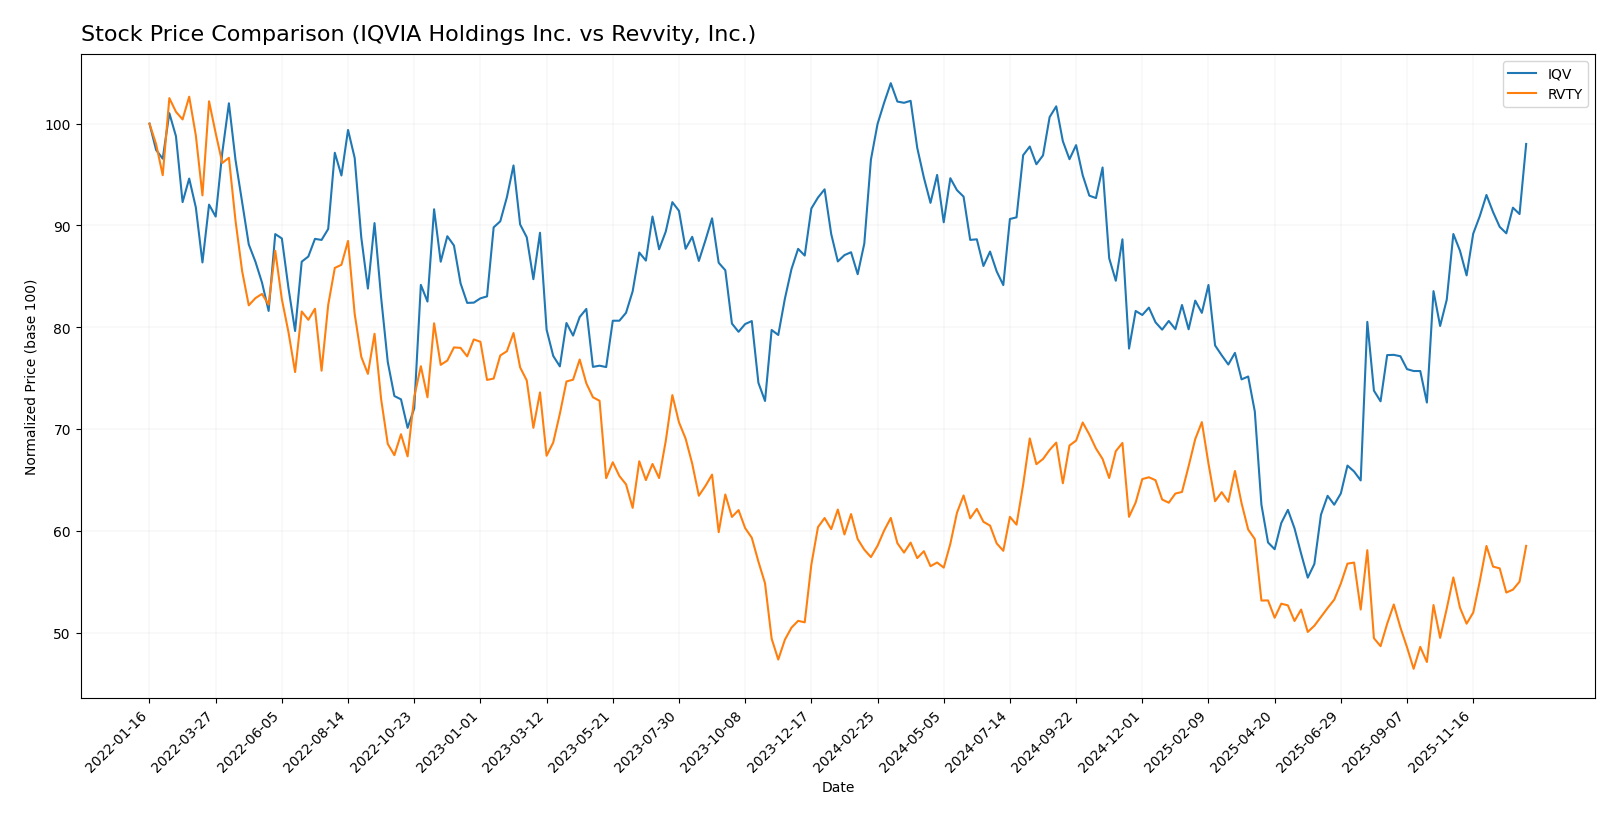
The stock price movements over the past year show mild bullish trends for both IQVIA Holdings Inc. and Revvity, Inc., with IQVIA experiencing higher volatility and stronger recent acceleration compared to Revvity’s steadier gains.
Trend Analysis
IQVIA Holdings Inc. recorded a 1.6% price increase over the past year, indicating a neutral trend overall but with acceleration and a significant recent gain of 9.93%. Price volatility is high, with a standard deviation of 30.97.
Revvity, Inc. showed a 1.92% price increase over the last 12 months, reflecting a neutral trend with acceleration and a recent 5.6% gain. Volatility is moderate, with a standard deviation of 11.29.
Comparing the two, Revvity delivered slightly better overall market performance in the past year, but IQVIA exhibited stronger recent momentum and higher volatility.
Target Prices
The consensus target prices from verified analysts indicate moderate upside potential for both IQVIA Holdings Inc. and Revvity, Inc.
| Company | Target High | Target Low | Consensus |
|---|---|---|---|
| IQVIA Holdings Inc. | 290 | 214 | 253.2 |
| Revvity, Inc. | 123 | 105 | 111.6 |
Analysts expect IQVIA’s shares to rise modestly above the current price of $242.41, while Revvity’s consensus target price suggests a potential increase from $104.43. Both stocks show a positive outlook within their respective trading ranges.
Analyst Opinions Comparison
This section compares analysts’ ratings and scores for IQVIA Holdings Inc. and Revvity, Inc.:
Rating Comparison
IQV Rating
- Rating: B+, rated Very Favorable overall.
- Discounted Cash Flow Score: 4, favorable valuation outlook.
- ROE Score: 5, very favorable efficiency in equity use.
- ROA Score: 4, favorable asset utilization.
- Debt To Equity Score: 1, very unfavorable financial risk.
- Overall Score: 3, moderate overall financial standing.
RVTY Rating
- Rating: B, rated Very Favorable overall.
- Discounted Cash Flow Score: 4, favorable valuation outlook.
- ROE Score: 3, moderate efficiency in equity use.
- ROA Score: 3, moderate asset utilization.
- Debt To Equity Score: 2, moderate financial risk.
- Overall Score: 3, moderate overall financial standing.
Which one is the best rated?
Based strictly on the provided data, IQV has a higher rating of B+ compared to RVTY’s B, with stronger ROE and ROA scores but a weaker debt-to-equity score. Both have the same overall score.
Scores Comparison
Here is a comparison of the Altman Z-Score and Piotroski Score for IQVIA Holdings Inc. and Revvity, Inc.:
IQV Scores
- Altman Z-Score: 2.15, placing IQV in the grey zone, indicating moderate bankruptcy risk.
- Piotroski Score: 5, categorized as average financial strength.
RVTY Scores
- Altman Z-Score: 2.57, placing RVTY in the grey zone, indicating moderate bankruptcy risk.
- Piotroski Score: 7, categorized as strong financial strength.
Which company has the best scores?
Revvity has a higher Altman Z-Score and a stronger Piotroski Score compared to IQV, indicating relatively better financial stability and strength based on these metrics.
Grades Comparison
Here is a comparison of the recent reliable grades assigned to IQVIA Holdings Inc. and Revvity, Inc.:
IQVIA Holdings Inc. Grades
The following table summarizes the latest grades from reputable grading companies for IQVIA Holdings Inc.:
| Grading Company | Action | New Grade | Date |
|---|---|---|---|
| Truist Securities | Maintain | Buy | 2026-01-08 |
| UBS | Maintain | Buy | 2026-01-08 |
| Morgan Stanley | Maintain | Overweight | 2025-12-02 |
| TD Cowen | Downgrade | Hold | 2025-11-03 |
| Baird | Upgrade | Outperform | 2025-10-29 |
| Truist Securities | Maintain | Buy | 2025-10-29 |
| JP Morgan | Maintain | Overweight | 2025-10-29 |
| Stifel | Maintain | Buy | 2025-10-29 |
| Citigroup | Maintain | Neutral | 2025-10-29 |
| UBS | Maintain | Buy | 2025-10-29 |
IQVIA’s grades mostly indicate a strong buy sentiment with several upgrades and maintained buy and overweight ratings, though one downgrade to hold was noted.
Revvity, Inc. Grades
The following table summarizes the latest grades from reputable grading companies for Revvity, Inc.:
| Grading Company | Action | New Grade | Date |
|---|---|---|---|
| Barclays | Maintain | Overweight | 2025-12-15 |
| Wells Fargo | Maintain | Equal Weight | 2025-12-15 |
| Barclays | Maintain | Overweight | 2025-10-28 |
| Baird | Maintain | Outperform | 2025-10-28 |
| Evercore ISI Group | Maintain | Outperform | 2025-10-07 |
| Barclays | Maintain | Overweight | 2025-10-02 |
| B of A Securities | Maintain | Buy | 2025-09-22 |
| Raymond James | Maintain | Outperform | 2025-07-29 |
| Stifel | Maintain | Hold | 2025-07-29 |
| Evercore ISI Group | Maintain | Outperform | 2025-07-08 |
Revvity’s grades show a consistent pattern of overweight and outperform ratings, with no downgrades reported.
Which company has the best grades?
Both IQVIA Holdings Inc. and Revvity, Inc. hold a consensus rating of “Buy.” IQVIA has a larger number of buy and overweight ratings with occasional upgrades and a few holds, while Revvity maintains steady overweight and outperform ratings without downgrades. Investors may view IQVIA’s slightly broader analyst support as indicative of stronger confidence but both companies exhibit generally positive grades.
Strengths and Weaknesses
Below is a comparative overview of IQVIA Holdings Inc. (IQV) and Revvity, Inc. (RVTY) based on key investment criteria.
| Criterion | IQVIA Holdings Inc. (IQV) | Revvity, Inc. (RVTY) |
|---|---|---|
| Diversification | Highly diversified across R&D, tech, and contract sales with $8.5B in R&D solutions, $6.2B tech, $0.7B contract sales | Less diversified, focused on Diagnostics ($1.5B) and Life Sciences ($1.25B) |
| Profitability | Moderate profitability: ROIC 8.6% near WACC 8.7%, net margin 8.9%, ROE 22.6% favorable | Lower profitability: ROIC 3.1% below WACC 7.5%, net margin 10.7%, ROE 3.9% unfavorable |
| Innovation | Strong innovation focus in technology and analytics segments | Innovation centered on diagnostics and life sciences, but declining profitability hints at challenges |
| Global presence | Large global footprint with broad medical solutions and analytics services | More niche global presence focused on diagnostics and life sciences markets |
| Market Share | Significant market share in clinical research and technology solutions | Smaller market share, emerging player with less scale compared to IQV |
Key takeaways: IQV shows better diversification and stronger profitability metrics, although its value creation is slightly unfavorable. Revvity faces profitability and value destruction challenges despite a focused business model. Investors should weigh IQV’s scale and innovation against RVTY’s potential turnaround risks.
Risk Analysis
Below is a comparative table highlighting key risks for IQVIA Holdings Inc. (IQV) and Revvity, Inc. (RVTY) based on their latest financial and operational profiles for 2024.
| Metric | IQVIA Holdings Inc. (IQV) | Revvity, Inc. (RVTY) |
|---|---|---|
| Market Risk | High beta (1.367) implies higher volatility and sensitivity to market swings. | Moderate beta (1.055) suggests somewhat less volatility but still exposed. |
| Debt Level | High leverage with debt/equity of 2.33 and debt/assets at 52.63%, indicating elevated financial risk. | Low leverage with debt/equity of 0.43 and debt/assets at 26.84%, showing stronger balance sheet. |
| Regulatory Risk | Operates globally in life sciences, facing complex regulatory environments across multiple jurisdictions. | Also exposed to stringent regulations in diagnostics and life sciences, but with a narrower product focus. |
| Operational Risk | Large, diversified segments increase complexity but offer resilience; 89K employees indicate scale. | Smaller scale with 11K employees but reliant on innovation and product development, which can be operationally demanding. |
| Environmental Risk | Moderate, with corporate responsibility likely but limited direct environmental impact. | Similar moderate exposure; analytical instrumentation may have some environmental footprint. |
| Geopolitical Risk | Global operations expose IQV to geopolitical instability in emerging markets. | Primarily US-based with international sales, less exposed but still sensitive to trade policies. |
The most impactful risk for IQV is its high debt level, which may constrain financial flexibility amid market volatility. For Revvity, operational risk linked to innovation and market competition is critical, although its stronger balance sheet mitigates financial risks. Both face regulatory challenges inherent to healthcare and diagnostics sectors.
Which Stock to Choose?
IQVIA Holdings Inc. shows a favorable income statement with strong profitability and growing earnings over 2020-2024. However, its financial ratios are slightly unfavorable, marked by high debt levels and moderate liquidity. Its rating is very favorable with a B+ score.
Revvity, Inc. presents a favorable income statement but with declining revenue and profitability trends overall. Its financial ratios are neutral, balancing favorable leverage and liquidity with weaker returns. The company holds a very favorable B rating.
Investors seeking growth and strong profitability might view IQVIA’s improving income and higher ROE as positive signals, despite leverage concerns. Conversely, those prioritizing financial stability and moderate risk could find Revvity’s balanced ratios and stronger liquidity more appealing, albeit with caution about its declining profitability trend.
Disclaimer: Investment carries a risk of loss of initial capital. The past performance is not a reliable indicator of future results. Be sure to understand risks before making an investment decision.
Go Further
I encourage you to read the complete analyses of IQVIA Holdings Inc. and Revvity, Inc. to enhance your investment decisions: