In the evolving healthcare sector, IQVIA Holdings Inc. and Quest Diagnostics Incorporated stand out as leaders in medical diagnostics and research. Both companies serve critical roles in providing advanced testing, data analytics, and clinical services, with some overlap in innovation strategies and market reach. This comparison will help investors understand which company presents the most compelling opportunity for growth and stability in their portfolio. Let’s explore which stock might best suit your investment goals.
Table of contents
Companies Overview
I will begin the comparison between IQVIA Holdings Inc. and Quest Diagnostics Incorporated by providing an overview of these two companies and their main differences.
IQVIA Overview
IQVIA Holdings Inc. operates in the healthcare sector, providing advanced analytics, technology solutions, and clinical research services globally. Its business is segmented into Technology & Analytics Solutions, Research & Development Solutions, and Contract Sales & Medical Solutions. IQVIA serves pharmaceutical, biotechnology, device, diagnostic, and consumer health companies, positioning itself as a key partner in life sciences innovation with a market cap of $41.3B and 89K employees.
DGX Overview
Quest Diagnostics Incorporated delivers diagnostic testing and information services primarily in the U.S. and internationally, operating under multiple brands including Quest Diagnostics and AmeriPath. It offers routine and advanced clinical testing, pathology, and IT solutions to a diverse client base including healthcare providers, insurers, and employers. Quest has a market cap of $19.5B and employs 55K people, focusing on diagnostic insights and risk assessment services.
Key similarities and differences
Both IQV and DGX operate within the medical diagnostics and research industry, serving healthcare markets with critical data and testing services. IQV’s model is broader, incorporating technology and clinical research alongside analytics, while Quest focuses more on diagnostic testing services and information delivery. IQV has a larger market cap and workforce, emphasizing global reach and integrated solutions, whereas Quest offers specialized diagnostic services primarily in North America with a strong brand portfolio.
Income Statement Comparison
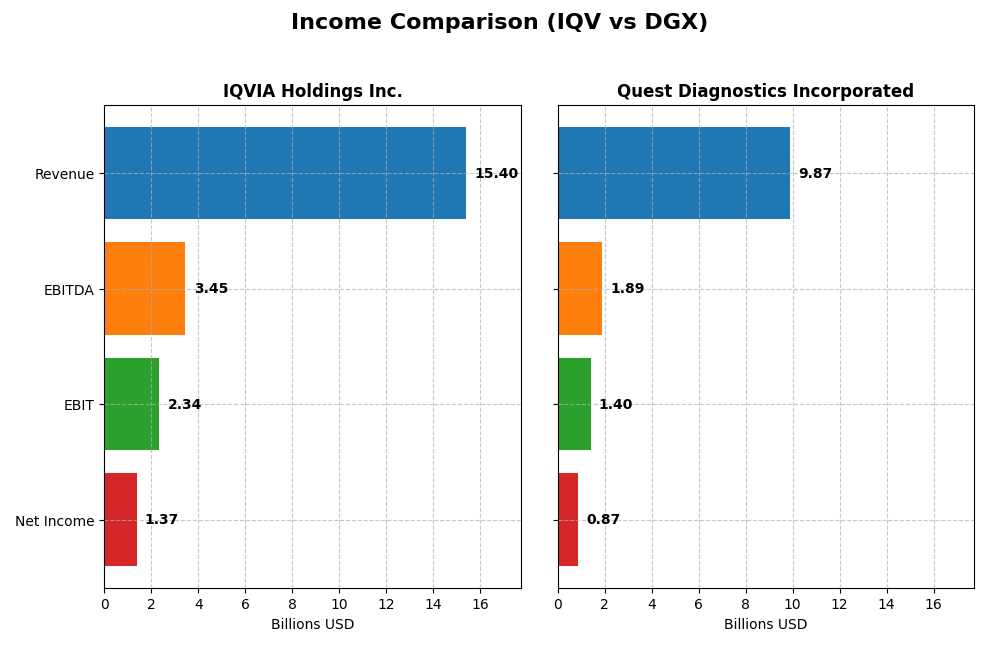
The table below presents a side-by-side comparison of key income statement metrics for IQVIA Holdings Inc. and Quest Diagnostics Incorporated for the fiscal year 2024.
| Metric | IQVIA Holdings Inc. | Quest Diagnostics Incorporated |
|---|---|---|
| Market Cap | 41.3B | 19.5B |
| Revenue | 15.4B | 9.9B |
| EBITDA | 3.45B | 1.89B |
| EBIT | 2.34B | 1.40B |
| Net Income | 1.37B | 871M |
| EPS | 7.57 | 7.80 |
| Fiscal Year | 2024 | 2024 |
Income Statement Interpretations
IQVIA Holdings Inc.
IQVIA demonstrated strong revenue growth from $11.36B in 2020 to $15.41B in 2024, with net income rising impressively from $279M to $1.37B over the same period. Margins remained favorable, with gross margin at 34.89% and net margin near 8.91%. The 2024 year showed slower revenue growth at 2.81% but improved EBIT growth of 9.76%, indicating operational efficiency gains.
Quest Diagnostics Incorporated
Quest’s revenue fluctuated moderately around $9.44B to $9.87B between 2020 and 2024, with net income declining from $1.43B to $871M. Gross margin remained healthy at 32.86%, and net margin was stable at 8.82%. The recent year saw a 6.7% revenue increase but a 4.41% drop in net margin, reflecting margin pressure despite solid top-line growth.
Which one has the stronger fundamentals?
IQVIA’s fundamentals appear stronger due to significant overall revenue and net income growth, supported by consistently favorable margin trends and efficient expense management. Quest Diagnostics shows steadier revenue with mixed margin results and declining net income over the period. IQVIA’s higher growth rates and margin improvements provide a more robust income statement profile.
Financial Ratios Comparison
The table below compares key financial ratios for IQVIA Holdings Inc. (IQV) and Quest Diagnostics Incorporated (DGX) based on their most recent fiscal year data (2024).
| Ratios | IQVIA Holdings Inc. (IQV) | Quest Diagnostics Inc. (DGX) |
|---|---|---|
| ROE | 22.63% | 12.85% |
| ROIC | 8.59% | 6.96% |
| P/E | 25.95 | 19.23 |
| P/B | 5.87 | 2.47 |
| Current Ratio | 0.84 | 1.10 |
| Quick Ratio | 0.84 | 1.02 |
| D/E | 2.33 | 1.05 |
| Debt-to-Assets | 52.63% | 43.87% |
| Interest Coverage | 3.29 | 5.96 |
| Asset Turnover | 0.57 | 0.61 |
| Fixed Asset Turnover | 19.93 | 3.57 |
| Payout ratio | 0% | 38.00% |
| Dividend yield | 0% | 1.98% |
Interpretation of the Ratios
IQVIA Holdings Inc.
IQVIA shows a mixed financial profile with a strong return on equity at 22.63% and favorable fixed asset turnover, but concerns arise from its low current ratio of 0.84 and high debt-to-equity ratio of 2.33. Valuation metrics like a PE of 25.95 and PB of 5.87 are unfavorable. The company does not pay dividends, reflecting a reinvestment strategy possibly focused on growth or operational needs.
Quest Diagnostics Incorporated
Quest Diagnostics presents generally stable ratios with a neutral net margin near 8.82% and a favorable weighted average cost of capital at 5.71%. The current and quick ratios indicate reasonable liquidity. Its debt-to-equity ratio at 1.05 is slightly unfavorable, but interest coverage of 6.2 is favorable. The company pays dividends with a 1.98% yield, suggesting moderate shareholder returns without excessive distribution risks.
Which one has the best ratios?
Quest Diagnostics holds a slightly favorable overall ratios evaluation with 28.57% favorable metrics and fewer unfavorable indicators, suggesting better financial health and risk management. IQVIA, by contrast, faces more unfavorable ratios at 42.86%, particularly in liquidity and leverage, resulting in a slightly unfavorable global opinion.
Strategic Positioning
This section compares the strategic positioning of IQV and DGX, including Market position, Key segments, and Exposure to technological disruption:
IQV
- Leading global life sciences analytics and clinical research provider with strong competitive pressure.
- Diverse segments: Technology & Analytics, R&D Solutions, and Contract Sales driving growth.
- Exposed to disruption through cloud-based analytics and virtual clinical trials innovations.
DGX
- Major US diagnostic testing provider facing moderate competitive pressure in clinical diagnostics.
- Focused on diagnostic information services, including routine, advanced, and pathology testing.
- Faces technological change mainly in diagnostic technologies and IT solutions for healthcare.
IQV vs DGX Positioning
IQV operates a diversified business model spanning analytics, clinical research, and sales solutions, providing multiple growth drivers. DGX concentrates on diagnostic testing services with a narrower focus but extensive market presence, balancing specialization with potential market limitations.
Which has the best competitive advantage?
Both companies have a slightly unfavorable moat status. IQV shows growing profitability despite value destruction, while DGX experiences declining profitability without value creation, indicating IQV may have a more resilient competitive position.
Stock Comparison
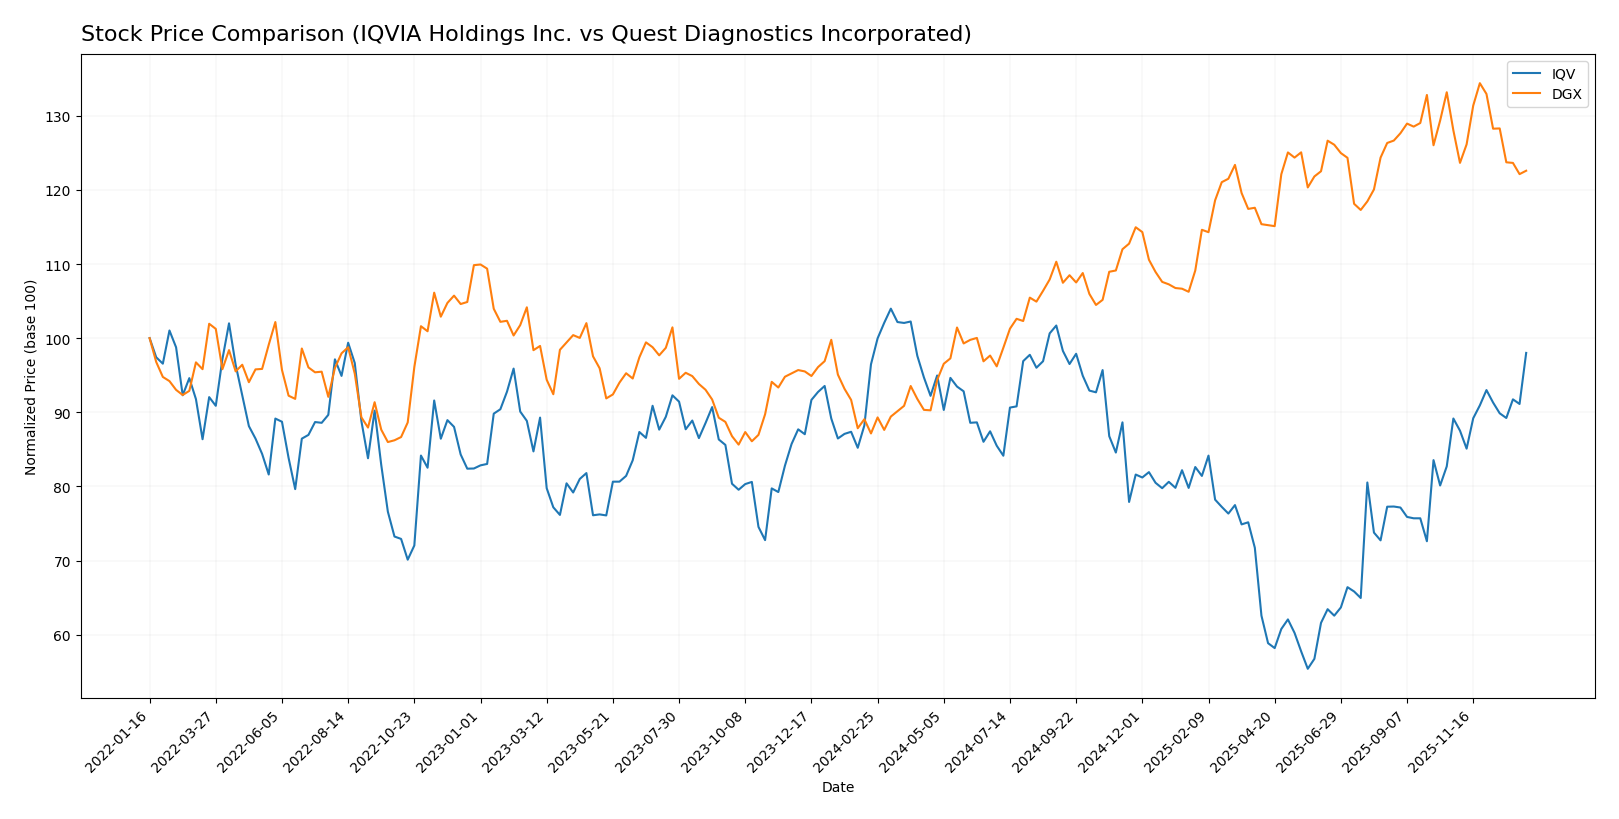
The stock prices of IQVIA Holdings Inc. and Quest Diagnostics Incorporated have exhibited distinct trajectories over the past year, highlighting varying momentum and trading dynamics in their respective markets.
Trend Analysis
IQVIA Holdings Inc. experienced a modest bullish trend with a 1.6% price increase over the past year, showing acceleration and a broad price range between 137.0 and 257.18. Quest Diagnostics Incorporated posted a strong bullish trend with a 40.68% rise over the same period, though its acceleration has decelerated with prices ranging from 124.0 to 191.25. Comparing the two, Quest Diagnostics outperformed IQVIA with a significantly higher market gain despite recent short-term declines.
Target Prices
The current analyst consensus reveals promising upside potential for both IQVIA Holdings Inc. and Quest Diagnostics Incorporated.
| Company | Target High | Target Low | Consensus |
|---|---|---|---|
| IQVIA Holdings Inc. | 290 | 214 | 253.2 |
| Quest Diagnostics Incorporated | 215 | 190 | 201.6 |
Analysts expect IQVIA’s stock to rise modestly above its current price of 242.41 USD, while Quest Diagnostics shows potential for significant appreciation from its 174.44 USD level.
Analyst Opinions Comparison
This section compares analysts’ ratings and grades for IQVIA Holdings Inc. (IQV) and Quest Diagnostics Incorporated (DGX):
Rating Comparison
IQV Rating
- Rating: B+ indicating a very favorable outlook.
- Discounted Cash Flow Score: 4, considered favorable for future cash flow projections.
- ROE Score: 5, very favorable, showing high efficiency in generating profit from equity.
- ROA Score: 4, favorable, reflecting effective utilization of assets to generate earnings.
- Debt To Equity Score: 1, very unfavorable, indicating high financial risk due to debt levels.
- Overall Score: 3, moderate, summarizing a balanced financial standing.
DGX Rating
- Rating: B indicating a very favorable outlook.
- Discounted Cash Flow Score: 4, also favorable for future cash flow projections.
- ROE Score: 4, favorable, indicating good profit generation from shareholders’ equity.
- ROA Score: 4, favorable, showing effective asset utilization to generate earnings.
- Debt To Equity Score: 1, very unfavorable, also indicating high financial risk from debt.
- Overall Score: 3, moderate, reflecting a similar balanced financial standing.
Which one is the best rated?
Based strictly on the data, IQV has a higher overall rating (B+) and a superior ROE score (5 vs. 4), suggesting a stronger profitability profile than DGX. Both share similar scores in other areas, including a moderate overall score and unfavorable debt-to-equity risk.
Scores Comparison
Here is a comparison of the financial scores for IQV and DGX:
IQV Scores
- Altman Z-Score: 2.15, indicating a grey zone with moderate bankruptcy risk.
- Piotroski Score: 5, classified as average financial strength.
DGX Scores
- Altman Z-Score: 3.20, indicating a safe zone with low bankruptcy risk.
- Piotroski Score: 7, classified as strong financial strength.
Which company has the best scores?
Based on the provided data, DGX has better scores than IQV, with a safer Altman Z-Score and a stronger Piotroski Score, indicating higher financial stability and strength.
Grades Comparison
The following section compares the recent grades assigned to IQVIA Holdings Inc. and Quest Diagnostics Incorporated by reputable grading companies:
IQVIA Holdings Inc. Grades
This table presents recent grade updates from verified grading companies for IQVIA Holdings Inc.:
| Grading Company | Action | New Grade | Date |
|---|---|---|---|
| Truist Securities | Maintain | Buy | 2026-01-08 |
| UBS | Maintain | Buy | 2026-01-08 |
| Morgan Stanley | Maintain | Overweight | 2025-12-02 |
| TD Cowen | Downgrade | Hold | 2025-11-03 |
| Baird | Upgrade | Outperform | 2025-10-29 |
| Truist Securities | Maintain | Buy | 2025-10-29 |
| JP Morgan | Maintain | Overweight | 2025-10-29 |
| Stifel | Maintain | Buy | 2025-10-29 |
| Citigroup | Maintain | Neutral | 2025-10-29 |
| UBS | Maintain | Buy | 2025-10-29 |
IQVIA’s grades show a predominantly positive trend with multiple buy and overweight ratings and only one recent downgrade to hold.
Quest Diagnostics Incorporated Grades
This table shows current grades from recognized grading companies for Quest Diagnostics Incorporated:
| Grading Company | Action | New Grade | Date |
|---|---|---|---|
| Piper Sandler | Maintain | Neutral | 2025-10-27 |
| Truist Securities | Maintain | Hold | 2025-10-22 |
| Barclays | Maintain | Equal Weight | 2025-10-22 |
| Leerink Partners | Maintain | Outperform | 2025-10-21 |
| Jefferies | Maintain | Buy | 2025-10-21 |
| Mizuho | Maintain | Outperform | 2025-10-17 |
| UBS | Maintain | Neutral | 2025-10-17 |
| Evercore ISI Group | Maintain | In Line | 2025-10-08 |
| Barclays | Maintain | Equal Weight | 2025-10-02 |
| Baird | Downgrade | Neutral | 2025-08-25 |
Quest Diagnostics’ grades reflect a mixed consensus with several hold and neutral ratings, interspersed with some outperform and buy opinions.
Which company has the best grades?
IQVIA Holdings Inc. has received a stronger grade consensus, dominated by buy and overweight ratings, compared to Quest Diagnostics Incorporated’s more neutral and hold-oriented grades. This suggests IQVIA may be viewed more favorably by analysts, potentially influencing investor confidence and portfolio positioning.
Strengths and Weaknesses
Below is a comparison table highlighting the key strengths and weaknesses of IQVIA Holdings Inc. (IQV) and Quest Diagnostics Incorporated (DGX) based on their latest financial and operational data.
| Criterion | IQVIA Holdings Inc. (IQV) | Quest Diagnostics Incorporated (DGX) |
|---|---|---|
| Diversification | Highly diversified with strong segments in Research & Development ($8.53B in 2024) and Technology & Analytics ($6.16B) | Focused mainly on Diagnostic Information Services ($9.61B in 2024), less diversified |
| Profitability | ROE 22.63% (favorable), net margin 8.91% (neutral), but ROIC below WACC (-0.10) indicating slight value destruction | ROE 12.85% (neutral), net margin 8.82% (neutral), ROIC above WACC (+1.25) but declining |
| Innovation | Strong investment in R&D and technology solutions, driving growth in ROIC (+192% trend) | Moderate innovation with stable services but declining ROIC (-42%) raises concerns |
| Global presence | Extensive international operations supporting diversified revenue streams | Primarily US-focused diagnostic services, limiting global footprint |
| Market Share | Leading in clinical research services with expanding analytics | Dominant in US diagnostic market, but facing margin pressure |
In summary, IQVIA shows strong innovation and diversification with improving profitability trends despite current slight value destruction. Quest Diagnostics benefits from stable profitability and a strong market position but is challenged by declining returns and limited diversification. Both companies present opportunities with different risk profiles to consider carefully.
Risk Analysis
The following table summarizes key risks for IQVIA Holdings Inc. (IQV) and Quest Diagnostics Incorporated (DGX) based on the most recent 2024 data:
| Metric | IQVIA Holdings Inc. (IQV) | Quest Diagnostics Inc. (DGX) |
|---|---|---|
| Market Risk | High beta (1.37) indicates higher volatility and sensitivity to market swings | Lower beta (0.64) suggests lower market volatility risk |
| Debt level | High debt-to-equity ratio (2.33) and debt to assets (53%) pose financial leverage risk | Moderate debt-to-equity (1.05) and debt to assets (44%) with strong interest coverage |
| Regulatory Risk | Moderate; operates globally, exposed to multi-jurisdictional healthcare regulations | Moderate; primarily US-focused but exposed to healthcare regulatory changes |
| Operational Risk | Complex services across analytics, trials, and technology increase operational complexity | Operational risks from diagnostics services network and IT solutions |
| Environmental Risk | Moderate; healthcare sector impact from sustainability regulations | Moderate; similar sector exposure but less global footprint |
| Geopolitical Risk | Elevated due to presence in Americas, Europe, Africa, Asia-Pacific | Moderate, mostly US-centric operations with limited international exposure |
The most impactful risks relate to IQV’s high leverage and market volatility, which increase financial vulnerability despite strong operational segments. DGX benefits from lower market risk and better financial stability but faces operational and regulatory challenges. Investors should weigh IQV’s growth potential against its financial risk and consider DGX’s steadier profile for risk-averse strategies.
Which Stock to Choose?
IQVIA Holdings Inc. shows a favorable income statement with strong profitability and increasing earnings, despite a slight one-year revenue growth slowdown. Financial ratios present a mixed picture with high return on equity but unfavorable leverage and liquidity metrics. The overall rating is very favorable.
Quest Diagnostics Incorporated exhibits a stable income evolution with moderate revenue growth and profitability. Its financial ratios are slightly more favorable, especially in liquidity and cost of capital, though return on equity is lower than IQV’s. The company holds a very favorable rating with stronger financial stability scores.
For investors seeking growth and higher profitability potential, IQVIA might appear more attractive given its strong earnings growth and return on equity. Conversely, those prioritizing financial stability and lower leverage could find Quest Diagnostics more aligned with a cautious investment profile. Both companies show slightly unfavorable moats, indicating potential risks regarding value creation.
Disclaimer: Investment carries a risk of loss of initial capital. The past performance is not a reliable indicator of future results. Be sure to understand risks before making an investment decision.
Go Further
I encourage you to read the complete analyses of IQVIA Holdings Inc. and Quest Diagnostics Incorporated to enhance your investment decisions: