Home > Comparison > Technology > TXN vs IPGP
The strategic rivalry between Texas Instruments Incorporated and IPG Photonics Corporation shapes the semiconductor industry’s innovation frontier. Texas Instruments operates as a diversified semiconductor powerhouse with strong analog and embedded processing segments. In contrast, IPG Photonics specializes in high-performance fiber lasers, serving niche industrial and communications markets. This analysis will assess their contrasting growth vectors and capital allocation to identify which company presents a superior risk-adjusted opportunity for a balanced technology portfolio.
Table of contents
Companies Overview
Texas Instruments and IPG Photonics play pivotal roles in the semiconductor industry’s evolving landscape. Both companies leverage advanced technology but target distinct market niches with unique competitive edges.
Texas Instruments Incorporated: Analog and Embedded Processing Powerhouse
Texas Instruments dominates the semiconductor sector through its dual-segment business model, focusing on Analog and Embedded Processing products. Its core revenue stems from power management solutions and microcontrollers used widely in industrial, automotive, and electronics markets. In 2026, Texas Instruments emphasizes expanding its Analog product portfolio, reinforcing its position as a global supplier with broad market penetration.
IPG Photonics Corporation: Leader in Fiber Laser Technologies
IPG Photonics specializes in high-performance fiber lasers and amplifiers primarily for materials processing and telecommunications. Its revenue comes from selling laser systems and related components to OEMs and system integrators worldwide. In 2026, IPG concentrates on enhancing its laser system capabilities and expanding applications in advanced manufacturing and communications infrastructure.
Strategic Collision: Similarities & Divergences
Texas Instruments and IPG Photonics both innovate within semiconductors but pursue divergent strategies. Texas Instruments adopts a broad-based approach with a diverse product ecosystem, while IPG Photonics focuses on a specialized laser technology niche. Their primary battleground is industrial applications, where precision and efficiency drive demand. This contrast creates distinct investment profiles: one favors scale and diversification, the other targets high-margin, specialized technology leadership.
Income Statement Comparison
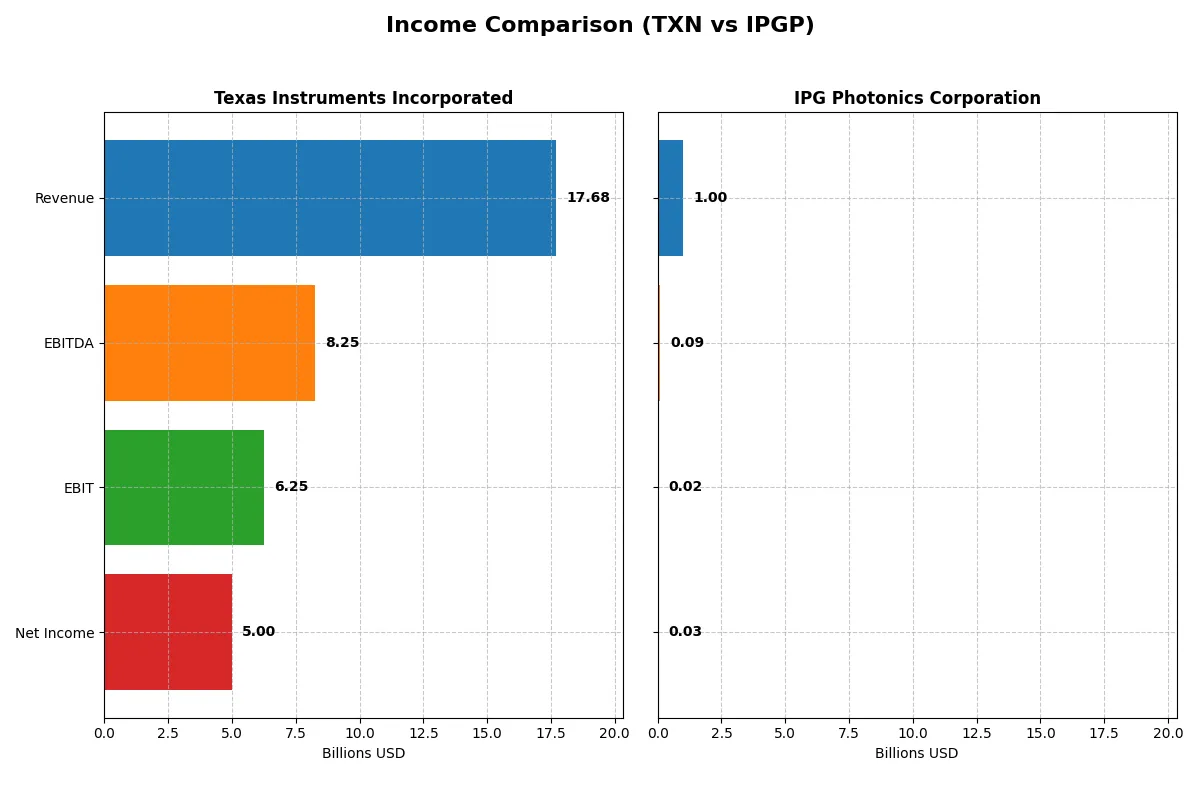
This data dissects the core profitability and scalability of both corporate engines to reveal who dominates the bottom line:
| Metric | Texas Instruments Incorporated (TXN) | IPG Photonics Corporation (IPGP) |
|---|---|---|
| Revenue | 17.7B | 1.0B |
| Cost of Revenue | 7.6B | 622M |
| Operating Expenses | 4.1B | 368M |
| Gross Profit | 10.1B | 381M |
| EBITDA | 8.3B | 90M |
| EBIT | 6.3B | 23M |
| Interest Expense | 543M | 0 |
| Net Income | 5.0B | 31M |
| EPS | 5.45 | 0.73 |
| Fiscal Year | 2025 | 2025 |
Income Statement Analysis: The Bottom-Line Duel
The upcoming income statement comparison reveals how efficiently Texas Instruments and IPG Photonics convert revenue into profit amid their unique market dynamics.
Texas Instruments Incorporated Analysis
Texas Instruments shows a mixed revenue trajectory, with 2025 revenue at $17.7B, up 13% from 2024 but down over the five-year period. Net income fell sharply over five years but remains robust at $5B in 2025. Gross margin holds strong at 57%, and net margin hovers near 28%, signaling solid operational efficiency despite recent margin compression.
IPG Photonics Corporation Analysis
IPG’s revenue declined 31% over five years, reaching $1B in 2025, with a slight one-year growth of 2.7%. Net income swung from a heavy loss in 2024 to a modest $31M profit in 2025. Gross margin steadied at 38%, but net margin remains thin at 3.1%. The company improved EBIT by 59% year-over-year, suggesting operational momentum recovery.
Margin Strength vs. Recovery Momentum
Texas Instruments dominates in scale and margin quality, delivering consistent profitability despite some recent margin erosion. IPG Photonics, while smaller and less profitable, shows signs of operational recovery with sharp EBIT and net margin improvements in 2025. Investors must weigh Texas Instruments’ established margin power against IPG’s turnaround potential.
Financial Ratios Comparison
These vital ratios act as a diagnostic tool to expose the underlying fiscal health, valuation premiums, and capital efficiency of the companies compared below:
| Ratios | Texas Instruments (TXN) | IPG Photonics (IPGP) |
|---|---|---|
| ROE | 30.7% | 1.5% |
| ROIC | 16.5% | 0.4% |
| P/E | 31.5 | 98.1 |
| P/B | 9.7 | 1.4 |
| Current Ratio | 4.35 | 6.08 |
| Quick Ratio | 2.83 | 4.74 |
| D/E | 0.95 | 0 |
| Debt-to-Assets | 44.5% | 0 |
| Interest Coverage | 11.1 | 0 |
| Asset Turnover | 0.51 | 0.41 |
| Fixed Asset Turnover | 1.44 | 1.57 |
| Payout ratio | 100% | 0% |
| Dividend yield | 3.17% | 0% |
| Fiscal Year | 2025 | 2025 |
Efficiency & Valuation Duel: The Vital Signs
Financial ratios act as a company’s DNA, unveiling hidden risks and operational strengths that shape investment decisions.
Texas Instruments Incorporated
Texas Instruments displays robust profitability with a 30.7% ROE and a strong 28.3% net margin, reflecting operational excellence. Its valuation appears stretched, trading at a 31.5 P/E and 9.7 P/B, above typical sector norms. The company rewards shareholders with a 3.2% dividend yield, signaling steady income alongside reinvestment in R&D for growth.
IPG Photonics Corporation
IPG Photonics struggles with weak profitability, posting just 1.5% ROE and a slim 3.1% net margin. Its valuation is highly stretched, sporting a 98.1 P/E, although the 1.4 P/B ratio is modest. The firm lacks dividends, instead focusing on capital preservation with zero debt and a high current ratio, but returns remain subdued, raising concerns on operational efficiency.
Premium Valuation vs. Operational Safety
Texas Instruments balances strong returns and consistent dividends despite a premium valuation, suggesting confidence in sustainable growth. IPG Photonics offers a safer balance sheet but suffers from poor profitability and stretched valuation multiples. Investors seeking reliable income and operational strength may prefer Texas Instruments, while risk-tolerant profiles might consider IPG’s capital stability.
Which one offers the Superior Shareholder Reward?
I see Texas Instruments (TXN) pays a 3.17% dividend yield with nearly full payout coverage, reflecting strong free cash flow support. TXN also executes consistent buybacks, enhancing total shareholder return sustainably. IPG Photonics (IPGP) pays no dividends and generates negative free cash flow in 2025, relying on reinvestment and acquisitions. While IPGP shows higher growth potential, its buyback activity is minimal, and profitability margins remain thin. I judge TXN’s balanced dividend and buyback approach offers a more reliable, attractive total return profile for 2026 investors.
Comparative Score Analysis: The Strategic Profile
The radar chart reveals the fundamental DNA and trade-offs of Texas Instruments and IPG Photonics, highlighting their financial strengths and weaknesses:
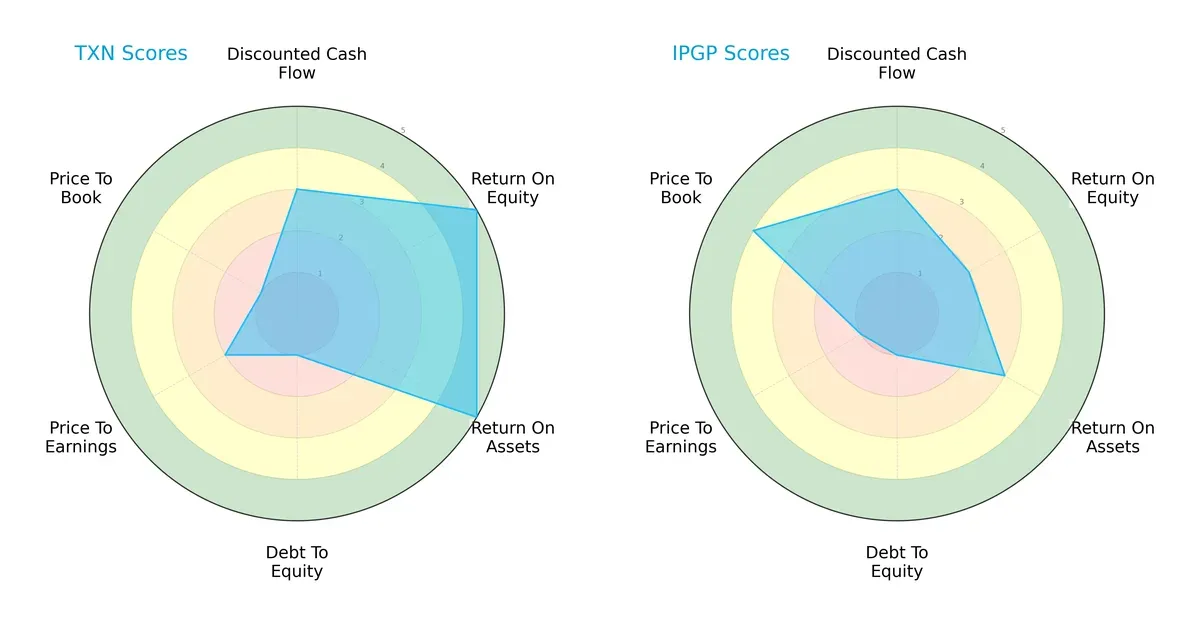
Texas Instruments dominates in profitability with very favorable ROE and ROA scores (5 each), while IPG Photonics lags with moderate to unfavorable returns. Both firms struggle equally with debt management, scoring very unfavorable (1) on debt-to-equity. Texas Instruments holds a slight edge in valuation discipline, despite unfavorable P/E and P/B scores, whereas IPG Photonics shows a favorable price-to-book score (4) but weak overall balance. Texas Instruments presents a more balanced profile, relying on operational efficiency, while IPG Photonics depends more on relative valuation advantages.
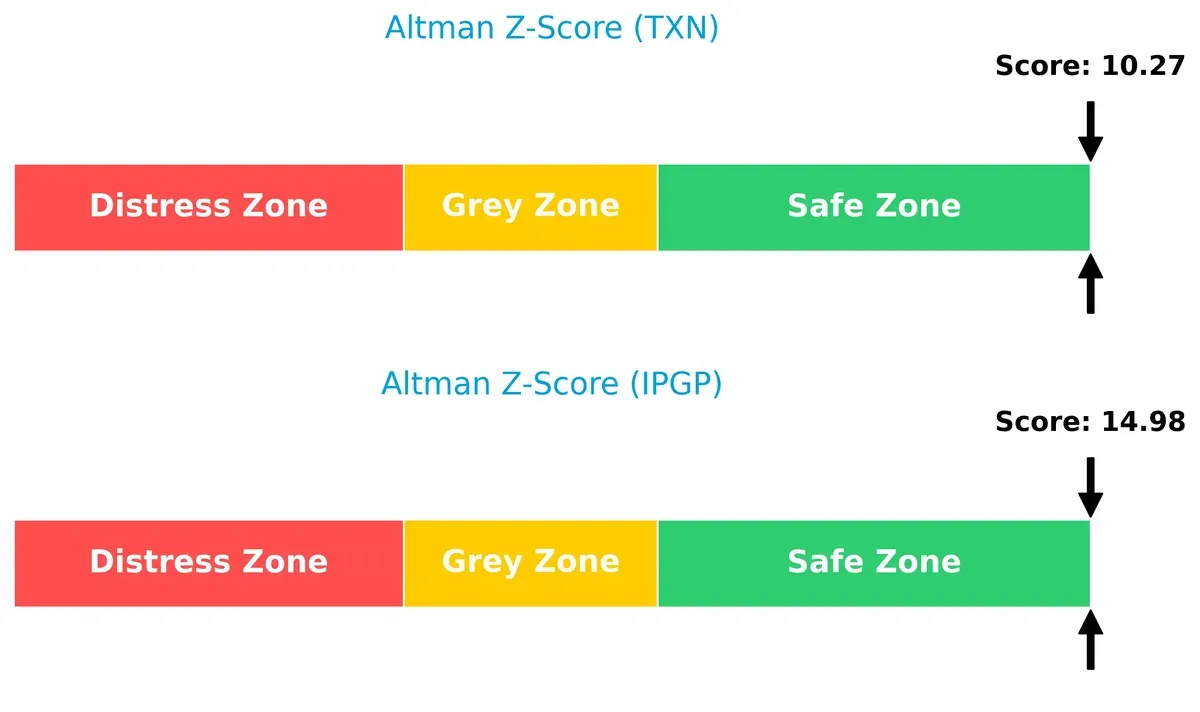
Bankruptcy Risk: Solvency Showdown
Texas Instruments’ Altman Z-Score of 10.3 versus IPG Photonics’ 15.0 places both firmly in the safe zone, indicating very low bankruptcy risk. This gap reflects Texas Instruments’ solid financial foundation and prudent capital structure, reassuring for long-term survival in volatile cycles:
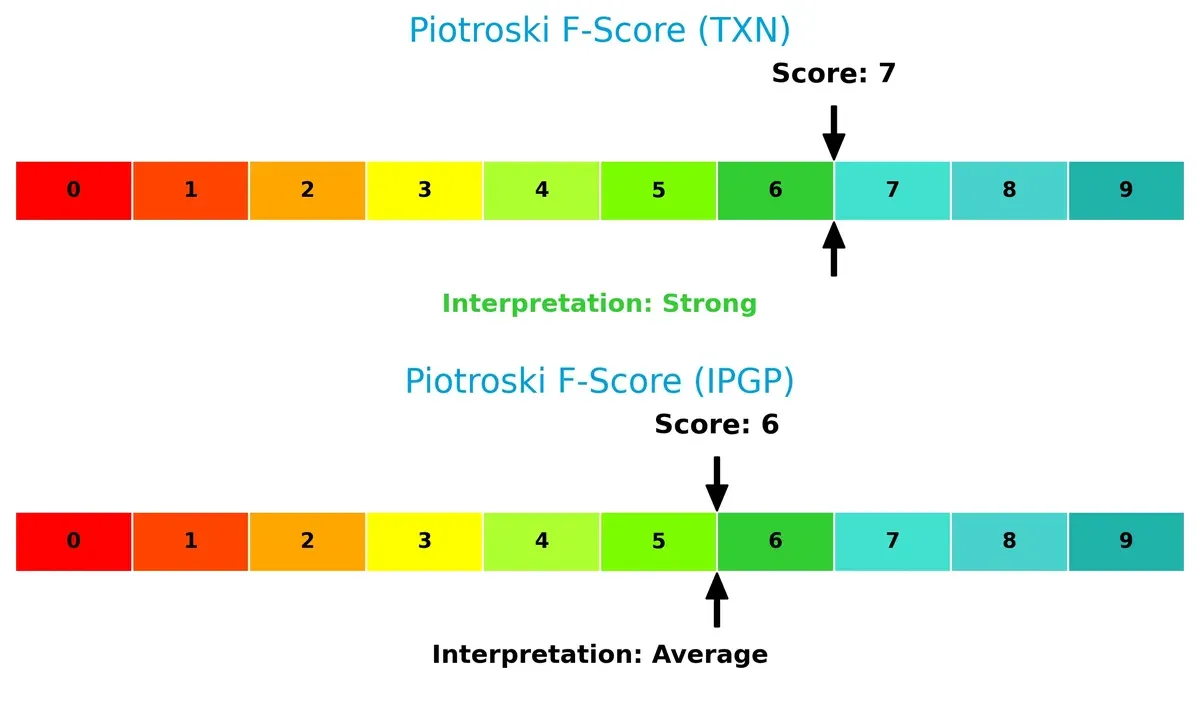
Financial Health: Quality of Operations
Texas Instruments scores a strong 7 on the Piotroski F-Score, signaling robust financial health and operational quality. IPG Photonics’ 6 reflects average health, with some internal metrics potentially raising caution. Texas Instruments clearly leads in internal financial strength and operational efficiency:
How are the two companies positioned?
This section dissects the operational DNA of Texas Instruments and IPG Photonics by comparing their revenue distribution and internal dynamics. The goal is to confront their economic moats to reveal which model offers the most resilient, sustainable competitive advantage today.
Revenue Segmentation: The Strategic Mix
The following visual comparison dissects how Texas Instruments and IPG Photonics diversify their income streams and where their primary sector bets lie:
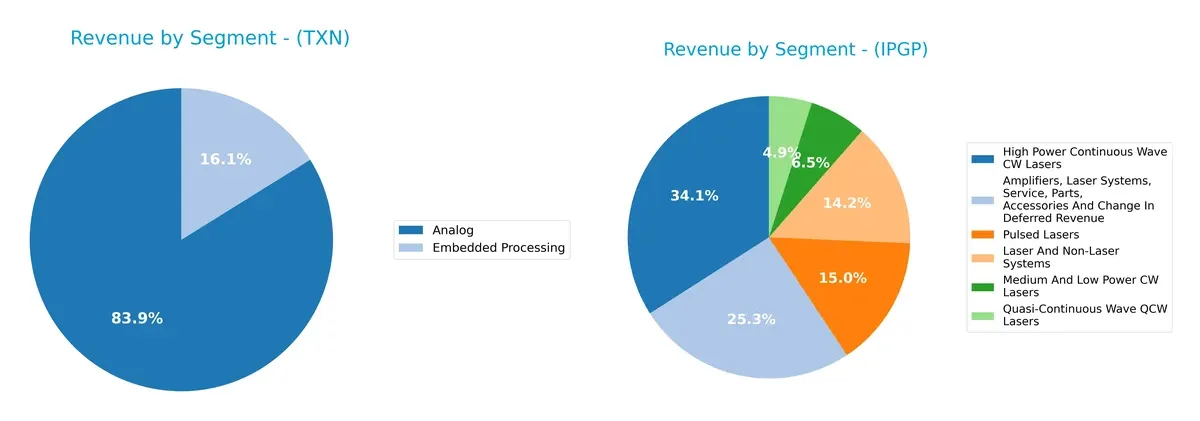
Texas Instruments anchors its revenue in Analog at $14B for 2025, with Embedded Processing at $2.7B, showing moderate diversification. In contrast, IPG Photonics relies heavily on High Power Continuous Wave Lasers at $333M in 2024, with smaller contributions from multiple laser types. TI’s broader base reduces concentration risk, while IPG’s focus signals niche dominance but heightens exposure to laser market cycles.
Strengths and Weaknesses Comparison
This table compares the Strengths and Weaknesses of Texas Instruments Incorporated and IPG Photonics Corporation:
TXN Strengths
- High net margin and ROE indicating strong profitability
- Favorable ROIC vs. WACC shows efficient capital allocation
- Diverse product segments including Analog and Embedded Processing
- Significant global presence with large US, China, and EMEA revenues
- Solid dividend yield supports shareholder returns
- Strong interest coverage ratio
IPGP Strengths
- Favorable debt metrics with zero debt and debt-to-assets
- High quick ratio indicates good short-term liquidity
- Diverse laser product portfolio across multiple categories
- Global presence including North America, China, and Europe
- Favorable price-to-book ratio suggests undervaluation
- Infinite interest coverage signals no debt risk
TXN Weaknesses
- Unfavorable high P/E and P/B ratios may imply overvaluation
- Current ratio flagged as unfavorable, possibly excess inventory or receivables
- Moderate debt level with neutral debt-to-assets ratio
- Asset turnover and fixed asset turnover only neutral
- Relatively concentrated revenue segments
IPGP Weaknesses
- Low net margin, ROE, and ROIC reflect weak profitability
- High P/E ratio suggests expensive valuation
- Current ratio unfavorable despite strong quick ratio
- No dividend yield limits income appeal
- Lower asset turnover compared to TXN
- More concentrated geographic revenue base
Both companies show clear strategic contrasts. TXN excels in profitability and capital efficiency but faces valuation and liquidity scrutiny. IPGP boasts strong balance sheet health and product diversity but struggles with profit generation and valuation. These profiles imply different risk-return trade-offs and strategic focus areas for investors.
The Moat Duel: Analyzing Competitive Defensibility
A structural moat is the only reliable shield protecting long-term profits from relentless competitive erosion:
Texas Instruments Incorporated: Robust Cost Advantage and Scale Moat
Texas Instruments leverages a strong cost advantage through massive scale and manufacturing efficiency. This manifests in stable 35%+ EBIT margins and 28% net margins. Expansion in analog and embedded processing markets in 2026 could deepen its moat despite a slight ROIC decline.
IPG Photonics Corporation: Niche Intangible Asset Moat
IPG Photonics relies on proprietary fiber laser technology and intellectual property, contrasting Texas Instruments’ scale moat. Its margins are thinner, around 3%, reflecting niche market positioning. The firm’s recent margin and EPS growth signals potential, but shrinking ROIC trends threaten long-term defensibility.
Scale Economies vs. Intellectual Property: The Moat Showdown
Texas Instruments possesses a wider and financially stronger moat, demonstrated by consistently high margins and positive value creation. IPG Photonics’ moat is narrower, with deteriorating ROIC posing a risk. Texas Instruments is better equipped to defend and grow market share through operational scale.
Which stock offers better returns?
The past year shows strong upward momentum for both stocks, with Texas Instruments and IPG Photonics exhibiting notable price gains and accelerating bullish trends.
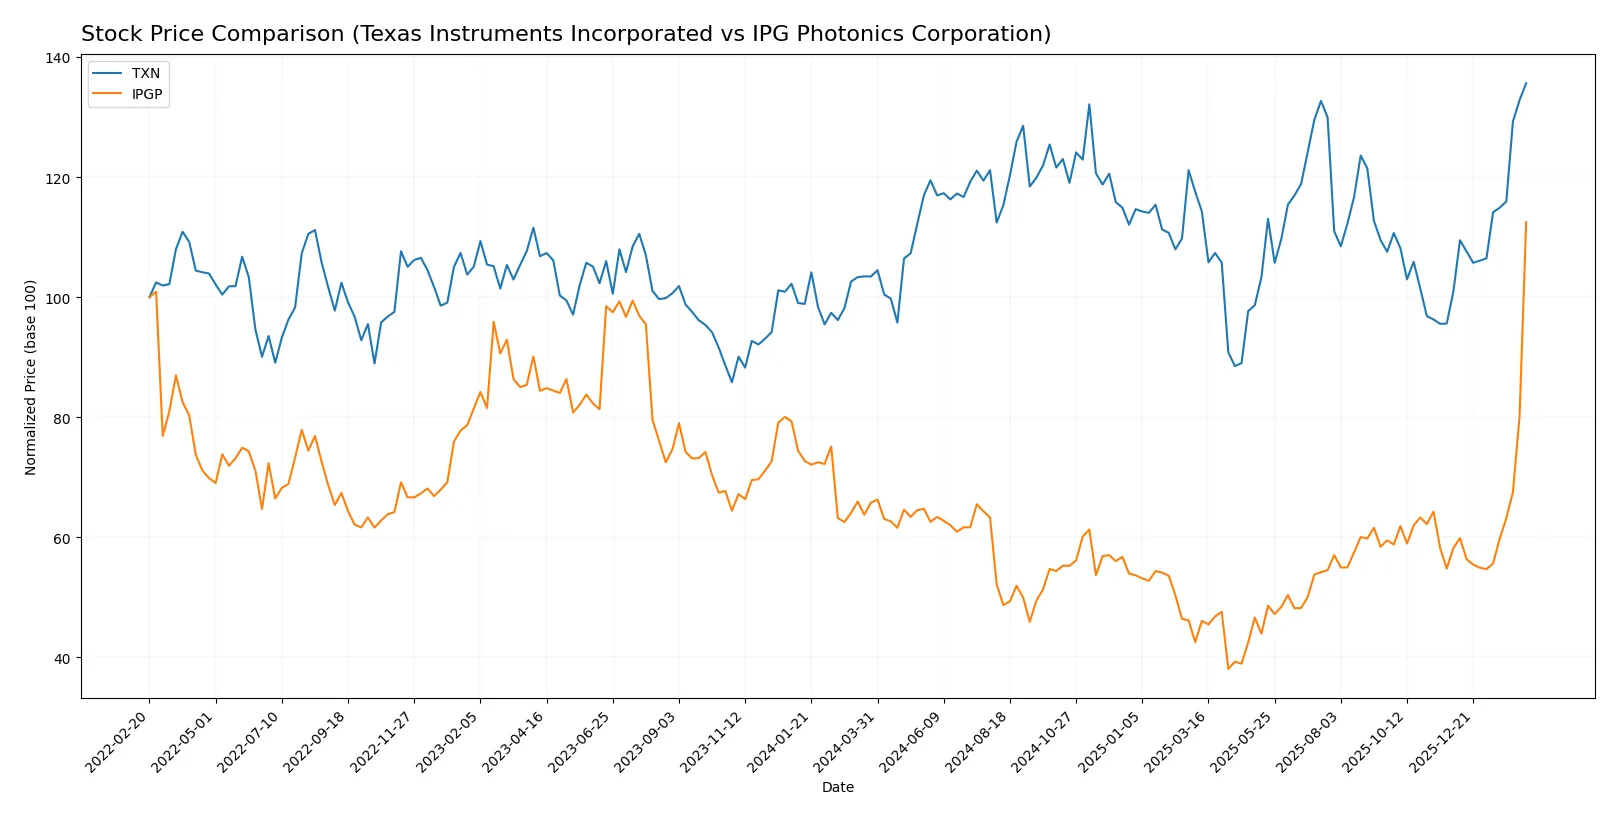
Trend Comparison
Texas Instruments’ stock rose 31.12% over the past year, showing a bullish trend with acceleration. Price ranged from 147.6 to 226.16, and volatility measured by 16.56% std deviation.
IPG Photonics gained 71.01% over the same period, also bullish with acceleration. It recorded a wider price range from 52.12 to 153.91 and lower volatility at 12.46% std deviation.
IPG Photonics delivered the highest market performance, nearly doubling Texas Instruments’ gains, despite slightly higher recent volatility.
Target Prices
Analysts present a balanced target consensus for Texas Instruments and IPG Photonics, reflecting moderate upside potential.
| Company | Target Low | Target High | Consensus |
|---|---|---|---|
| Texas Instruments Incorporated | 160 | 260 | 204.64 |
| IPG Photonics Corporation | 110 | 180 | 151.67 |
The consensus targets suggest Texas Instruments trades near the upper range, implying limited near-term upside. IPG Photonics’ consensus aligns closely with its current price, indicating a market expectation of stable valuation.

Don’t Let Luck Decide Your Entry Point
Optimize your entry points with our advanced ProRealTime indicators. You’ll get efficient buy signals with precise price targets for maximum performance. Start outperforming now!
How do institutions grade them?
Texas Instruments Incorporated Grades
The table below summarizes recent institutional grades for Texas Instruments Incorporated:
| Grading Company | Action | New Grade | Date |
|---|---|---|---|
| Rosenblatt | Maintain | Buy | 2026-02-05 |
| Mizuho | Maintain | Underperform | 2026-01-28 |
| Keybanc | Maintain | Overweight | 2026-01-28 |
| Goldman Sachs | Maintain | Sell | 2026-01-28 |
| B of A Securities | Upgrade | Neutral | 2026-01-28 |
| Cantor Fitzgerald | Maintain | Neutral | 2026-01-28 |
| Rosenblatt | Maintain | Buy | 2026-01-28 |
| JP Morgan | Maintain | Overweight | 2026-01-28 |
| Benchmark | Maintain | Buy | 2026-01-28 |
| Truist Securities | Maintain | Hold | 2026-01-28 |
IPG Photonics Corporation Grades
The following table shows recent institutional grades for IPG Photonics Corporation:
| Grading Company | Action | New Grade | Date |
|---|---|---|---|
| Stifel | Maintain | Buy | 2026-02-13 |
| Raymond James | Downgrade | Outperform | 2026-02-13 |
| Roth Capital | Maintain | Buy | 2026-02-03 |
| Citigroup | Upgrade | Buy | 2025-11-05 |
| Bernstein | Upgrade | Outperform | 2025-08-07 |
| Raymond James | Maintain | Strong Buy | 2025-05-07 |
| CL King | Upgrade | Buy | 2025-03-18 |
| Citigroup | Maintain | Sell | 2025-02-18 |
| Needham | Maintain | Hold | 2025-02-12 |
| Stifel | Maintain | Buy | 2025-02-12 |
Which company has the best grades?
IPG Photonics holds generally stronger grades, including multiple Buy and Outperform ratings with some upgrades. Texas Instruments shows a mixed profile with Buy and Underperform ratings. Investors might view IPG as more favored by analysts currently.
Risks specific to each company
The following categories identify the critical pressure points and systemic threats facing both Texas Instruments Incorporated and IPG Photonics Corporation in the 2026 market environment:
1. Market & Competition
Texas Instruments Incorporated
- Dominates analog and embedded semiconductor segments with strong industrial and automotive exposure. Faces competition from diversified chipmakers.
IPG Photonics Corporation
- Operates in niche high-performance fiber laser market with fewer direct competitors but limited scale. Faces innovation pressure.
2. Capital Structure & Debt
Texas Instruments Incorporated
- Moderate debt levels with a D/E of 0.95; interest coverage strong at 11.52x. Balanced leverage but watch debt-to-assets at 44.5%.
IPG Photonics Corporation
- No debt on balance sheet, leading to a pristine financial risk profile. Interest coverage infinite, signaling no debt service burden.
3. Stock Volatility
Texas Instruments Incorporated
- Beta near 1.0 (0.995) indicates market-level volatility, typical for large-cap semiconductor firm.
IPG Photonics Corporation
- Slightly higher beta at 1.03, reflecting greater sensitivity to market swings, likely due to smaller size and niche focus.
4. Regulatory & Legal
Texas Instruments Incorporated
- Exposure to global semiconductor regulations and export controls, especially with automotive and industrial clients.
IPG Photonics Corporation
- Faces regulatory scrutiny in laser exports and telecommunications equipment, but less diversified regulatory risk.
5. Supply Chain & Operations
Texas Instruments Incorporated
- Large-scale manufacturing with complex supply chains, exposed to semiconductor material shortages and geopolitical tensions.
IPG Photonics Corporation
- More specialized supply chain for fiber lasers; less volume but high dependence on precision components and materials.
6. ESG & Climate Transition
Texas Instruments Incorporated
- Increasing ESG initiatives in energy-efficient products and manufacturing; pressure to reduce carbon footprint in global operations.
IPG Photonics Corporation
- Emerging ESG programs; smaller footprint but dependent on energy-intensive manufacturing processes and raw materials sourcing.
7. Geopolitical Exposure
Texas Instruments Incorporated
- Significant global footprint with exposure to US-China trade tensions impacting semiconductor sales and supply chains.
IPG Photonics Corporation
- Primarily US-based with international sales; less direct exposure but sensitive to export controls and supply disruptions.
Which company shows a better risk-adjusted profile?
Texas Instruments faces significant competitive and geopolitical risks but benefits from a strong capital structure and robust profitability. IPG Photonics’s lack of debt and niche market lessen financial risks, but weak margins and high valuation multiples amplify operational and market risks. I see Texas Instruments as having the more balanced risk-adjusted profile due to its diversified earnings, better profitability (28.3% net margin vs. 3.1%), and strong Altman Z-score, despite leverage concerns. IPG’s single biggest risk is poor profitability under high valuation pressure. Texas Instruments must manage geopolitical and supply chain risks carefully in 2026.
Final Verdict: Which stock to choose?
Texas Instruments stands out as a cash-generating powerhouse with a robust economic moat. Its strength lies in efficient capital allocation and solid profitability despite a slight decline in return on invested capital. Vigilance is warranted around its elevated valuation multiples and working capital structure. It suits portfolios focused on steady, long-term growth.
IPG Photonics offers a strategic moat through niche technology in photonics, supported by a pristine balance sheet with zero debt. Its safety profile eclipses Texas Instruments, though profitability metrics remain subdued. This stock appeals to investors prioritizing innovation with a moderate appetite for risk and a focus on future potential.
If you prioritize durable value creation and consistent cash flow, Texas Instruments is the compelling choice due to its established moat and operational efficiency. However, if you seek growth fueled by technological innovation and superior balance sheet safety, IPG Photonics offers better stability and upside potential, albeit with higher execution risk.
Disclaimer: Investment carries a risk of loss of initial capital. The past performance is not a reliable indicator of future results. Be sure to understand risks before making an investment decision.
Go Further
I encourage you to read the complete analyses of Texas Instruments Incorporated and IPG Photonics Corporation to enhance your investment decisions: