Home > Comparison > Technology > TER vs IPGP
The strategic rivalry between Teradyne, Inc. and IPG Photonics Corporation shapes the semiconductor industry’s evolution. Teradyne operates as a capital-intensive test equipment manufacturer with diverse segments including industrial automation. IPG Photonics specializes in high-performance fiber lasers and amplifiers, focusing on materials processing and communications. This analysis pits Teradyne’s broad technology platform against IPG’s specialized laser prowess to identify which offers the superior risk-adjusted return for a diversified portfolio in 2026.
Table of contents
Companies Overview
Teradyne and IPG Photonics stand as pivotal players in the semiconductor technology landscape, each commanding distinct niches with global reach.
Teradyne, Inc.: Automatic Test Equipment Leader
Teradyne dominates semiconductor test equipment with products for wafer and device package testing across automotive, communications, and cloud computing sectors. Its revenue stems from four segments: Semiconductor Test, System Test, Industrial Automation, and Wireless Test. In 2026, Teradyne emphasizes expanding industrial automation via advanced robotics and enhancing wireless test solutions for evolving 5G technologies.
IPG Photonics Corporation: High-Performance Fiber Laser Innovator
IPG Photonics leads in fiber laser and amplifier technology, serving materials processing, communications, and medical applications. Its core revenue derives from selling high-power fiber lasers and integrated laser systems worldwide. The company focuses this year on advancing laser precision and expanding multi-axis cutting and welding solutions to meet growing industrial demand.
Strategic Collision: Similarities & Divergences
Teradyne adopts a broad portfolio approach spanning testing and automation, while IPG Photonics specializes in laser technologies. Their primary battleground lies in industrial automation and manufacturing efficiency, where Teradyne’s robotic systems and IPG’s precision lasers intersect. Investors face contrasting profiles: Teradyne offers diversified exposure to semiconductor testing and automation, whereas IPG presents a concentrated play on high-value laser innovation.
Income Statement Comparison
This data dissects the core profitability and scalability of both corporate engines to reveal who dominates the bottom line:
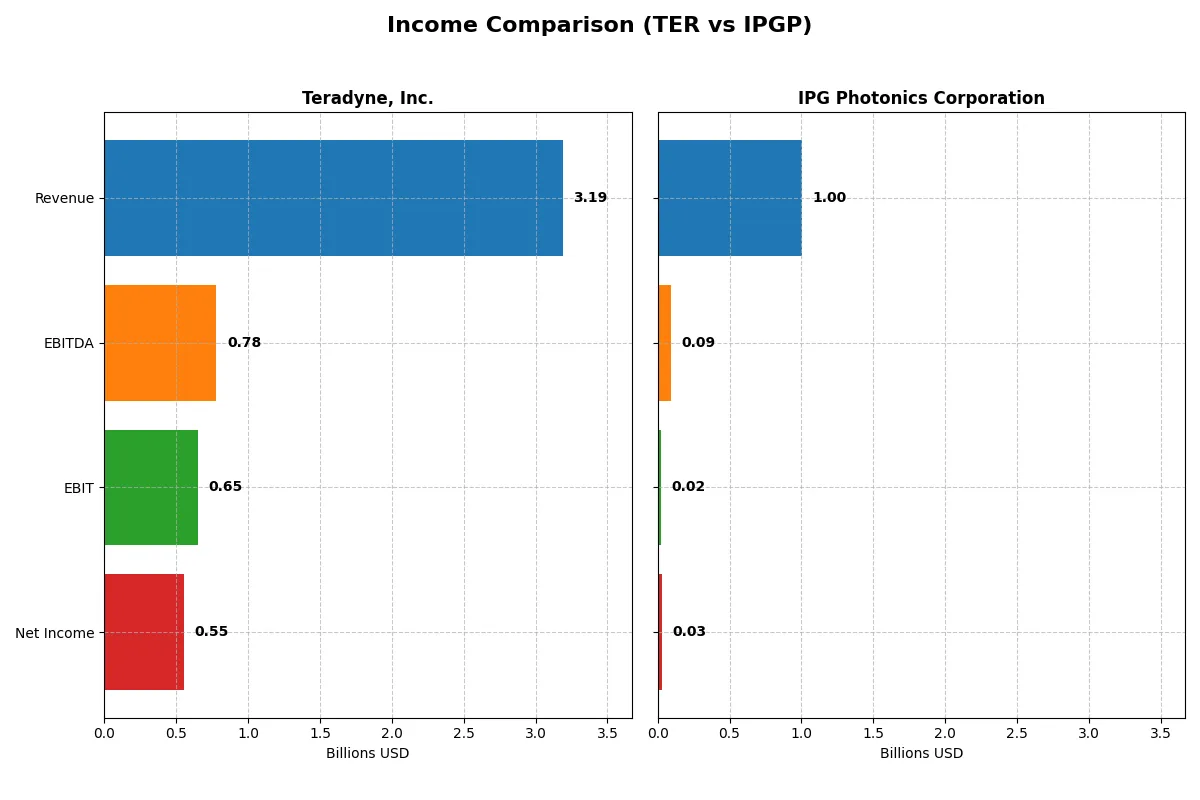
| Metric | Teradyne, Inc. (TER) | IPG Photonics Corporation (IPGP) |
|---|---|---|
| Revenue | 3.19B | 1.00B |
| Cost of Revenue | 1.32B | 622M |
| Operating Expenses | 1.17B | 368M |
| Gross Profit | 1.87B | 381M |
| EBITDA | 780M | 90M |
| EBIT | 653M | 23M |
| Interest Expense | 8.0M | 0 |
| Net Income | 554M | 31M |
| EPS | 3.49 | 0.73 |
| Fiscal Year | 2025 | 2025 |
Income Statement Analysis: The Bottom-Line Duel
This income statement comparison exposes the true operational efficiency and profitability dynamics driving each company’s financial engine.
Teradyne, Inc. Analysis
Teradyne’s revenue grew steadily from 2.7B in 2023 to 3.2B in 2025, reflecting strong market demand. Its gross margin holds firm at 58.5%, underscoring robust cost control. The net margin at 17.4% in 2025 signals healthy profitability despite a slight decline. Operating income increased to 693M in 2025, showing solid momentum and operational efficiency.
IPG Photonics Corporation Analysis
IPG’s revenue slipped from 1.47B in 2021 to 1.0B in 2025, indicating top-line contraction. Its gross margin at 38.0% remains modest but stable. The net margin of 3.1% in 2025 reflects thin profitability, yet the company achieved a sharp rebound in net income to 31M after losses in 2024. EBIT margin improved to 2.3%, signaling operating recovery but still low efficiency overall.
Verdict: Margin Power vs. Revenue Scale
Teradyne dominates with higher margins and stronger revenue growth, consistently converting sales into profit. IPG shows signs of recovery but remains constrained by lower margins and shrinking sales. For investors prioritizing operational strength and profitability, Teradyne’s profile offers a more compelling fundamental foundation.
Financial Ratios Comparison
These vital ratios act as a diagnostic tool to expose the underlying fiscal health, valuation premiums, and capital efficiency of the companies analyzed:
| Ratios | Teradyne, Inc. (TER) | IPG Photonics Corporation (IPGP) |
|---|---|---|
| ROE | 19.8% | 1.5% |
| ROIC | 18.4% | 0.4% |
| P/E | 54.6 | 98.1 |
| P/B | 10.8 | 1.4 |
| Current Ratio | 1.76 | 6.08 |
| Quick Ratio | 1.41 | 4.74 |
| D/E (Debt-to-Equity) | 0.12 | 0.00 |
| Debt-to-Assets | 8.3% | 0.0% |
| Interest Coverage | 86.4 | 0 |
| Asset Turnover | 0.76 | 0.41 |
| Fixed Asset Turnover | 4.99 | 1.57 |
| Payout ratio | 13.8% | 0% |
| Dividend yield | 0.25% | 0% |
| Fiscal Year | 2025 | 2025 |
Efficiency & Valuation Duel: The Vital Signs
Financial ratios act as a company’s DNA, unveiling hidden risks and operational strengths that shape investor decisions.
Teradyne, Inc.
Teradyne shows strong profitability with a 19.8% ROE and a healthy 17.4% net margin, reflecting operational excellence. However, its valuation is stretched, with a P/E of 54.6 and P/B of 10.8, signaling premium pricing. The company offers modest dividends and focuses heavily on R&D, fueling sustainable growth.
IPG Photonics Corporation
IPG Photonics struggles with low profitability: a 1.5% ROE and 3.1% net margin indicate operational challenges. Its valuation is even more stretched, with a P/E near 98, despite a low P/B of 1.43. The firm pays no dividends, reinvesting in R&D amid weaker returns and efficiency metrics.
Premium Valuation vs. Operational Safety
Teradyne balances solid returns and innovation despite a rich valuation, while IPG Photonics faces profitability and efficiency headwinds at a higher price multiple. Investors seeking operational safety may prefer Teradyne; those tolerant of risk might consider IPG’s turnaround potential.
Which one offers the Superior Shareholder Reward?
I compare Teradyne, Inc. (TER) and IPG Photonics Corporation (IPGP) on distribution strategy, dividend yield, payout ratio, and buyback intensity. TER pays a modest dividend yield around 0.3% with a payout ratio near 14%, supported by strong free cash flow coverage above 2. TER also executes consistent buybacks, fueling total return. IPGP pays no dividend and struggles with negative or thin free cash flow, limiting buybacks. IPGP reinvests heavily in R&D and capex, but its low margins and volatile profits challenge sustainability. Historically, TER’s balanced dividends and buybacks offer more reliable long-term shareholder value. I conclude TER delivers a superior total return profile for 2026 investors.
Comparative Score Analysis: The Strategic Profile
The radar chart reveals the fundamental DNA and trade-offs of Teradyne, Inc. and IPG Photonics Corporation, highlighting their core financial strengths and valuation nuances:
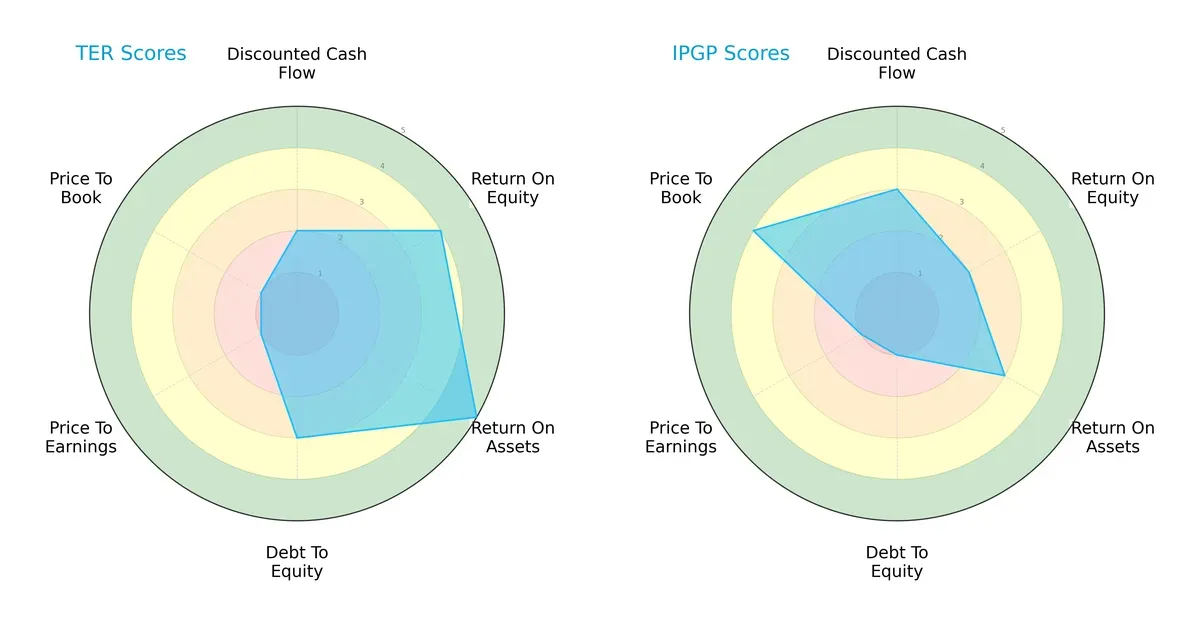
Teradyne shows a balanced profile with strong ROE (4) and ROA (5) scores, signaling efficient profit generation and asset use. Its debt-to-equity (3) is moderate, but valuation metrics (P/E and P/B at 1 each) flag potential overvaluation concerns. IPG Photonics relies on a valuation edge with a favorable P/B score (4), but weaker operational metrics (ROE 2, ROA 3) and a very unfavorable debt-to-equity score (1) raise financial risk flags. Teradyne’s profile is more stable, while IPG’s strength lies in its relative valuation.
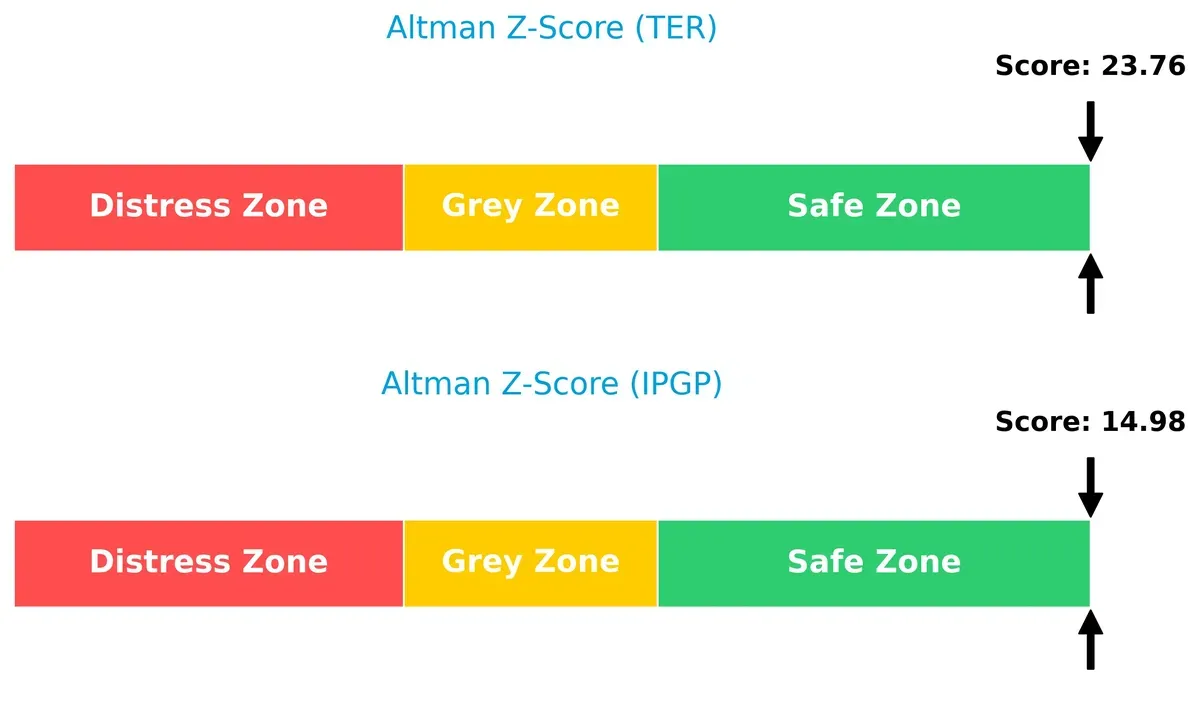
Bankruptcy Risk: Solvency Showdown
Teradyne’s Altman Z-Score (23.76) significantly outpaces IPG Photonics (14.98), both deep in the safe zone, which suggests superior long-term solvency and resilience for Teradyne in this cycle:
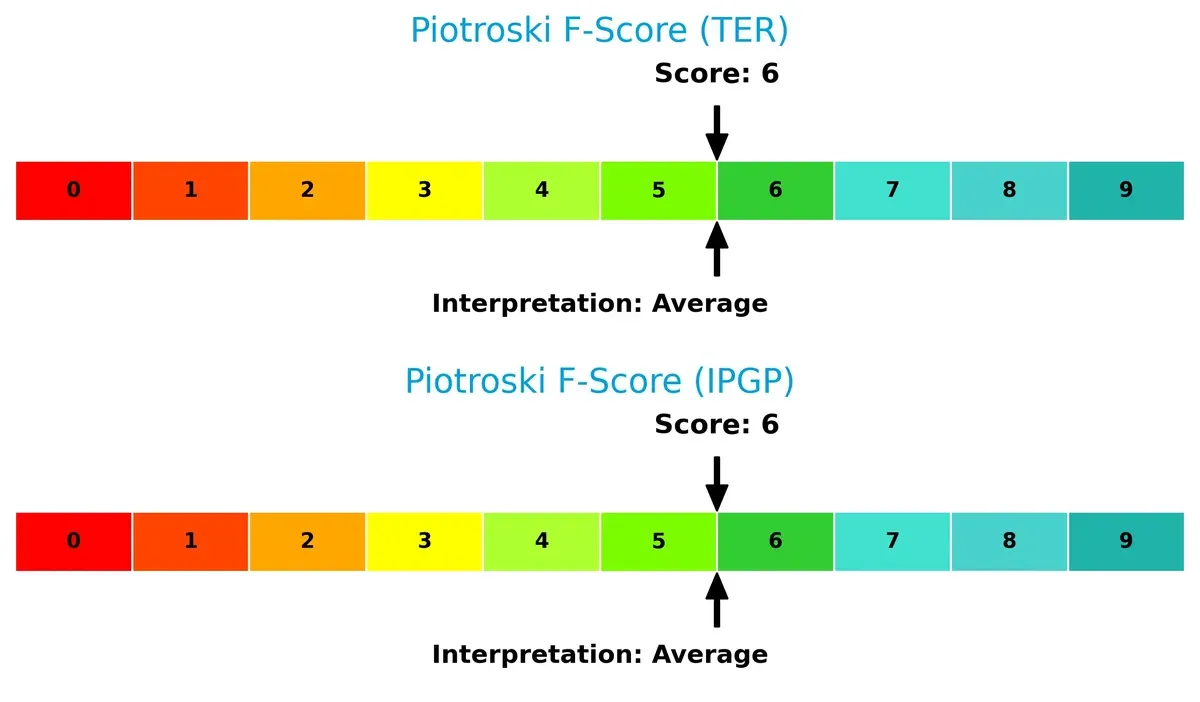
Financial Health: Quality of Operations
Both companies share an average Piotroski F-Score of 6, indicating moderate financial health without red flags. Neither firm exhibits peak operational quality, but neither shows critical internal weaknesses relative to the other:
How are the two companies positioned?
This section dissects the operational DNA of Teradyne and IPG Photonics by comparing their revenue distribution and internal dynamics. It aims to confront their economic moats to reveal which model offers the most resilient, sustainable advantage today.
Revenue Segmentation: The Strategic Mix
This comparison dissects how Teradyne and IPG Photonics diversify their income streams and where their primary sector bets lie:
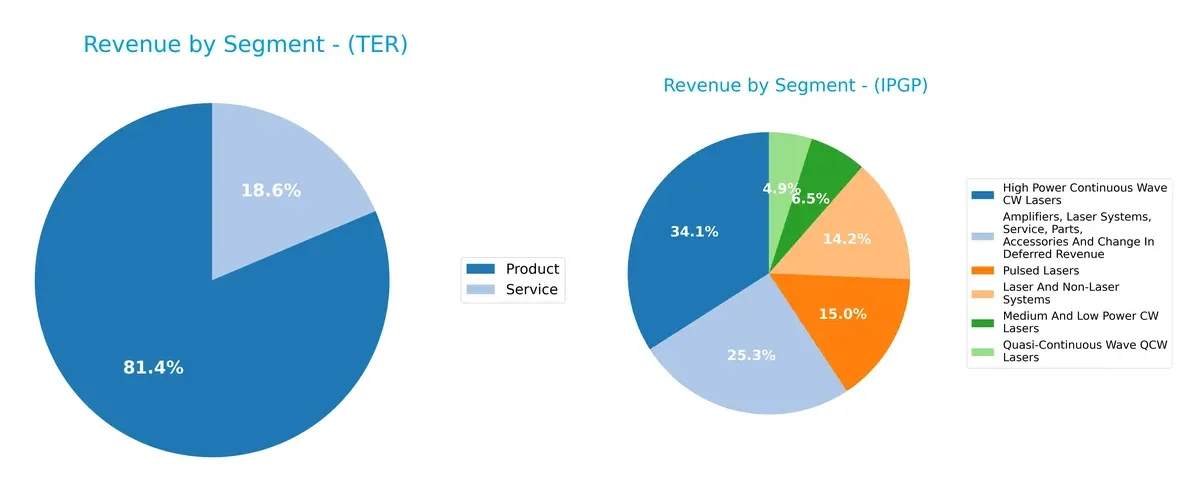
Teradyne anchors 2024 revenue heavily in Product sales at $2.3B, with Services at $525M, showing moderate diversification. IPG Photonics spreads its $1.0B across multiple laser systems, with High Power CW Lasers leading at $333M. Teradyne’s concentration on products signals infrastructure dominance but raises concentration risk. In contrast, IPG’s varied laser portfolio reduces reliance on one segment, enhancing resilience amid market shifts.
Strengths and Weaknesses Comparison
This table compares the Strengths and Weaknesses of Teradyne, Inc. and IPG Photonics Corporation:
Teradyne, Inc. Strengths
- High profitability with net margin at 17.37%
- Strong ROE at 19.82% and ROIC at 18.45%
- Low debt levels with debt-to-assets at 8.32%
- Favorable liquidity ratios (current 1.76, quick 1.41)
- Diversified product and service revenue streams over $2.8B
- Broad global presence including strong Taiwan and Korea markets
IPG Photonics Corporation Strengths
- Very low debt with zero debt-to-assets and infinite interest coverage
- Favorable quick ratio at 4.74 indicating liquidity
- Market presence in high power and pulsed laser systems
- Diversified revenue across multiple laser categories
- Solid geographic diversification including North America, Europe, and Asia
- Price-to-book favorable at 1.43 indicating potential asset value
Teradyne, Inc. Weaknesses
- Elevated valuation multiples with PE at 54.64 and PB at 10.83
- WACC above ROIC at 12.14%, risking value destruction
- Low dividend yield at 0.25% may deter income investors
- Asset turnover neutral at 0.76, suggesting moderate efficiency
- Some geographic revenue variability with exposure to volatile Asian markets
- Slightly unfavorable debt cost with WACC higher than ideal
IPG Photonics Corporation Weaknesses
- Low profitability with net margin at 3.1%, ROE at 1.46%, and ROIC at 0.41%
- High PE multiple at 98.08, implying stretched valuation
- Current ratio unusually high at 6.08, possibly indicating inefficient working capital
- Lower fixed asset turnover at 1.57, reflecting asset utilization challenges
- Zero dividend yield limits income appeal
- Slightly unfavorable global ratios evaluation suggesting operational challenges
Teradyne exhibits strong profitability and disciplined capital structure but faces valuation and cost of capital concerns. IPG Photonics maintains excellent balance sheet strength but struggles with profitability and operational efficiency, suggesting strategic focus areas differ materially.
The Moat Duel: Analyzing Competitive Defensibility
A structural moat is the only lasting shield that protects a company’s profits from relentless competitive erosion:
Teradyne, Inc.: Diversified Testing Powerhouse
Teradyne’s moat springs from its broad product portfolio and deep customer integration, reflected in a strong 20.5% EBIT margin and stable gross margin near 58.5%. Despite a declining ROIC trend, its market reach in semiconductor and automation testing bodes well for innovation-led moat reinforcement in 2026.
IPG Photonics Corporation: Specialized Laser Innovator
IPG Photonics relies on proprietary fiber laser technology and high barriers to entry, but its current ROIC lags below WACC, signaling value destruction. The company’s margin recovery and revenue growth in 2025 hint at a potential turnaround, yet its narrow product focus leaves it vulnerable compared to Teradyne’s diversified moat.
Moat Breadth vs. Technology Specialty: Teradyne vs. IPG Photonics
Teradyne’s wider moat benefits from diversified revenue streams and consistent value creation, despite some profitability erosion. IPG’s deeper but narrower moat struggles with declining ROIC and value destruction. Teradyne stands better positioned to defend and expand market share in 2026.
Which stock offers better returns?
Both Teradyne, Inc. and IPG Photonics Corporation show strong price gains over the past year, with distinct acceleration patterns and varying volatility in their trading dynamics.
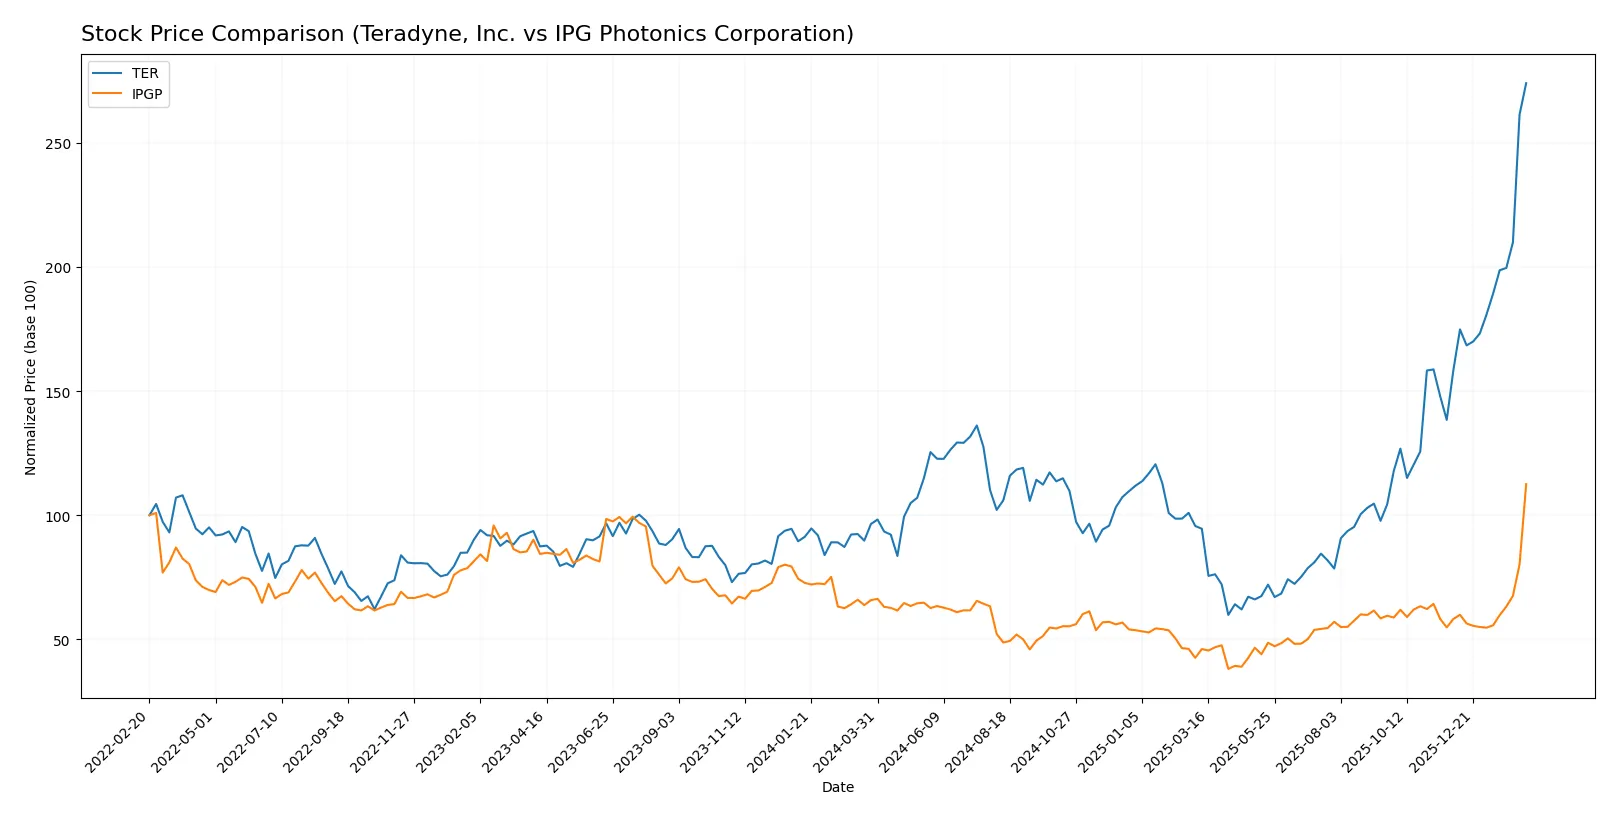
Trend Comparison
Teradyne, Inc. exhibits a bullish trend with a 184.12% price increase over 12 months, accelerating notably from late 2025 to early 2026, despite high volatility at 44.39% standard deviation.
IPG Photonics Corporation also shows a bullish trend with a 71.01% gain over 12 months, accelerating recently with a lower volatility of 12.46%, reflecting steadier price movement.
Teradyne’s price appreciation significantly outpaces IPG Photonics’, delivering the highest market performance with stronger acceleration and greater buyer dominance in volume.
Target Prices
Analysts present a broad but constructive consensus on Teradyne, Inc. and IPG Photonics Corporation.
| Company | Target Low | Target High | Consensus |
|---|---|---|---|
| Teradyne, Inc. | 175 | 335 | 277.58 |
| IPG Photonics | 110 | 180 | 151.67 |
Teradyne’s consensus target of 277.58 sits below its current price of 314.66, signaling cautious optimism. IPG Photonics’ target of 151.67 aligns closely with its current price of 153.91, reflecting balanced expectations.

Don’t Let Luck Decide Your Entry Point
Optimize your entry points with our advanced ProRealTime indicators. You’ll get efficient buy signals with precise price targets for maximum performance. Start outperforming now!
How do institutions grade them?
The following tables summarize recent institutional grades for Teradyne, Inc. and IPG Photonics Corporation:
Teradyne, Inc. Grades
This table displays recent grades from major financial institutions for Teradyne, Inc.
| Grading Company | Action | New Grade | Date |
|---|---|---|---|
| Stifel | Maintain | Buy | 2026-02-04 |
| Citigroup | Maintain | Buy | 2026-02-04 |
| Cantor Fitzgerald | Maintain | Overweight | 2026-02-04 |
| Evercore ISI Group | Maintain | Outperform | 2026-02-04 |
| Goldman Sachs | Maintain | Buy | 2026-02-04 |
| Evercore ISI Group | Maintain | Outperform | 2026-02-03 |
| Cantor Fitzgerald | Maintain | Overweight | 2026-02-02 |
| Stifel | Maintain | Buy | 2026-01-30 |
| UBS | Maintain | Buy | 2026-01-26 |
| B of A Securities | Maintain | Buy | 2026-01-22 |
IPG Photonics Corporation Grades
This table presents recent grades from established financial institutions for IPG Photonics Corporation.
| Grading Company | Action | New Grade | Date |
|---|---|---|---|
| Stifel | Maintain | Buy | 2026-02-13 |
| Raymond James | Downgrade | Outperform | 2026-02-13 |
| Roth Capital | Maintain | Buy | 2026-02-03 |
| Citigroup | Upgrade | Buy | 2025-11-05 |
| Bernstein | Upgrade | Outperform | 2025-08-07 |
| Raymond James | Maintain | Strong Buy | 2025-05-07 |
| CL King | Upgrade | Buy | 2025-03-18 |
| Citigroup | Maintain | Sell | 2025-02-18 |
| Needham | Maintain | Hold | 2025-02-12 |
| Stifel | Maintain | Buy | 2025-02-12 |
Which company has the best grades?
Teradyne holds consistently positive grades, mainly “Buy” and “Outperform” from top-tier firms. IPG Photonics shows a more mixed profile, including a recent downgrade and a “Sell” grade from Citigroup in early 2025. Teradyne’s steadier positive sentiment may reflect stronger institutional confidence and potentially lower perceived risk.
Risks specific to each company
The following categories identify critical pressure points and systemic threats facing Teradyne, Inc. and IPG Photonics Corporation in the 2026 market environment:
1. Market & Competition
Teradyne, Inc.
- Dominates semiconductor test equipment with diverse segments; faces intense competition in automation and wireless test.
IPG Photonics Corporation
- Specializes in fiber lasers with niche applications; confronts competition in fiber laser innovation and materials processing.
2. Capital Structure & Debt
Teradyne, Inc.
- Maintains low debt-to-equity (0.12) and strong interest coverage (81.43), signaling financial stability.
IPG Photonics Corporation
- Operates with zero debt, no interest burden, but unusually high current ratio (6.08) may indicate inefficient capital use.
3. Stock Volatility
Teradyne, Inc.
- High beta (1.82) implies greater sensitivity to market swings, increasing risk for volatility-averse investors.
IPG Photonics Corporation
- Beta near 1.03 suggests moderate volatility, closer to market average, offering steadier price movements.
4. Regulatory & Legal
Teradyne, Inc.
- Operates globally in regulated semiconductor and defense markets, exposing it to export controls and compliance costs.
IPG Photonics Corporation
- Faces regulatory scrutiny in advanced laser technologies and communications sectors, with potential export restrictions.
5. Supply Chain & Operations
Teradyne, Inc.
- Relies on complex semiconductor supply chains; vulnerable to chip shortages and manufacturing delays.
IPG Photonics Corporation
- Depends on specialized fiber optic components; supply disruptions could delay production of laser systems.
6. ESG & Climate Transition
Teradyne, Inc.
- Increasing pressure to reduce manufacturing emissions and implement sustainable industrial automation solutions.
IPG Photonics Corporation
- Faces challenges reducing energy consumption and environmental impact in fiber laser production processes.
7. Geopolitical Exposure
Teradyne, Inc.
- Global footprint subjects it to trade tensions, especially US-China semiconductor rivalry risks.
IPG Photonics Corporation
- Export of sensitive laser technology may face geopolitical restrictions affecting key markets.
Which company shows a better risk-adjusted profile?
Teradyne’s most impactful risk lies in volatile market exposure due to its high beta and competitive pressure. IPG Photonics struggles primarily with weak profitability margins and inefficient capital use reflected by elevated current ratio. Teradyne’s robust balance sheet and stronger returns give it a superior risk-adjusted profile. Notably, Teradyne’s interest coverage ratio of 81.43 underscores its financial resilience despite market swings, while IPG’s net margin of 3.1% and ROE of 1.46% highlight profitability concerns that warrant caution.
Final Verdict: Which stock to choose?
Teradyne, Inc. wields a powerful cash conversion engine, driven by strong returns on invested capital that outpace its cost of capital. Its main point of vigilance lies in a declining ROIC trend, signaling the need for close monitoring of profitability sustainability. It suits portfolios aiming for aggressive growth with a tolerance for cyclical swings.
IPG Photonics Corporation boasts a strategic moat in its balance sheet safety and liquidity, underpinned by negligible debt and robust current ratios. However, its low and declining profitability metrics suggest value erosion risks. This stock fits investors seeking GARP profiles who prioritize balance sheet strength over immediate earnings power.
If you prioritize enduring profitability and capital efficiency, Teradyne outshines with superior value creation despite some margin erosion. However, if you seek financial stability and lower leverage as a hedge, IPG Photonics offers better balance sheet safety but with compromised earnings quality. Each scenario demands vigilance on distinct risk fronts.
Disclaimer: Investment carries a risk of loss of initial capital. The past performance is not a reliable indicator of future results. Be sure to understand risks before making an investment decision.
Go Further
I encourage you to read the complete analyses of Teradyne, Inc. and IPG Photonics Corporation to enhance your investment decisions: