Home > Comparison > Technology > STM vs IPGP
The strategic rivalry between STMicroelectronics N.V. and IPG Photonics Corporation shapes the semiconductor sector’s evolution. STMicroelectronics operates as a diversified semiconductor giant with a broad product portfolio spanning automotive and industrial markets. In contrast, IPG Photonics specializes in high-margin fiber laser technologies focused on materials processing and communications. This analysis will assess which company’s distinct operational model offers superior risk-adjusted growth potential for diversified investors in 2026.
Table of contents
Companies Overview
STMicroelectronics and IPG Photonics hold pivotal roles in the semiconductor space, shaping technology across diverse industries.
STMicroelectronics N.V.: Semiconductor Powerhouse
STMicroelectronics dominates as a global semiconductor manufacturer. It generates revenue through diversified segments: automotive ICs, analog and MEMS sensors, and microcontrollers. Its 2026 strategy emphasizes innovation in automotive electronics and expanding industrial applications, leveraging integrated solutions that address complex market demands.
IPG Photonics Corporation: Laser Technology Leader
IPG Photonics excels in high-performance fiber laser systems. Its revenue stems from advanced fiber lasers, amplifiers, and integrated systems for materials processing and communications. The company’s 2026 focus targets scaling fiber laser adoption in manufacturing and telecommunications, pushing precision and energy efficiency in industrial laser technologies.
Strategic Collision: Similarities & Divergences
Both companies operate in technology-driven semiconductor niches but diverge in core philosophies: STMicroelectronics pursues broad semiconductor integration, while IPG Photonics specializes in laser-centric components. They compete primarily in industrial applications—ST through sensors and microcontrollers, IPG via laser tech. Their investment profiles contrast sharply: ST offers diversified semiconductor exposure; IPG delivers focused laser innovation with niche market leadership.
Income Statement Comparison
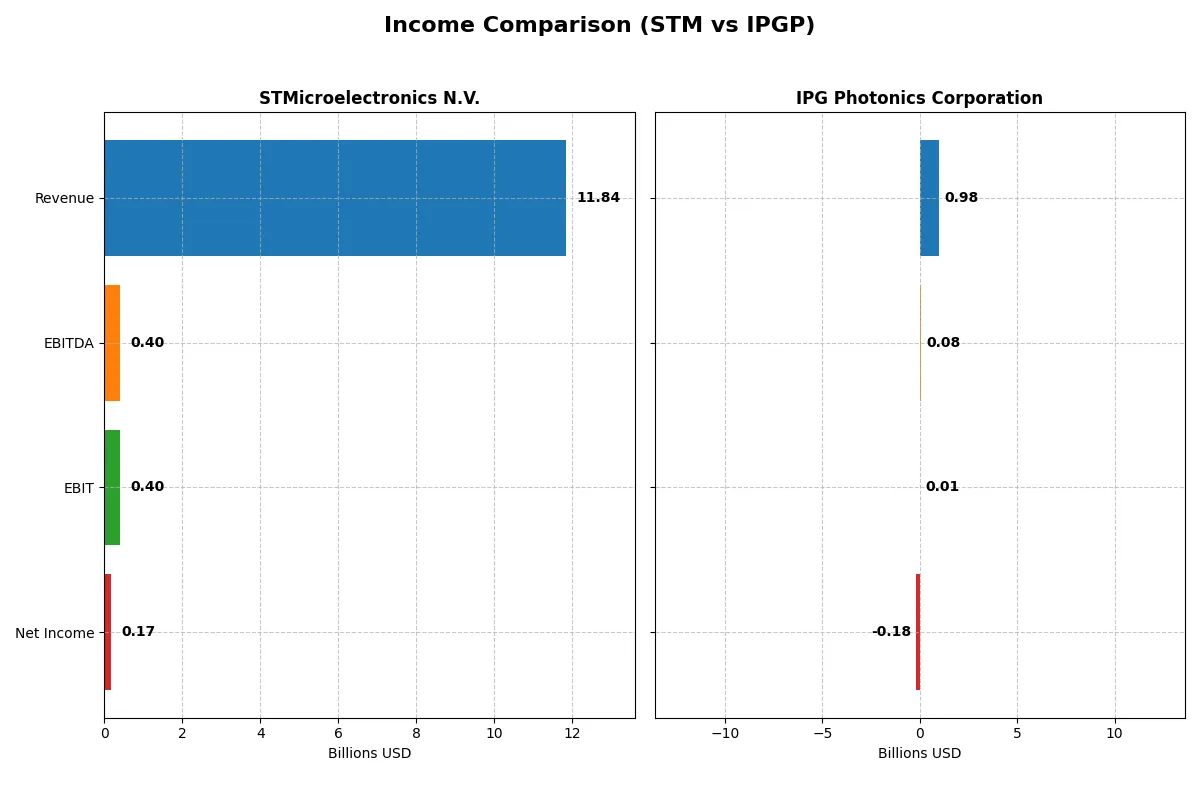
This data dissects the core profitability and scalability of both corporate engines to reveal who dominates the bottom line in the most recent fiscal year:
| Metric | STMicroelectronics N.V. (STM) | IPG Photonics Corporation (IPGP) |
|---|---|---|
| Revenue | 11.8B | 977M |
| Cost of Revenue | 7.8B | 639M |
| Operating Expenses | 3.7B | 546M |
| Gross Profit | 4.0B | 338M |
| EBITDA | 401M | 76M |
| EBIT | 401M | 14M |
| Interest Expense | 0 | 0 |
| Net Income | 167M | -182M |
| EPS | 0.19 | -4.09 |
| Fiscal Year | 2025 | 2024 |
Income Statement Analysis: The Bottom-Line Duel
The following income statement comparison reveals which company drives efficiency and profitability in their respective markets.
STMicroelectronics N.V. Analysis
STMicroelectronics’ revenue declined from $17.3B in 2023 to $11.8B in 2025, with net income plunging sharply from $4.2B to $167M. Gross margin remains favorable at 33.9%, but net margin shrank to 1.4%, reflecting severe profit compression. The 2025 results signal weakened operating leverage and diminished bottom-line momentum.
IPG Photonics Corporation Analysis
IPG’s revenue dropped from $1.29B in 2023 to $977M in 2024, while net income swung from a $219M profit to a $182M loss. Gross margin holds steady near 34.6%, but net margin collapsed to -18.6%, driven by large operating losses. The latest year exposes significant operational challenges and deteriorating earnings quality.
Margin Stability vs. Earnings Collapse
Both companies face declining revenues and deep net income contractions, but STMicroelectronics retains a positive, albeit slim, net margin versus IPG’s substantial losses. STMicroelectronics’ scale and margin control offer a clearer fundamental advantage. Investors seeking resilience may find STMicroelectronics’ profile comparatively more attractive despite headwinds.
Financial Ratios Comparison
These vital ratios act as a diagnostic tool to expose underlying fiscal health, valuation premiums, and capital efficiency for each company:
| Ratios | STMicroelectronics N.V. (STM) | IPG Photonics Corporation (IPGP) |
|---|---|---|
| ROE | 8.9% (2024) | -9.0% (2024) |
| ROIC | 6.3% (2024) | -10.0% (2024) |
| P/E | 14.4 (2024) | -17.8 (2024) |
| P/B | 1.29 (2024) | 1.59 (2024) |
| Current Ratio | 3.11 (2024) | 6.98 (2024) |
| Quick Ratio | 2.37 (2024) | 5.59 (2024) |
| D/E | 0.18 (2024) | 0.009 (2024) |
| Debt-to-Assets | 12.8% (2024) | 0.8% (2024) |
| Interest Coverage | 19.7 (2024) | 0 (no coverage) (2024) |
| Asset Turnover | 0.54 (2024) | 0.43 (2024) |
| Fixed Asset Turnover | 1.22 (2024) | 1.66 (2024) |
| Payout ratio | 18.5% (2024) | 0% (2024) |
| Dividend yield | 1.28% (2024) | 0% (2024) |
| Fiscal Year | 2024 | 2024 |
Efficiency & Valuation Duel: The Vital Signs
Ratios act as a company’s DNA, revealing hidden risks and operational excellence beneath surface-level financials.
STMicroelectronics N.V.
STMicroelectronics shows weak profitability with a ROE of 0.93% and a net margin at 1.41%, both unfavorable. Its valuation metrics, including P/E and P/B, appear favorable but lack market cap data for full context. The company avoids dividends, reinvesting heavily in R&D, signaling a growth-focused capital allocation strategy despite operational challenges.
IPG Photonics Corporation
IPG Photonics posts negative profitability ratios: ROE at -8.97% and a net margin of -18.58%, which flags significant operational strain. Despite this, the P/E ratio is favorable due to negative earnings, but the P/B ratio remains neutral. The firm pays no dividends, likely channeling resources towards managing losses and sustaining R&D investment amid headwinds.
Operational Struggles vs. Valuation Anomalies
STMicroelectronics offers modest profitability with favorable valuation markers, balancing risks and growth reinvestment. IPG Photonics faces deeper profitability issues but benefits from valuation distortions caused by losses. Investors seeking minor operational risks might prefer STMicroelectronics, while those comfortable with turnaround potential could consider IPG Photonics’ profile.
Which one offers the Superior Shareholder Reward?
I observe STMicroelectronics (STM) pays a modest dividend yield of 1.28% with a 18.5% payout ratio, balancing cash returns and reinvestment. STM’s buyback intensity is moderate but consistent, supporting steady shareholder value. IPG Photonics (IPGP pays no dividends but channels strong free cash flow (3.37/share) into growth and acquisitions, fueling innovation. Its buybacks are less visible, reflecting a focus on expansion over distributions. STM’s dividend and buybacks appear more sustainable amid semiconductor cyclicality. However, IPGP’s reinvestment suggests higher long-term capital appreciation potential. For 2026, I favor STM for income-focused investors and IPGP for growth seekers, with STM offering the more balanced total return profile.
Comparative Score Analysis: The Strategic Profile
The radar chart reveals the fundamental DNA and trade-offs of STMicroelectronics and IPG Photonics, highlighting their core financial strengths and vulnerabilities:
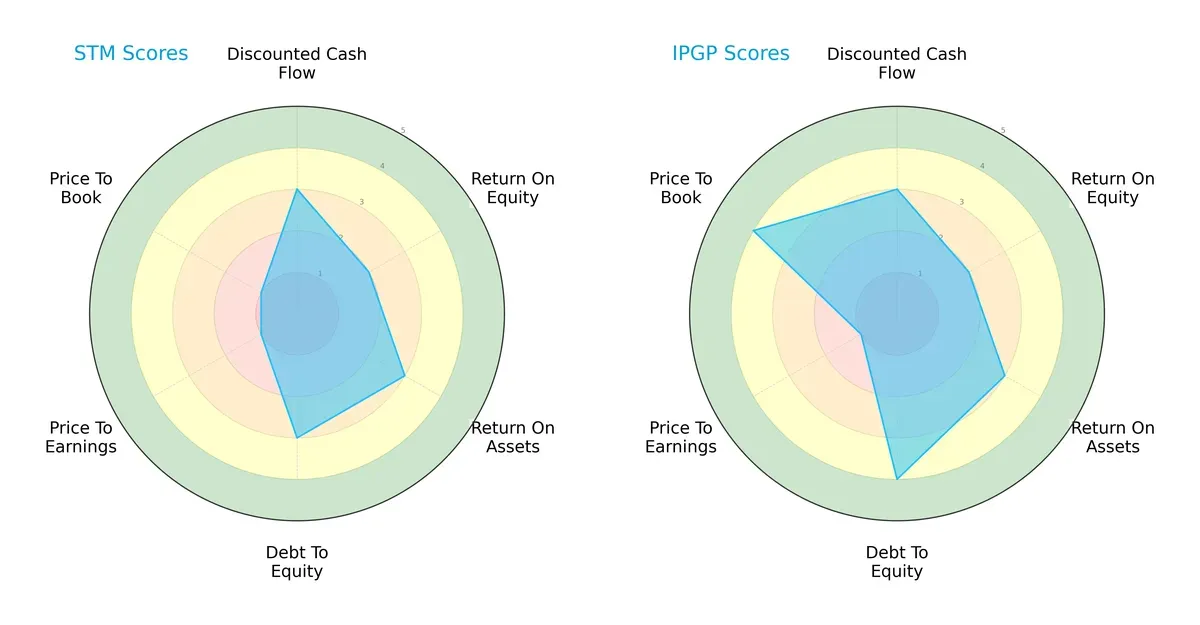
IPG Photonics shows a more balanced profile with a strong debt-to-equity score (4) and favorable price-to-book valuation (4). STMicroelectronics relies on moderate operational efficiency but suffers from weak valuation metrics (PE and PB at 1), signaling potential market undervaluation or investor skepticism. Both share similar DCF and ROE scores, but IPGP’s stronger balance sheet and valuation discipline position it better in this cycle.
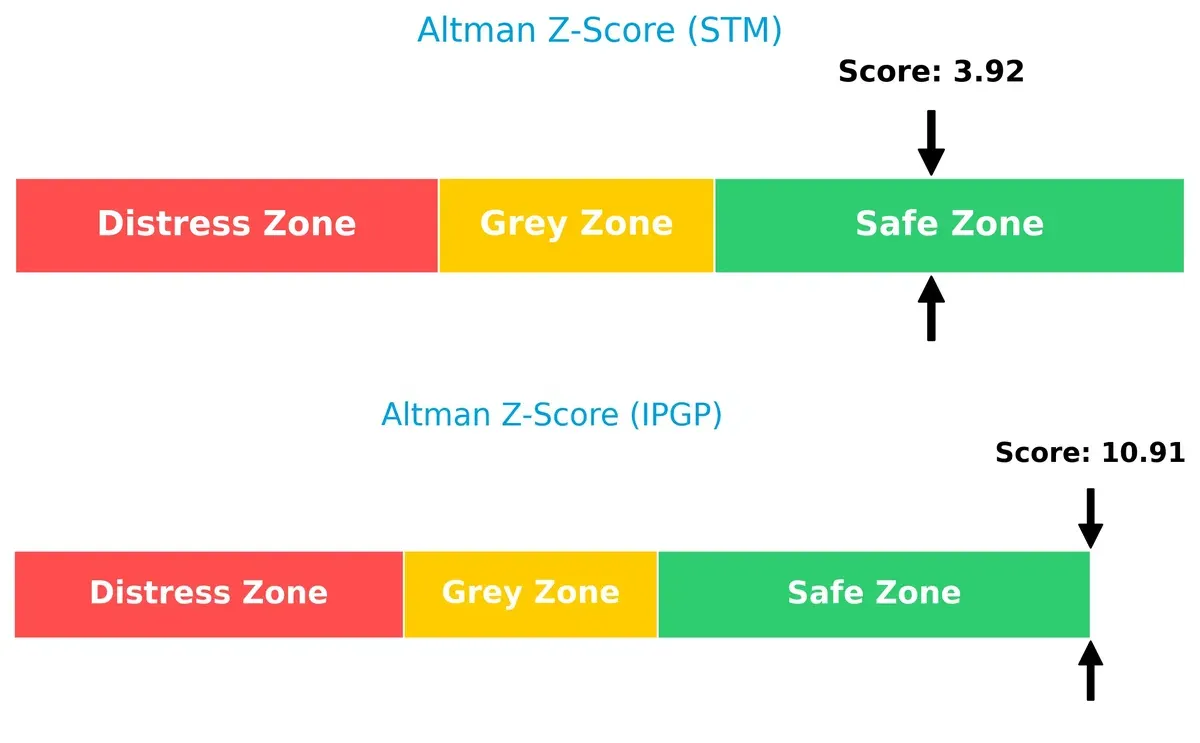
Bankruptcy Risk: Solvency Showdown
IPG Photonics’ Altman Z-Score at 10.9 far exceeds STMicroelectronics’ 3.9, indicating a significantly lower bankruptcy risk and superior long-term solvency in this economic environment:
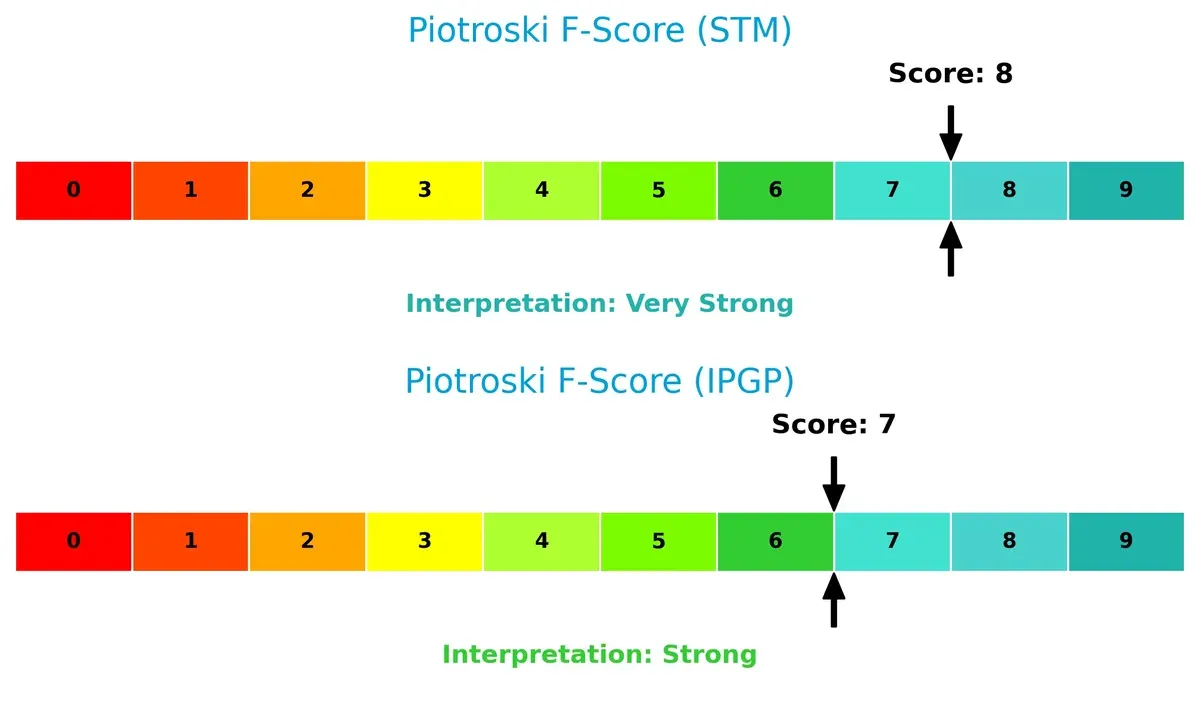
Financial Health: Quality of Operations
STMicroelectronics scores an 8 on the Piotroski F-Score, reflecting very strong internal financial health. IPG Photonics follows with a solid 7, also indicating strength but with slightly more caution warranted:
How are the two companies positioned?
This section dissects STM and IPGP’s operational DNA by comparing their revenue distribution and internal dynamics. The goal is to confront their economic moats to identify which offers the most resilient, sustainable competitive advantage today.
Revenue Segmentation: The Strategic Mix
This comparison dissects how STMicroelectronics and IPG Photonics diversify their income streams and reveals their primary sector bets:
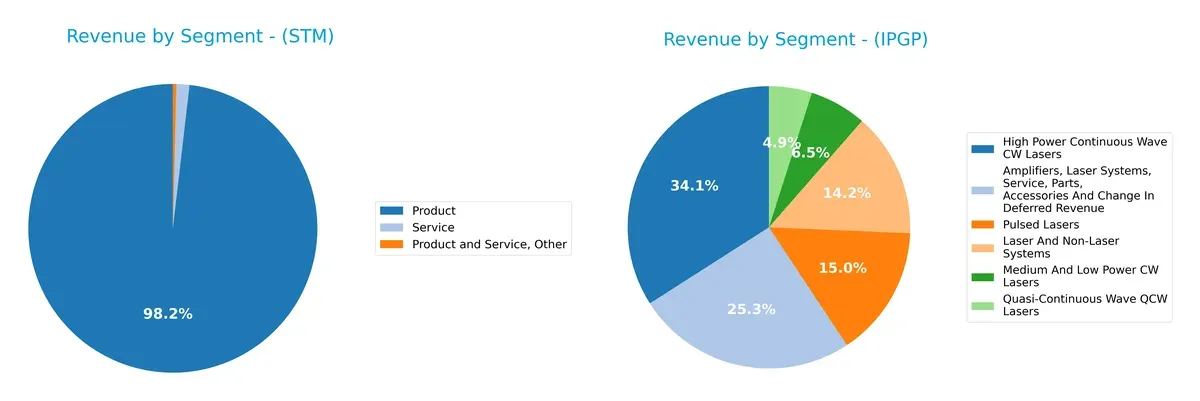
STMicroelectronics anchors revenue with a massive $13.2B product segment, complemented by modest $52M in other services, showing a strong product concentration. IPG Photonics displays a more balanced mix, with $333M from high-power CW lasers and $247M from amplifiers and services, reflecting broader diversification across laser technologies. STM’s reliance on product sales poses concentration risk, while IPG’s spread across multiple laser segments supports resilience and ecosystem lock-in.
Strengths and Weaknesses Comparison
This table compares the strengths and weaknesses of STMicroelectronics N.V. and IPG Photonics Corporation:
STM Strengths
- Diversified product segments with over $13B in product sales
- Strong global presence in Asia Pacific and USA
- Favorable debt metrics and interest coverage
- Solid quick ratio indicates liquidity
IPGP Strengths
- Strong focus on laser systems and amplifiers product line
- Favorable debt ratios and interest coverage
- Broad geographic presence including China, Europe, North America
- Quick ratio signals good short-term liquidity
STM Weaknesses
- Unfavorable profitability ratios: net margin 1.41%, ROE 0.93%, ROIC 0.67%
- High current ratio may suggest inefficient asset use
- Low asset turnover at 0.48
- Zero dividend yield
IPGP Weaknesses
- Negative profitability: net margin -18.58%, ROE -8.97%, ROIC -9.97%
- High current ratio indicating potential inefficiency
- Asset turnover weak at 0.43
- Zero dividend yield
STM exhibits broad diversification and stable financial structure but struggles with profitability and asset efficiency. IPGP shows concentrated innovation in lasers and strong liquidity but faces significant profitability challenges. Both companies must address profitability weaknesses to enhance shareholder value.
The Moat Duel: Analyzing Competitive Defensibility
A structural moat is the sole barrier shielding long-term profits from relentless competition and market pressures:
STMicroelectronics N.V.: Broad Product Portfolio with Geographic Reach
I see STMicroelectronics’ moat rooted in product diversification and global footprint. Despite a declining ROIC, its steady gross margins and broad market presence offer some margin stability. New automotive and industrial tech could deepen its moat if profitability recovers in 2026.
IPG Photonics Corporation: Specialized Technology and Innovation Leadership
IPG’s moat relies on proprietary fiber laser technology and high barriers to entry. Unlike STM, IPG shows sharper ROIC decline and margin pressure, signaling value destruction. Yet its innovation pipeline could disrupt materials processing markets if execution improves in 2026.
Specialized Innovation vs. Diversified Manufacturing: Who Defends Better?
Both firms face eroding ROICs well below WACC, signaling shrinking moats. However, STM’s diversified product lines and global sales provide a wider moat than IPG’s specialized but vulnerable niche. STM is better positioned to defend market share amid cyclical headwinds.
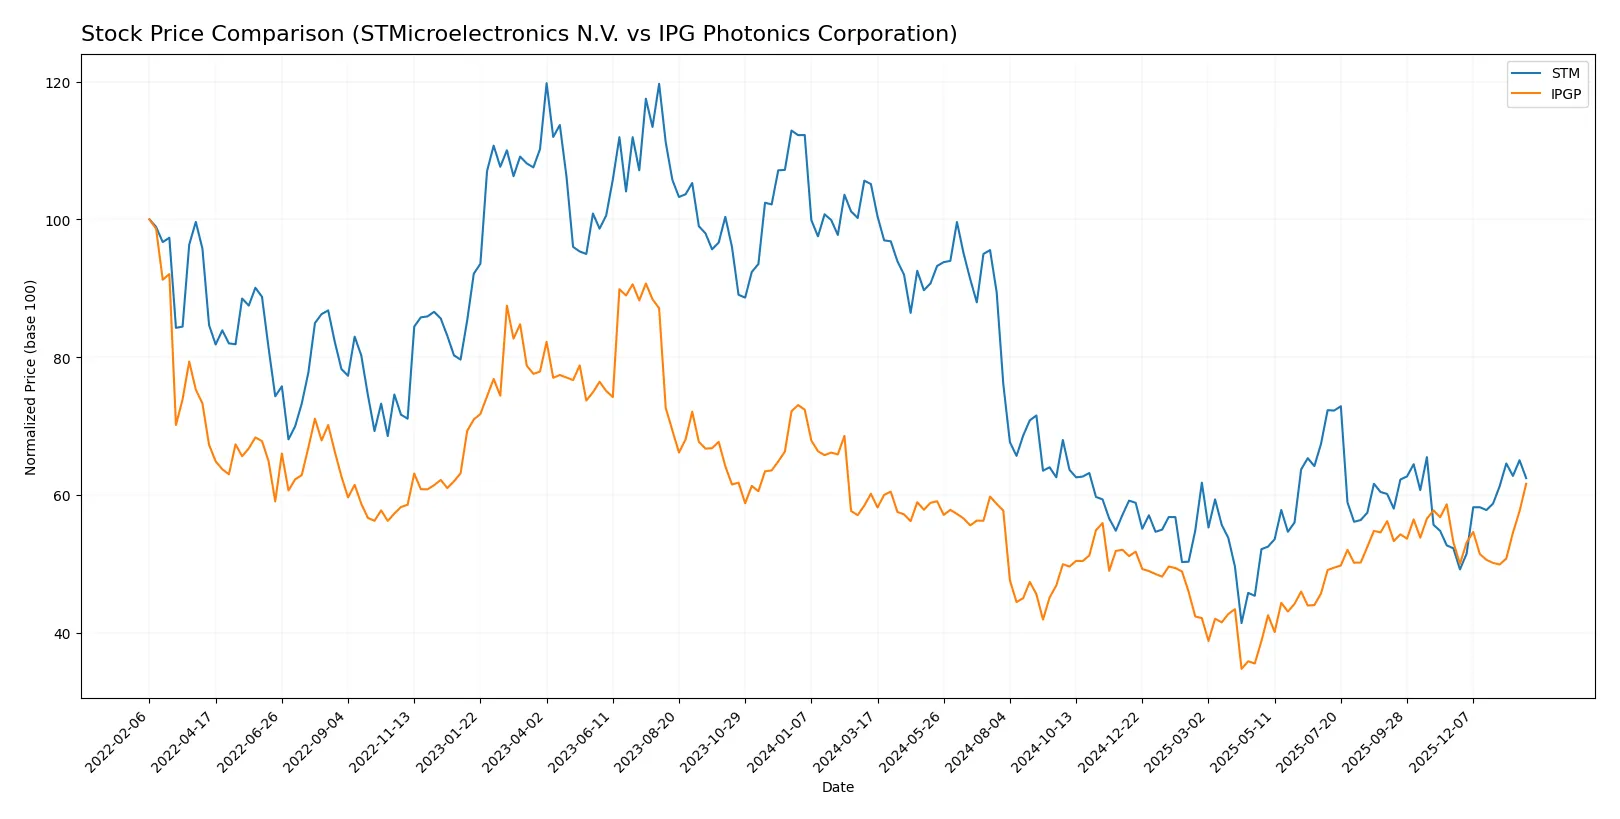
Which stock offers better returns?
The stock prices of STMicroelectronics N.V. and IPG Photonics Corporation have shown contrasting dynamics over the past year, with notable shifts in momentum and trading volume trends.
Trend Comparison
STMicroelectronics N.V. exhibits a bearish trend over the past 12 months with a 40.6% price decline, accelerating downward from a high of 46.95 to a low of 18.49. Recent months show a 19.49% rebound, indicating a short-term recovery.
IPG Photonics Corporation maintains a bullish trend with a 2.4% gain over the last year and accelerating momentum. The stock’s recent 15.96% rise continues a steady uptrend from 52.12 to 92.41, despite higher volatility.
IPG Photonics delivered superior market performance compared to STMicroelectronics, with sustained gains and less severe long-term declines, reflecting stronger investor confidence over the year.
Target Prices
Analysts present a clear upside consensus for both STMicroelectronics N.V. and IPG Photonics Corporation.
| Company | Target Low | Target High | Consensus |
|---|---|---|---|
| STMicroelectronics N.V. | 28 | 45 | 37.67 |
| IPG Photonics Corporation | 92 | 96 | 94 |
STMicroelectronics’ consensus target is 35% above its current 27.89 price, signaling strong growth expectations. IPG Photonics trades near its 92.41 price, with a modest upside to the 94 consensus target.

Don’t Let Luck Decide Your Entry Point
Optimize your entry points with our advanced ProRealTime indicators. You’ll get efficient buy signals with precise price targets for maximum performance. Start outperforming now!
How do institutions grade them?
The following tables summarize recent institutional grades for both companies:
STMicroelectronics N.V. Grades
This table shows recent grades and rating changes from major institutions for STMicroelectronics N.V.:
| Grading Company | Action | New Grade | Date |
|---|---|---|---|
| TD Cowen | Maintain | Buy | 2025-10-24 |
| Susquehanna | Maintain | Positive | 2025-10-22 |
| Susquehanna | Maintain | Positive | 2025-07-25 |
| Baird | Upgrade | Outperform | 2025-07-22 |
| Susquehanna | Maintain | Positive | 2025-07-22 |
| Jefferies | Upgrade | Buy | 2025-02-19 |
| Bernstein | Downgrade | Market Perform | 2025-02-05 |
| Susquehanna | Maintain | Positive | 2025-01-31 |
| Barclays | Downgrade | Underweight | 2025-01-22 |
| JP Morgan | Downgrade | Neutral | 2024-12-09 |
IPG Photonics Corporation Grades
This table shows recent grades and rating changes from major institutions for IPG Photonics Corporation:
| Grading Company | Action | New Grade | Date |
|---|---|---|---|
| Citigroup | Upgrade | Buy | 2025-11-05 |
| Bernstein | Upgrade | Outperform | 2025-08-07 |
| Raymond James | Maintain | Strong Buy | 2025-05-07 |
| CL King | Upgrade | Buy | 2025-03-18 |
| Citigroup | Maintain | Sell | 2025-02-18 |
| Stifel | Maintain | Buy | 2025-02-12 |
| Needham | Maintain | Hold | 2025-02-12 |
| Seaport Global | Downgrade | Neutral | 2024-08-01 |
| Stifel | Maintain | Buy | 2024-07-31 |
| Raymond James | Maintain | Strong Buy | 2024-07-31 |
Which company has the best grades?
IPG Photonics holds stronger buy and outperform ratings with fewer downgrades, signaling more institutional confidence. STMicroelectronics shows mixed grades with several downgrades, indicating cautious investor sentiment. This contrast could influence portfolio risk assessments.
Risks specific to each company
In 2026’s volatile tech landscape, these categories expose the critical pressure points and systemic threats facing STMicroelectronics and IPG Photonics:
1. Market & Competition
STMicroelectronics N.V.
- Faces intense rivalry in semiconductors with diversified product lines but margin pressure.
IPG Photonics Corporation
- Competes in niche fiber laser market but struggles with profitability and market share growth.
2. Capital Structure & Debt
STMicroelectronics N.V.
- Maintains low debt-to-equity (0.12), strong interest coverage, signaling financial stability.
IPG Photonics Corporation
- Extremely low leverage (0.01), excellent interest coverage, minimal financial risk on balance sheet.
3. Stock Volatility
STMicroelectronics N.V.
- Higher beta (1.29) indicates more price volatility versus market benchmarks.
IPG Photonics Corporation
- Moderate beta (1.02) shows relatively stable stock performance amid sector fluctuations.
4. Regulatory & Legal
STMicroelectronics N.V.
- Operates globally, exposing it to complex semiconductor export controls and IP regulations.
IPG Photonics Corporation
- Subject to strict US tech regulations; potential risks from trade policies impacting supply chain.
5. Supply Chain & Operations
STMicroelectronics N.V.
- Global manufacturing footprint faces raw material cost volatility and geopolitical supply risks.
IPG Photonics Corporation
- More focused production but dependent on specialized components, vulnerable to supply disruptions.
6. ESG & Climate Transition
STMicroelectronics N.V.
- Large footprint requires aggressive climate strategy to meet tightening EU and global ESG standards.
IPG Photonics Corporation
- Smaller scale eases transition but must address energy-intensive laser production’s environmental impact.
7. Geopolitical Exposure
STMicroelectronics N.V.
- Exposure across multiple regions places it at risk from EU-US-China tech tensions.
IPG Photonics Corporation
- US-based with less geographic diversification, but trade frictions could limit export markets.
Which company shows a better risk-adjusted profile?
STMicroelectronics’s main risk lies in fierce global market competition squeezing already thin margins. IPG Photonics grapples with severe profitability issues, reflected in its negative net margin and ROIC. Despite STM’s higher stock volatility, its robust capital structure and safer Altman Z-Score (3.9) signal stronger financial resilience. IPGP’s wider liquidity cushion contrasts with its weaker operational efficiency and a slightly lower Piotroski Score (7 vs. 8). Overall, STM demonstrates a more balanced risk-adjusted profile, justified by its safer credit metrics and diversified market presence amid semiconductor sector headwinds.
Final Verdict: Which stock to choose?
STMicroelectronics N.V. (STM) stands out with its resilient operational foundation and robust liquidity, reflecting a cash-rich balance sheet that supports ongoing R&D investment. However, its declining profitability and value destruction signal caution. STM fits a portfolio focused on turnaround potential and cyclical recovery plays.
IPG Photonics Corporation (IPGP) leverages its strong balance sheet and niche in photonics technology, underpinned by a strategic moat of specialized innovation. Despite recent profit erosion, its safety profile is stronger than STM’s. IPGP suits investors seeking growth with a margin of capital preservation, blending innovation with moderate risk.
If you prioritize recovery plays with potential upside from operational improvements, STM is the compelling choice due to its cash cushions and R&D commitment. However, if you seek innovation-driven growth with better stability, IPGP offers superior balance sheet strength and strategic focus. Both carry notable risks, demanding close monitoring of their profitability trajectories.
Disclaimer: Investment carries a risk of loss of initial capital. The past performance is not a reliable indicator of future results. Be sure to understand risks before making an investment decision.
Go Further
I encourage you to read the complete analyses of STMicroelectronics N.V. and IPG Photonics Corporation to enhance your investment decisions: