In the fast-evolving semiconductor industry, Qnity Electronics, Inc. and IPG Photonics Corporation stand out as innovative players driving technological progress. Both companies operate in overlapping markets, focusing on advanced electronic materials and high-performance laser solutions, respectively. By comparing their strategies, market positions, and growth potential, this article aims to help you identify which stock offers the most compelling investment opportunity today. Let’s explore their strengths and risks together.
Table of contents
Companies Overview
I will begin the comparison between Qnity Electronics, Inc. and IPG Photonics Corporation by providing an overview of these two companies and their main differences.
Qnity Electronics, Inc. Overview
Qnity Electronics, Inc. focuses on providing electronic solutions and materials used in semiconductor chip manufacturing and advanced electronic materials. The company, which rebranded from Novus SpinCo 1, Inc. in April 2025, operates within the technology sector and is headquartered in Wilmington, Delaware. It is positioned as a key player in the semiconductor industry with a market cap of approximately 19.5B USD.
IPG Photonics Corporation Overview
IPG Photonics Corporation develops, manufactures, and sells high-performance fiber lasers, amplifiers, and diode lasers, serving applications in materials processing, communications, and medical fields. Founded in 1990 and based in Marlborough, Massachusetts, IPG operates in the semiconductor sector with a market cap near 3.4B USD. The company employs around 4,740 people and distributes products globally via direct sales and partnerships.
Key similarities and differences
Both companies operate in the semiconductor industry and focus on advanced technology products. Qnity Electronics specializes in electronic materials for chip manufacturing, while IPG Photonics develops laser and amplifier systems for diverse applications including communications and medical uses. Qnity is newer to the market with a higher market cap, while IPG has a longer history and larger workforce. Their business models differ on product focus and customer reach, though both serve technology-driven markets.
Income Statement Comparison
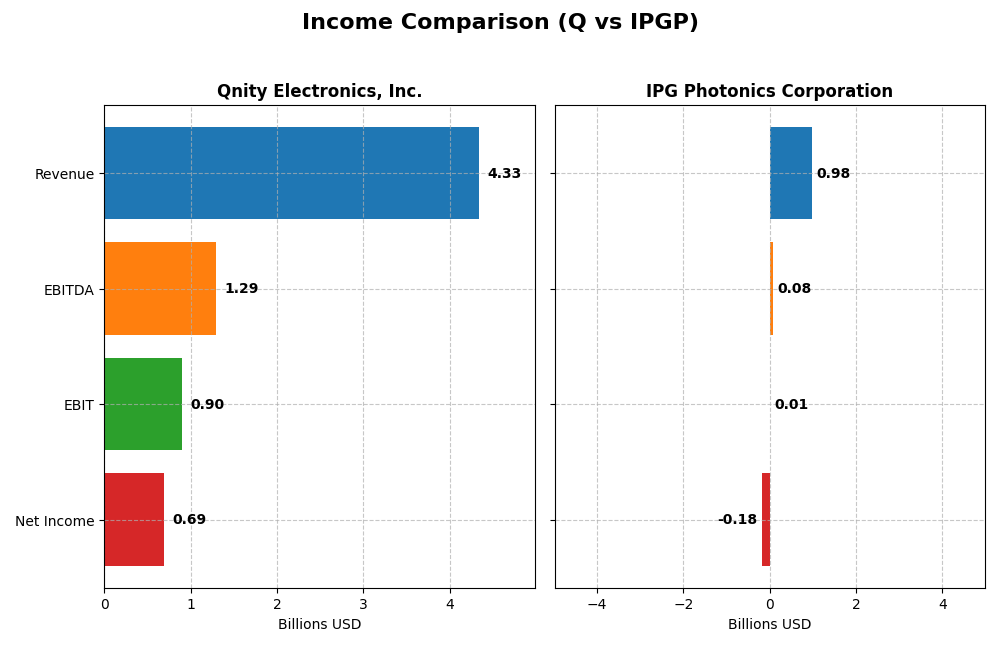
The table below compares key income statement metrics for Qnity Electronics, Inc. and IPG Photonics Corporation for the fiscal year 2024, providing a snapshot of their financial performance.
| Metric | Qnity Electronics, Inc. | IPG Photonics Corporation |
|---|---|---|
| Market Cap | 19.5B | 3.4B |
| Revenue | 4.34B | 977M |
| EBITDA | 1.29B | 76M |
| EBIT | 898M | 14.5M |
| Net Income | 693M | -182M |
| EPS | 3.31 | -4.09 |
| Fiscal Year | 2024 | 2024 |
Income Statement Interpretations
Qnity Electronics, Inc.
Qnity Electronics showed a fluctuating revenue trend from 2022 to 2024, with a decline overall but a 7.43% increase in the last year. Net income followed a similar pattern, decreasing over the full period but rising 36.69% most recently. Margins remained favorable, with gross margin at 46.11% and net margin improving to 15.99% in 2024, indicating strengthened profitability.
IPG Photonics Corporation
IPG Photonics experienced a steady decline in revenue and net income from 2020 through 2024, with a sharp 24.1% revenue drop and a net loss in 2024. Margins weakened significantly, with net margin falling to -18.58%. The latest year saw a 93.75% decrease in EBIT and a worsening net margin, reflecting deteriorating operational efficiency and profitability challenges.
Which one has the stronger fundamentals?
Qnity Electronics demonstrates stronger fundamentals, supported by favorable gross and net margins alongside recent growth in earnings per share and operating income. In contrast, IPG Photonics faces unfavorable trends across revenue, profitability, and margin metrics, including significant net losses and margin contractions. The data suggest Qnity maintains a more resilient and improving income statement profile.
Financial Ratios Comparison
The table below presents a side-by-side comparison of key financial ratios for Qnity Electronics, Inc. (Q) and IPG Photonics Corporation (IPGP) based on their most recent fiscal year data (2024).
| Ratios | Qnity Electronics, Inc. (Q) | IPG Photonics Corporation (IPGP) |
|---|---|---|
| ROE | 6.51% | -8.97% |
| ROIC | 5.92% | -9.97% |
| P/E | 28.8 | -17.76 |
| P/B | 1.88 | 1.59 |
| Current Ratio | 1.77 | 6.98 |
| Quick Ratio | 1.06 | 5.59 |
| D/E (Debt-to-Equity) | 0.018 | 0.009 |
| Debt-to-Assets | 1.56% | 0.78% |
| Interest Coverage | 3.03 | 0 (no coverage) |
| Asset Turnover | 0.35 | 0.43 |
| Fixed Asset Turnover | 2.59 | 1.66 |
| Payout ratio | 0% | 0% |
| Dividend yield | 0% | 0% |
Interpretation of the Ratios
Qnity Electronics, Inc.
Qnity Electronics shows a slightly favorable ratio profile with strengths in net margin (16%) and capital structure, indicated by low debt levels and solid current and quick ratios. However, return on equity is weak at 6.5%, and asset turnover is lower, suggesting efficiency concerns. The company pays a small dividend, but the yield is effectively zero, indicating limited shareholder returns through dividends.
IPG Photonics Corporation
IPG Photonics faces a slightly unfavorable ratio profile, with negative profitability metrics such as net margin at -18.6% and negative returns on equity and capital, signaling operational challenges. Its balance sheet ratios are strong, including a high current ratio and low debt. The company does not pay dividends, likely focusing on reinvestment or restructuring amid losses.
Which one has the best ratios?
Qnity Electronics presents a more balanced and slightly favorable financial ratio set, with positive profitability and capital structure metrics. In contrast, IPG Photonics suffers from negative profitability and returns, despite strong liquidity and low leverage. Overall, Qnity’s ratios appear more robust than IPG Photonics’ in the current fiscal year.
Strategic Positioning
This section compares the strategic positioning of Qnity Electronics, Inc. (Q) and IPG Photonics Corporation (IPGP) regarding Market position, Key segments, and Exposure to technological disruption:
Qnity Electronics, Inc. (Q)
- Newer market entrant with a $19.5B market cap in semiconductors, no beta risk.
- Focuses on electronic solutions and materials for semiconductor chip manufacturing.
- No explicit data on technological disruption exposure provided.
IPG Photonics Corporation (IPGP)
- Established player with $3.4B market cap, moderate market volatility (beta 1.02).
- Diversified laser products serving materials processing, communications, and medical sectors.
- Operates in advanced fiber lasers and amplifiers, potentially sensitive to laser tech advances.
Q vs IPGP Positioning
Q has a concentrated focus on semiconductor materials with a high market cap but limited operational history. IPGP offers diversified laser technologies across multiple applications but has smaller market capitalization and higher operational complexity.
Which has the best competitive advantage?
Q shows a stable but neutral moat with no strong competitive advantage, while IPGP has a very unfavorable moat status due to declining ROIC and value destruction, indicating weaker competitive positioning.
Stock Comparison
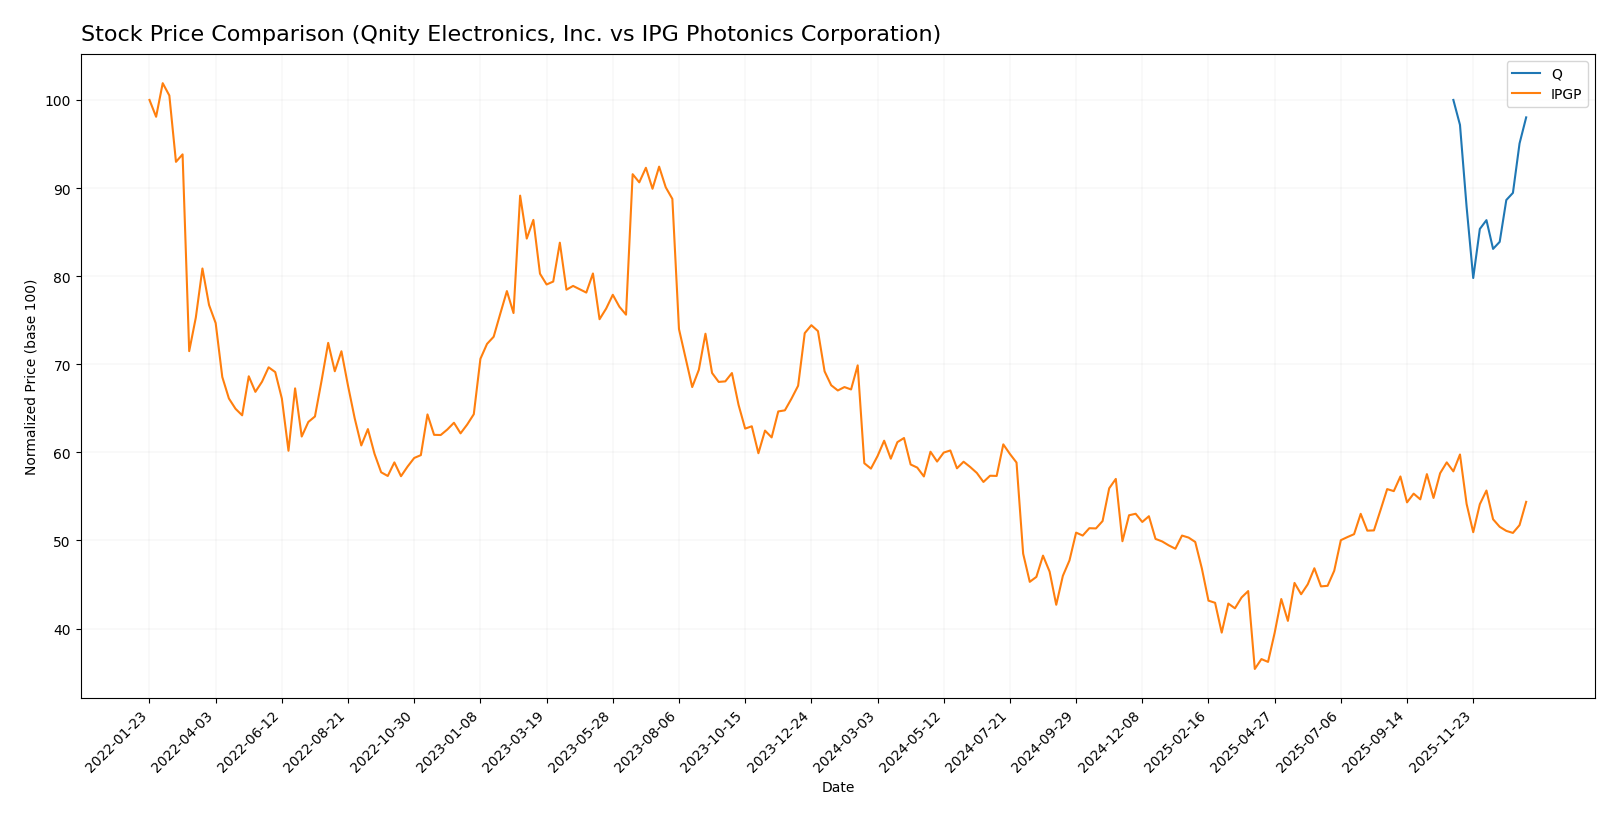
The past year reveals contrasting trading dynamics for Qnity Electronics, Inc. and IPG Photonics Corporation, with both experiencing bearish trends but differing in volatility and volume behavior.
Trend Analysis
Qnity Electronics, Inc. shows a slight bearish trend over the past 12 months, with a -1.98% price change and stable acceleration. The price ranged between 75.8 and 95.0, with moderate volatility (std deviation 5.94).
IPG Photonics Corporation exhibits a stronger bearish trend with a -6.49% decline over the same period, coupled with decelerating momentum. Volatility is higher (std deviation 9.27), and the price fluctuated from 52.12 to 90.69.
Comparing both, IPG Photonics Corporation delivered the lowest market performance with a larger price decline and greater volatility than Qnity Electronics, Inc.
Target Prices
Analysts present a clear consensus on target prices for Qnity Electronics, Inc. and IPG Photonics Corporation, revealing moderate upside potential.
| Company | Target High | Target Low | Consensus |
|---|---|---|---|
| Qnity Electronics, Inc. | 117 | 92 | 105.89 |
| IPG Photonics Corporation | 96 | 92 | 94 |
The consensus target price for Qnity Electronics is about 14% above the current price of $93.12, indicating potential growth. For IPG Photonics, the target consensus of $94 suggests a roughly 17% upside from its current price of $80.03.
Analyst Opinions Comparison
This section compares analysts’ ratings and grades for Qnity Electronics, Inc. (Q) and IPG Photonics Corporation (IPGP):
Rating Comparison
Q Rating
- Rating: B+, classified as Very Favorable by analysts.
- Discounted Cash Flow Score: 4, indicating a favorable valuation outlook.
- ROE Score: 3, showing moderate efficiency in generating profit from equity.
- ROA Score: 4, demonstrating favorable asset utilization.
- Debt To Equity Score: 3, reflecting moderate financial risk.
- Overall Score: 3, representing a moderate overall financial standing.
IPGP Rating
- Rating: B+, classified as Very Favorable by analysts.
- Discounted Cash Flow Score: 4, indicating a favorable valuation outlook.
- ROE Score: 2, indicating a lower efficiency in generating profit.
- ROA Score: 3, indicating moderate asset utilization.
- Debt To Equity Score: 4, indicating lower financial risk and stronger balance sheet.
- Overall Score: 3, representing a moderate overall financial standing.
Which one is the best rated?
Both Q and IPGP share the same overall rating of B+ and an overall score of 3, indicating moderate financial standing. Q scores better on return metrics (ROE and ROA), while IPGP has a stronger debt-to-equity position.
Scores Comparison
The scores comparison between Qnity Electronics, Inc. and IPG Photonics Corporation is as follows:
Q Scores
- Altman Z-Score: Not available
- Piotroski Score: Not available
IPGP Scores
- Altman Z-Score: 9.65, indicating a safe zone
- Piotroski Score: 7, indicating strong financial health
Which company has the best scores?
Based on the available data, IPG Photonics Corporation has the best scores with a high Altman Z-Score in the safe zone and a strong Piotroski Score of 7. No scores are available for Qnity Electronics, Inc.
Grades Comparison
Here is a comparison of recent grades assigned to Qnity Electronics, Inc. and IPG Photonics Corporation:
Qnity Electronics, Inc. Grades
The following table summarizes recent grades from reputable grading companies for Qnity Electronics, Inc.:
| Grading Company | Action | New Grade | Date |
|---|---|---|---|
| RBC Capital | Maintain | Outperform | 2025-11-25 |
| Mizuho | Maintain | Outperform | 2025-11-20 |
Grades for Qnity Electronics, Inc. consistently show an outperform rating, indicating stable positive outlook from these firms.
IPG Photonics Corporation Grades
Below is a summary of recent grades from well-known grading companies for IPG Photonics Corporation:
| Grading Company | Action | New Grade | Date |
|---|---|---|---|
| Citigroup | Upgrade | Buy | 2025-11-05 |
| Bernstein | Upgrade | Outperform | 2025-08-07 |
| Raymond James | Maintain | Strong Buy | 2025-05-07 |
| CL King | Upgrade | Buy | 2025-03-18 |
IPG Photonics Corporation shows a varied but generally positive trend with several upgrades and strong buy ratings from multiple firms.
Which company has the best grades?
IPG Photonics Corporation has received a broader range of grades including strong buy and multiple upgrades, whereas Qnity Electronics, Inc. holds consistent outperform ratings. This suggests IPG Photonics is viewed with potentially higher growth expectations, which may imply greater upside but possibly also more variability for investors.
Strengths and Weaknesses
Below is a comparison of key strengths and weaknesses of Qnity Electronics, Inc. (Q) and IPG Photonics Corporation (IPGP) based on their recent financial and operational data.
| Criterion | Qnity Electronics, Inc. (Q) | IPG Photonics Corporation (IPGP) |
|---|---|---|
| Diversification | Moderate product range, some stability | Broad laser systems portfolio, declining sales in key segments |
| Profitability | Positive net margin (16%), stable ROIC | Negative net margin (-19%), declining ROIC |
| Innovation | Neutral ROIC trend; moderate innovation | Declining ROIC trend; innovation challenges |
| Global presence | Stable with moderate global reach | Strong global footprint in laser tech |
| Market Share | Stable but no clear moat | Losing value and market strength |
Key takeaways: Qnity Electronics shows stable profitability and a slightly favorable financial profile but lacks a strong competitive moat. In contrast, IPG Photonics is currently facing significant profitability and value destruction issues, with a declining ROIC trend that signals caution for investors despite its broad product range.
Risk Analysis
Below is a comparative table summarizing key risks facing Qnity Electronics, Inc. and IPG Photonics Corporation based on the latest 2024 data.
| Metric | Qnity Electronics, Inc. (Q) | IPG Photonics Corporation (IPGP) |
|---|---|---|
| Market Risk | Moderate (Beta = 0) | Moderate to High (Beta = 1.02) |
| Debt Level | Very Low (D/E = 0.02) | Very Low (D/E = 0.01) |
| Regulatory Risk | Moderate | Moderate |
| Operational Risk | Moderate (Newly rebranded, IPO 2025) | Moderate to High (Complex product lines) |
| Environmental Risk | Low | Low |
| Geopolitical Risk | Moderate (US-based, global supply chains) | Moderate (US-based, global supply chains) |
Qnity Electronics shows low debt and favorable liquidity but faces operational risk from its recent IPO and rebranding in 2025. IPG Photonics carries slightly higher market and operational risks due to its established but complex product range and higher beta. Both companies have manageable regulatory and geopolitical risks given their US base and semiconductor focus. The most impactful risk is market volatility for IPGP and operational execution for Q.
Which Stock to Choose?
Qnity Electronics, Inc. shows a slightly favorable financial profile with stable income growth in 2024, favorable net and EBIT margins, and low debt levels. Its profitability ratios are moderate, with a 6.5% ROE and a neutral ROIC, while maintaining a solid current ratio and a B+ rating.
IPG Photonics Corporation presents an unfavorable income evolution with negative net margin and declining profitability over recent years. Despite low debt and a strong quick ratio, it reports negative ROE and ROIC. The company holds a B+ rating but with a slightly unfavorable overall financial ratios evaluation.
For investors prioritizing stability and moderate financial health, Qnity Electronics might appear more favorable given its positive income statement and slightly favorable ratios. Conversely, those with a higher risk tolerance or seeking potential turnaround opportunities might interpret IPG Photonics’ profile differently, considering its current challenges and valuation metrics.
Disclaimer: Investment carries a risk of loss of initial capital. The past performance is not a reliable indicator of future results. Be sure to understand risks before making an investment decision.
Go Further
I encourage you to read the complete analyses of Qnity Electronics, Inc. and IPG Photonics Corporation to enhance your investment decisions: