Home > Comparison > Technology > ON vs IPGP
The strategic rivalry between ON Semiconductor Corporation and IPG Photonics Corporation shapes the evolution of the semiconductor industry. ON operates as a broad-based technology provider focused on intelligent sensing and power solutions, while IPG Photonics specializes in high-performance fiber laser technologies. This head-to-head highlights a contrast between diversified industrial applications and niche technological innovation. This analysis aims to reveal which trajectory offers superior risk-adjusted returns for a well-diversified portfolio.
Table of contents
Companies Overview
ON Semiconductor and IPG Photonics both hold critical roles in the semiconductor industry, driving innovation in power and laser technologies.
ON Semiconductor Corporation: Powering Electrification and Sensing
ON Semiconductor dominates the power semiconductor market by providing intelligent sensing and power solutions globally. Its core revenue stems from analog, discrete, and integrated semiconductor products that enable automotive electrification and sustainable energy applications. In 2026, the company focuses heavily on expanding its portfolio in electric vehicle power systems and advanced sensing technologies, reinforcing its competitive edge in energy-efficient semiconductor solutions.
IPG Photonics Corporation: Leader in Fiber Laser Innovation
IPG Photonics specializes in high-performance fiber lasers and amplifiers, generating revenue primarily through sales of laser systems used in materials processing and communications. The company’s 2026 strategy emphasizes enhancing its laser technology portfolio and expanding applications in manufacturing and telecommunications. Its focus on cutting-edge fiber laser innovation positions it as a key player in precision industrial and advanced optical solutions.
Strategic Collision: Power Solutions vs. Laser Precision
ON Semiconductor pursues a broad-based, energy-efficient semiconductor ecosystem, while IPG Photonics centers on specialized, high-precision laser systems. Their primary battleground lies in industrial technology markets where power management and laser processing overlap. Investors should note ON offers scale and diversification, while IPG Photonics provides niche leadership with higher technological barriers, reflecting distinct risk and return profiles.
Income Statement Comparison
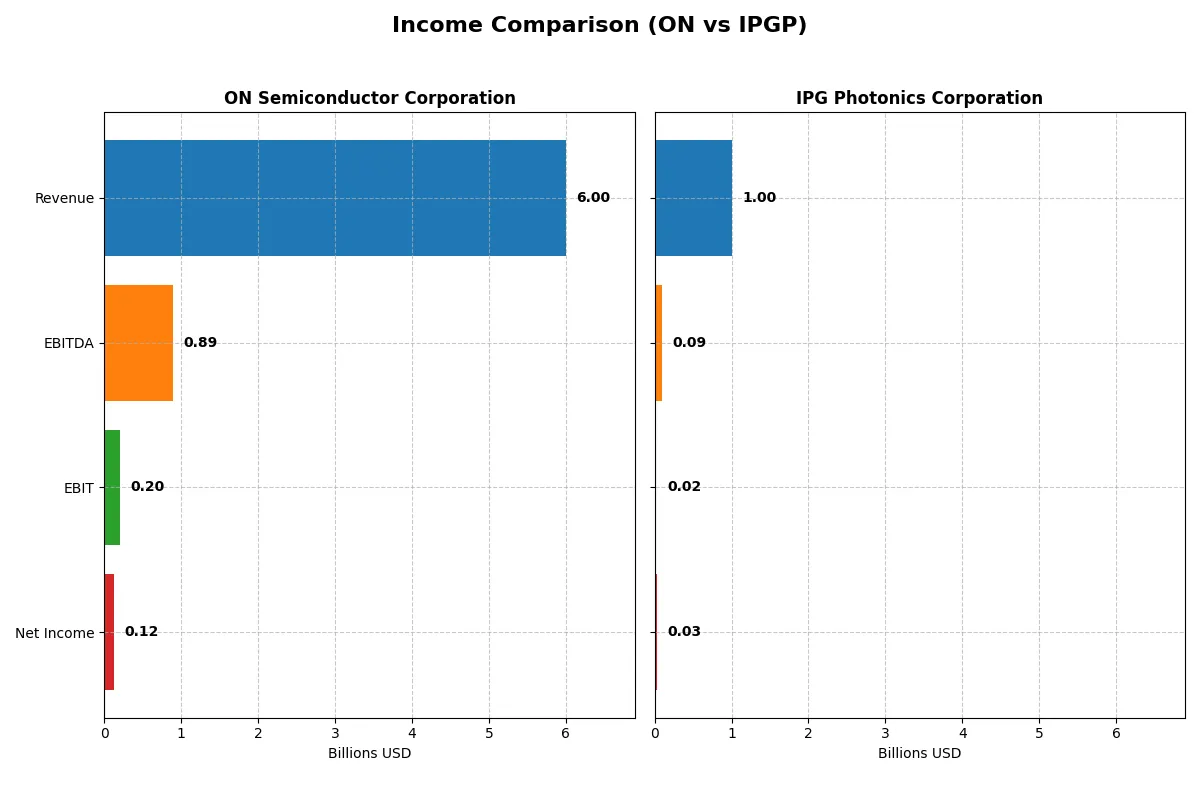
This data dissects the core profitability and scalability of both corporate engines to reveal who dominates the bottom line:
| Metric | ON Semiconductor Corporation (ON) | IPG Photonics Corporation (IPGP) |
|---|---|---|
| Revenue | 5.995B | 1.004B |
| Cost of Revenue | 4.059B | 622M |
| Operating Expenses | 1.188B | 368M |
| Gross Profit | 1.936B | 381M |
| EBITDA | 888M | 90M |
| EBIT | 202M | 23M |
| Interest Expense | 71M | 0 |
| Net Income | 121M | 31M |
| EPS | 0.29 | 0.73 |
| Fiscal Year | 2025 | 2025 |
Income Statement Analysis: The Bottom-Line Duel
The following income statement comparison reveals which company runs a more efficient corporate engine through profitability and margin trends.
ON Semiconductor Corporation Analysis
ON’s revenue slid 15% to $6.0B in 2025, dragging net income down 92% to $121M. Its gross margin remains relatively healthy at 32%, yet net margin compresses sharply to 2%. Operating expenses fell proportionally, but EBIT plunged nearly 90%, signaling weakening operational momentum and pressure on profitability.
IPG Photonics Corporation Analysis
IPGP grew revenue modestly by 2.7% to $1.0B in 2025, while net income rebounded strongly from prior losses to $31M. Gross margin expanded to a solid 38%, and net margin improved to 3.1%. EBIT surged 59%, reflecting improved cost control and operational efficiency, driving positive momentum despite a smaller scale.
Margin Resilience vs. Scale Decline
ON’s larger revenue base contrasts with its steep profit erosion, while IPGP’s smaller scale supports better margin expansion and earnings recovery. IPGP’s income statement shows favorable growth and efficiency, making it the clearer fundamental winner. For investors, IPGP’s improving profitability profile offers more attractive earnings momentum.
Financial Ratios Comparison
These vital ratios act as a diagnostic tool to expose the underlying fiscal health, valuation premiums, and capital efficiency of each company:
| Ratios | ON Semiconductor Corporation (ON) | IPG Photonics Corporation (IPGP) |
|---|---|---|
| ROE | 1.58% | 1.46% |
| ROIC | 6.24% | 0.41% |
| P/E | 183.9 | 98.1 |
| P/B | 2.90 | 1.43 |
| Current Ratio | 4.52 | 6.08 |
| Quick Ratio | 2.98 | 4.74 |
| D/E | 0.45 | 0 |
| Debt-to-Assets | 27.7% | 0 |
| Interest Coverage | 10.5 | 0 |
| Asset Turnover | 0.48 | 0.41 |
| Fixed Asset Turnover | 1.77 | 1.57 |
| Payout Ratio | 0 | 0 |
| Dividend Yield | 0 | 0 |
| Fiscal Year | 2025 | 2025 |
Efficiency & Valuation Duel: The Vital Signs
Financial ratios act as a company’s DNA, uncovering hidden risks and operational strengths behind the headline numbers.
ON Semiconductor Corporation
ON Semiconductor shows weak profitability with a 1.58% ROE and a slim 2.02% net margin, signaling limited operational efficiency. The stock trades at a stretched 184 P/E and 3.9 EV/Sales, suggesting high valuation. It offers no dividend, focusing instead on reinvestment through R&D to fuel growth amid challenging returns.
IPG Photonics Corporation
IPG Photonics posts similarly low profitability, with a 1.46% ROE and 3.1% net margin, indicating weak core earnings. The company trades at a high 98 P/E but benefits from a lower 1.43 price-to-book ratio, reflecting a more reasonable asset valuation. Like ON, it pays no dividend, prioritizing cash for growth and innovation.
Premium Valuation vs. Operational Safety
Both companies carry slightly unfavorable ratio profiles with stretched valuations and weak profitability. ON trades at a much higher P/E, reflecting greater market optimism but also higher risk. IPG’s stronger balance sheet and lower price-to-book ratio offer a safer operational footing. Investors seeking growth at a moderate risk may lean toward IPG’s profile.
Which one offers the Superior Shareholder Reward?
ON Semiconductor and IPG Photonics both forego dividends, focusing on growth and buybacks. ON’s free cash flow per share is positive and steady at 3.45 in 2025, supporting share repurchases. IPG’s free cash flow turned negative in 2025 (-0.08), raising sustainability concerns. ON’s robust operating cash flow and zero dividend payout ratio signal more reliable capital allocation. IPG’s higher price-to-earnings ratio (98x vs. ON’s 184x in 2025) reflects market optimism, but its volatile margins and negative free cash flow hinder total return potential. I conclude ON Semiconductor offers the more attractive and sustainable shareholder reward in 2026.
Comparative Score Analysis: The Strategic Profile
The radar chart reveals the fundamental DNA and trade-offs of ON Semiconductor Corporation and IPG Photonics Corporation, highlighting their financial strengths and vulnerabilities:
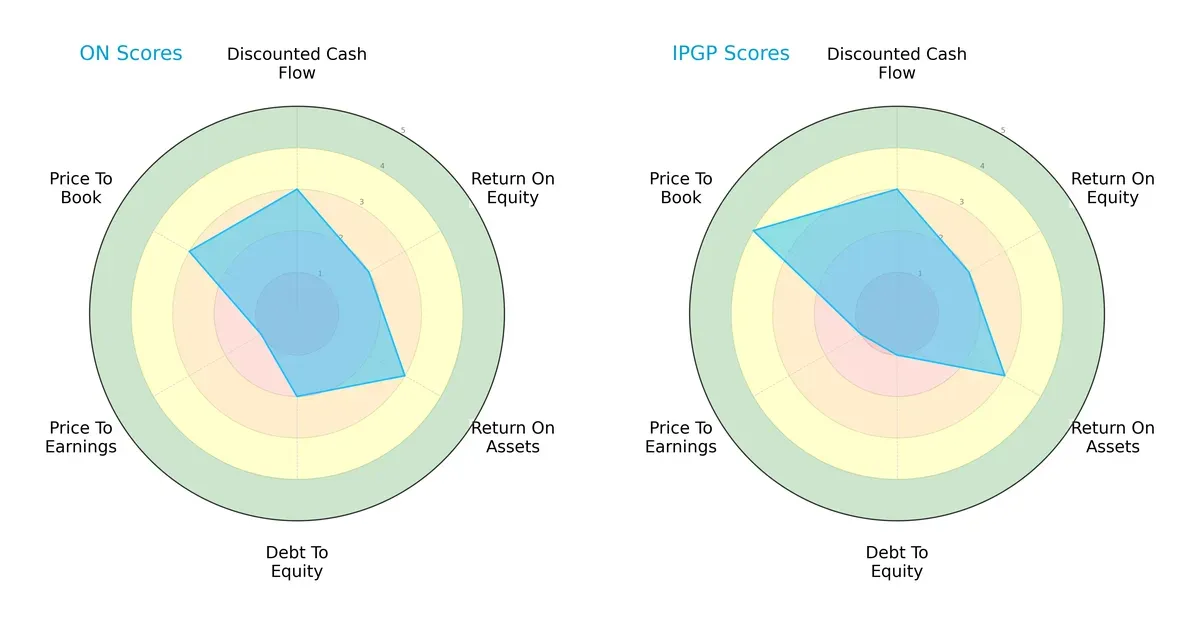
Both companies share moderate strengths in discounted cash flow and return on assets, demonstrating solid cash generation and asset efficiency. ON Semiconductor holds a slightly better debt-to-equity score, reflecting a more conservative leverage approach, while IPG Photonics excels in price-to-book valuation, signaling market favorability. However, both firms struggle with price-to-earnings ratios, indicating market skepticism on earnings potential. ON Semiconductor presents a more balanced profile, whereas IPG Photonics relies on a valuation edge via P/B.
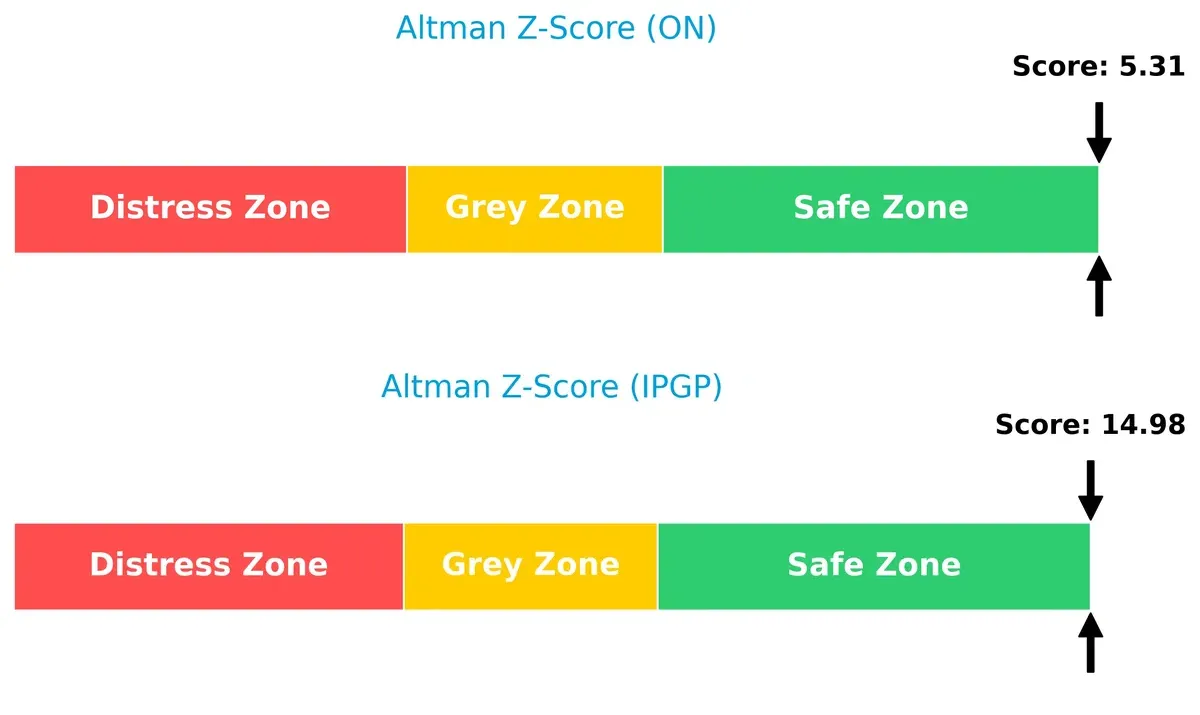
Bankruptcy Risk: Solvency Showdown
The Altman Z-Score gap between ON Semiconductor (5.31) and IPG Photonics (14.98) signals both companies reside comfortably in the safe zone, but IPG’s far higher score implies a stronger cushion against financial distress in this cycle:
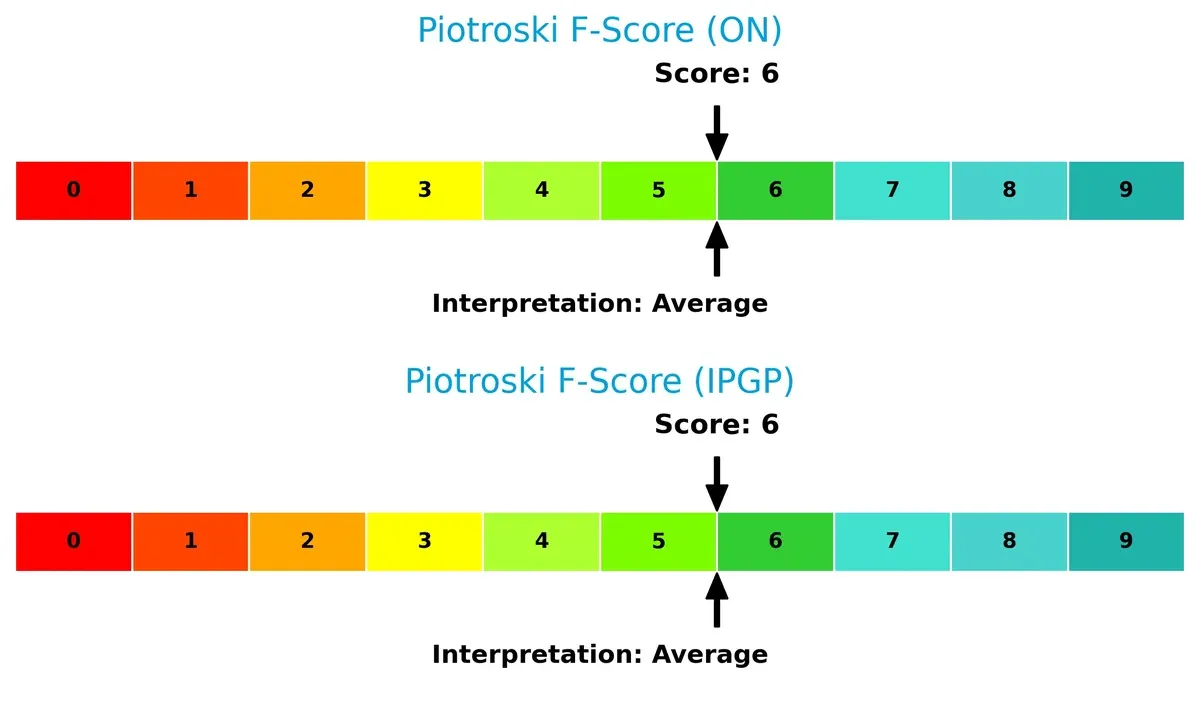
Financial Health: Quality of Operations
Both ON Semiconductor and IPG Photonics score a 6 on the Piotroski F-Score, indicating average financial health. Neither shows immediate red flags, but also no signs of peak operational strength or exceptional internal metrics:
How are the two companies positioned?
This section dissects ON and IPGP’s operational DNA by comparing their revenue distribution and internal dynamics—strengths and weaknesses. The goal is to confront their economic moats and identify which model offers the most resilient, sustainable competitive advantage today.
Revenue Segmentation: The Strategic Mix
This visual comparison dissects how ON Semiconductor Corporation and IPG Photonics Corporation diversify their income streams and where their primary sector bets lie:
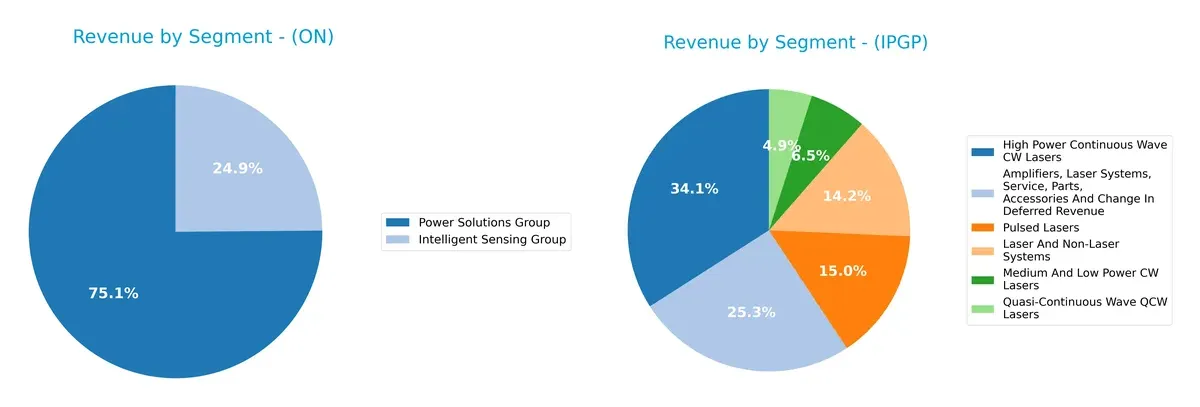
ON Semiconductor anchors its revenue in the Power Solutions Group with $2.81B in 2025, while Intelligent Sensing contributes $928M, showing moderate diversification. IPG Photonics relies heavily on High Power Continuous Wave Lasers and Amplifiers, Laser Systems, with $333M and $247M respectively in 2024, revealing a more fragmented but less balanced mix. ON’s concentration in power solutions suggests infrastructure dominance; IPG’s spread signals exposure to niche laser markets but with potential concentration risk.
Strengths and Weaknesses Comparison
This table compares the strengths and weaknesses of ON Semiconductor and IPG Photonics based on key financial and market factors:
ON Strengths
- Diversified revenue streams across multiple product groups
- Favorable debt-to-equity and debt-to-assets ratios indicate prudent financial leverage
- Quick ratio signals good short-term liquidity management
- Significant global presence with strong revenue from Asia and Europe
IPGP Strengths
- Favorable price-to-book ratio implies market undervaluation relative to book value
- Zero debt and infinite interest coverage highlight strong balance sheet resilience
- Favorable quick ratio suggests solid liquidity
- Global revenue spread with notable presence in China, North America, and Europe
ON Weaknesses
- Low net margin and return on equity reflect weak profitability
- High weighted average cost of capital exceeds return on invested capital
- Unfavorable price-to-earnings ratio and high current ratio suggest valuation and operational concerns
- Low asset turnover highlights inefficiency
IPGP Weaknesses
- Low return on invested capital compared to WACC indicates poor capital efficiency
- Unfavorable net margin and return on equity point to weak profitability
- Elevated current ratio may signal inefficient asset use
- High price-to-earnings ratio could imply overvaluation risks
ON Semiconductor’s strengths lie in its diversification and solid financial structure, but profitability and efficiency remain challenges. IPG Photonics boasts a strong balance sheet and favorable valuation metrics, yet struggles with profitability and capital efficiency. These factors shape each company’s strategic priorities in balancing growth and financial discipline.
The Moat Duel: Analyzing Competitive Defensibility
A structural moat is the only true shield protecting long-term profits from the relentless erosion of competition. Here’s how ON Semiconductor and IPG Photonics compare:
ON Semiconductor Corporation: Power Solutions with Cost Pressure
ON’s primary moat lies in cost advantage through scale in power semiconductors. Its shrinking ROIC and narrowing margins reveal mounting competitive pressure. New EV and solar markets might deepen the moat if innovation accelerates.
IPG Photonics Corporation: Laser Technology with High Entry Barriers
IPG’s moat stems from intangible assets and technology leadership in fiber lasers. Despite a steeper ROIC decline, it sustains superior gross margins versus ON. Expansion into medical and industrial laser segments could reinforce its niche dominance.
Verdict: Cost Efficiency vs. Technological Intangibles
Both firms suffer declining profitability, but IPG’s higher gross margin and specialized tech carve a deeper moat than ON’s cost-based edge. IPG appears better positioned to defend market share through innovation and niche control.
Which stock offers better returns?
The past year shows contrasting price movements between ON Semiconductor Corporation and IPG Photonics Corporation, with ON facing a bearish trend and IPG exhibiting strong bullish momentum.
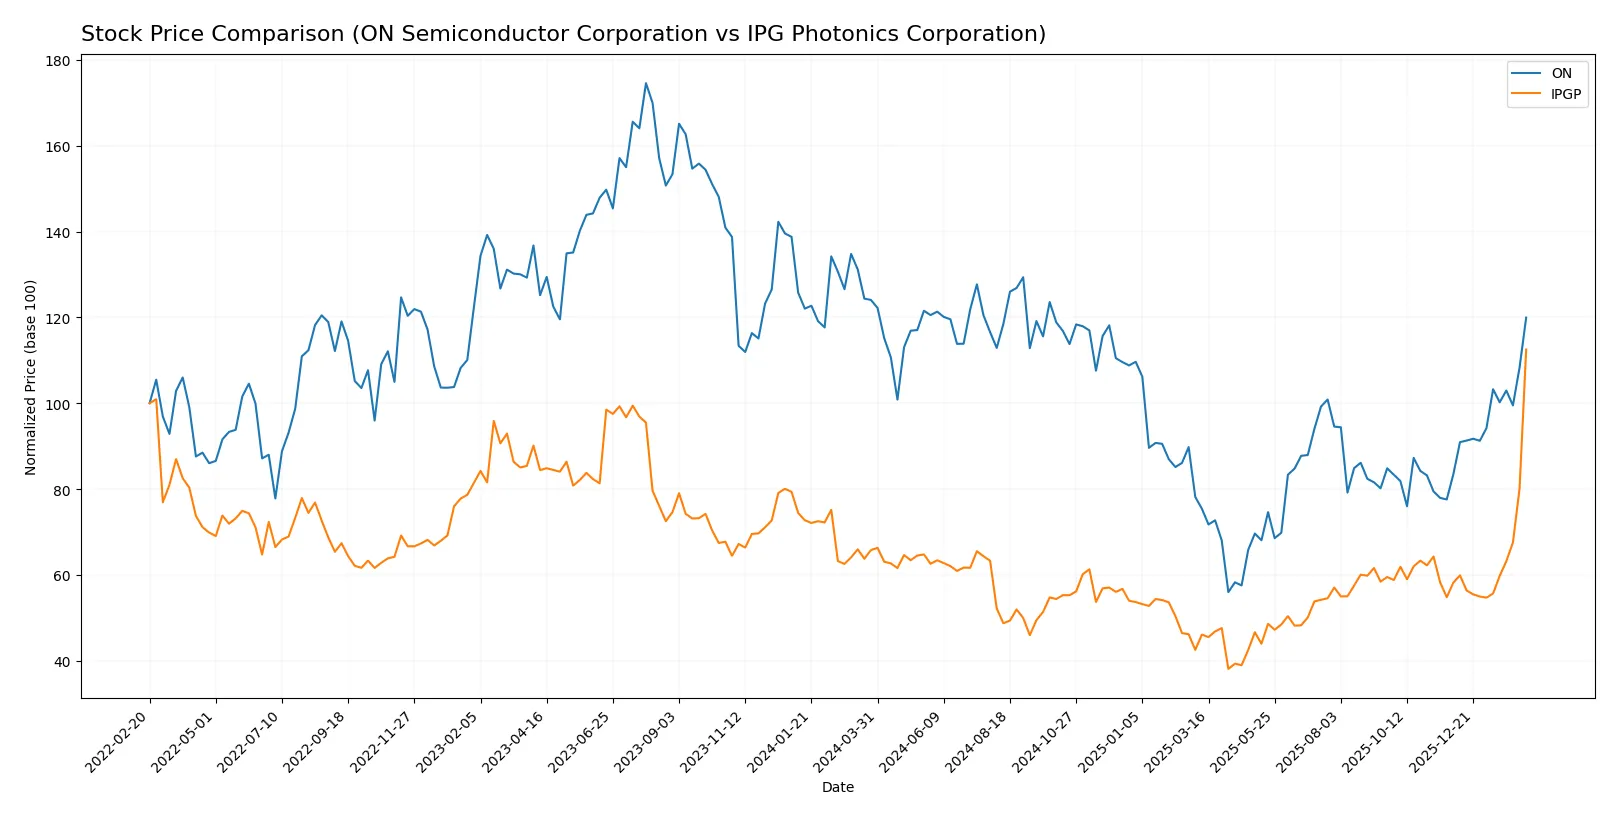
Trend Comparison
ON Semiconductor’s stock declined 3.31% over the past 12 months, indicating a bearish trend with accelerating downward momentum and a high price volatility of 11.47%. Its price ranged from 33.7 to 77.87.
IPG Photonics’ stock surged 71.01% over the same period, reflecting a bullish trend with accelerating gains and higher volatility at 12.46%. The stock reached a high of 153.91 and a low of 52.12.
IPG Photonics clearly outperformed ON Semiconductor, delivering the highest market return and stronger upward price acceleration during the analyzed year.
Target Prices
Analysts present a mixed but generally optimistic consensus for these semiconductor stocks.
| Company | Target Low | Target High | Consensus |
|---|---|---|---|
| ON Semiconductor Corporation | 51 | 75 | 62.4 |
| IPG Photonics Corporation | 110 | 180 | 151.67 |
ON Semiconductor’s consensus target of 62.4 sits below its current price of 72.21, suggesting limited upside or potential overvaluation. IPG Photonics’ consensus target of 151.67 slightly trails its current price of 153.91, indicating the market price closely aligns with analyst expectations.

Don’t Let Luck Decide Your Entry Point
Optimize your entry points with our advanced ProRealTime indicators. You’ll get efficient buy signals with precise price targets for maximum performance. Start outperforming now!
How do institutions grade them?
ON Semiconductor Corporation Grades
Here are the latest institutional grades for ON Semiconductor Corporation:
| Grading Company | Action | New Grade | Date |
|---|---|---|---|
| JP Morgan | Maintain | Neutral | 2026-02-10 |
| Citigroup | Maintain | Neutral | 2026-02-10 |
| Wells Fargo | Maintain | Overweight | 2026-02-10 |
| Benchmark | Downgrade | Hold | 2026-02-10 |
| Truist Securities | Maintain | Hold | 2026-02-10 |
| Cantor Fitzgerald | Maintain | Neutral | 2026-02-10 |
| Rosenblatt | Maintain | Neutral | 2026-02-10 |
| Piper Sandler | Maintain | Overweight | 2026-02-10 |
| Keybanc | Maintain | Overweight | 2026-02-10 |
| Mizuho | Maintain | Outperform | 2026-02-10 |
IPG Photonics Corporation Grades
Below are current institutional grades for IPG Photonics Corporation:
| Grading Company | Action | New Grade | Date |
|---|---|---|---|
| Stifel | Maintain | Buy | 2026-02-13 |
| Raymond James | Downgrade | Outperform | 2026-02-13 |
| Roth Capital | Maintain | Buy | 2026-02-03 |
| Citigroup | Upgrade | Buy | 2025-11-05 |
| Bernstein | Upgrade | Outperform | 2025-08-07 |
| Raymond James | Maintain | Strong Buy | 2025-05-07 |
| CL King | Upgrade | Buy | 2025-03-18 |
| Citigroup | Maintain | Sell | 2025-02-18 |
| Needham | Maintain | Hold | 2025-02-12 |
| Stifel | Maintain | Buy | 2025-02-12 |
Which company has the best grades?
IPG Photonics holds generally more favorable grades, including multiple Buy and Outperform ratings. ON Semiconductor’s grades cluster around Neutral and Hold, with fewer strong Buy or Outperform endorsements. Investors may perceive IPG as having greater institutional confidence.
Risks specific to each company
The following categories identify critical pressure points and systemic threats facing ON Semiconductor Corporation and IPG Photonics Corporation in the 2026 market environment:
1. Market & Competition
ON Semiconductor Corporation
- Faces intense competition in analog and power semiconductors with pressure on net margins.
IPG Photonics Corporation
- Operates in niche fiber laser markets but sees rising competitive pressure from new laser technologies.
2. Capital Structure & Debt
ON Semiconductor Corporation
- Maintains moderate leverage with debt-to-assets at 27.7%, manageable but warrants caution given coverage ratio.
IPG Photonics Corporation
- Debt-free balance sheet, offering strong financial flexibility and minimal solvency risk.
3. Stock Volatility
ON Semiconductor Corporation
- Beta of 1.54 indicates higher volatility than the market, increasing investor risk.
IPG Photonics Corporation
- Lower beta of 1.03 suggests more stable stock price movements relative to the market.
4. Regulatory & Legal
ON Semiconductor Corporation
- Subject to semiconductor export controls and environmental regulations impacting production costs.
IPG Photonics Corporation
- Faces regulatory scrutiny in materials processing and communications sectors, with evolving compliance demands.
5. Supply Chain & Operations
ON Semiconductor Corporation
- Exposure to global semiconductor supply chain disruptions affects production timelines and costs.
IPG Photonics Corporation
- Relies on specialized components; supply chain risks are mitigated by smaller scale but remain impactful.
6. ESG & Climate Transition
ON Semiconductor Corporation
- Invests in power-efficient technologies supporting electrification and sustainability but faces pressure to meet ESG targets.
IPG Photonics Corporation
- ESG efforts focus on energy-efficient laser solutions; climate transition risks are moderate but increasing.
7. Geopolitical Exposure
ON Semiconductor Corporation
- US-based with global sales; trade tensions and export restrictions to China pose material risks.
IPG Photonics Corporation
- Predominantly US operations with less global exposure, reducing geopolitical vulnerability.
Which company shows a better risk-adjusted profile?
ON Semiconductor’s biggest risk is market volatility and competitive pressure squeezing low net margins. IPG Photonics faces its greatest risk in a highly specialized market with limited diversification but benefits from zero debt and lower stock volatility. Both show slightly unfavorable financial ratios, but IPG’s pristine balance sheet and stable beta offer a better risk-adjusted profile. Notably, ON’s beta at 1.54 signals amplified market risk in a turbulent semiconductor cycle, justifying heightened caution.
Final Verdict: Which stock to choose?
ON Semiconductor’s superpower lies in its robust liquidity and disciplined capital structure, supporting resilience amid industry cyclicality. However, its declining profitability and value destruction remain points of vigilance. ON might suit aggressive growth portfolios willing to navigate volatility for potential turnaround gains.
IPG Photonics leverages a strategic moat in advanced laser technology and recurring revenue streams, underpinning steady cash flow generation. Compared to ON, it offers better balance sheet safety but faces challenges in profitability sustainability. IPG appeals to GARP investors seeking growth with moderate risk.
If you prioritize turnaround potential and are comfortable with higher volatility, ON Semiconductor stands out due to its operational resilience and liquidity cushion. However, if you seek stability with a technological moat and consistent cash flow, IPG Photonics offers better stability despite recent profitability headwinds. Both require cautious risk management in today’s market context.
Disclaimer: Investment carries a risk of loss of initial capital. The past performance is not a reliable indicator of future results. Be sure to understand risks before making an investment decision.
Go Further
I encourage you to read the complete analyses of ON Semiconductor Corporation and IPG Photonics Corporation to enhance your investment decisions: