Home > Comparison > Technology > NXPI vs IPGP
The strategic rivalry between NXP Semiconductors and IPG Photonics defines the current trajectory of the semiconductor industry. NXP operates as a broad-based technology powerhouse, specializing in microcontrollers and connectivity solutions across automotive and IoT sectors. In contrast, IPG focuses on high-performance fiber lasers, carving a niche in materials processing and communications. This analysis evaluates which company’s operational model offers superior risk-adjusted returns for a diversified portfolio.
Table of contents
Companies Overview
NXP Semiconductors and IPG Photonics drive innovation in the semiconductor industry with distinct market approaches.
NXP Semiconductors N.V.: Semiconductor Solutions Powerhouse
NXP Semiconductors dominates the semiconductor market with a broad portfolio including microcontrollers, application processors, and wireless connectivity solutions. Its revenue comes primarily from supplying automotive, industrial, and IoT sectors. In 2026, NXP focuses strategically on expanding its security controllers and next-gen communication processors to capture growth in connected devices worldwide.
IPG Photonics Corporation: Fiber Laser Technology Leader
IPG Photonics specializes in high-performance fiber lasers and amplifiers, generating revenue through materials processing, communications, and medical applications. The company prioritizes innovation in integrated laser systems and advanced fiber laser solutions. Its 2026 strategy centers on enhancing multi-axis laser systems and expanding market penetration in industrial manufacturing and telecommunications.
Strategic Collision: Similarities & Divergences
Both companies operate in semiconductors but embrace different philosophies—NXP favors a broad ecosystem of semiconductor devices, while IPG zeroes in on specialized fiber laser technology. Their primary battleground lies in industrial applications, where NXP’s connectivity chips compete indirectly with IPG’s laser manufacturing tools. Their investment profiles diverge sharply: NXP offers scale and diversification, IPG delivers niche innovation and high-margin specialization.
Income Statement Comparison
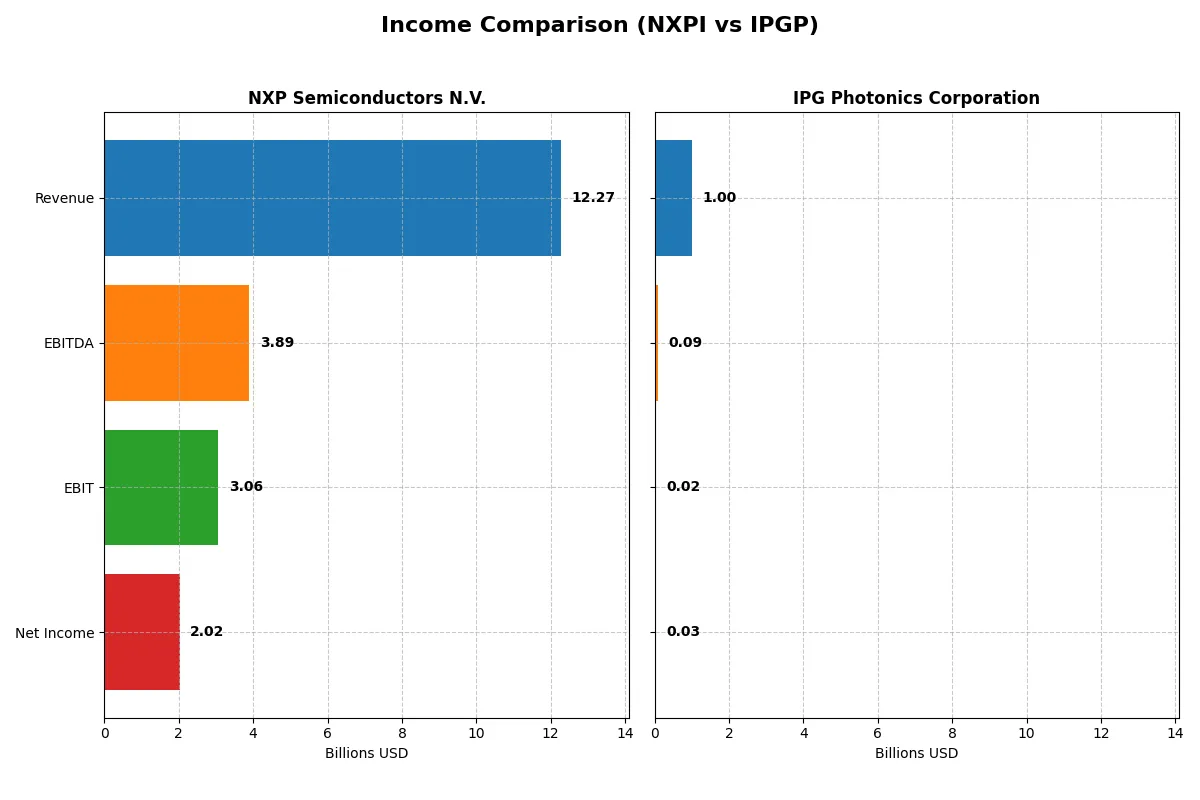
This data dissects the core profitability and scalability of both corporate engines to reveal who dominates the bottom line:
| Metric | NXP Semiconductors N.V. (NXPI) | IPG Photonics Corporation (IPGP) |
|---|---|---|
| Revenue | 12.3B | 1.0B |
| Cost of Revenue | 5.6B | 622M |
| Operating Expenses | 3.4B | 368M |
| Gross Profit | 6.7B | 381M |
| EBITDA | 3.9B | 90M |
| EBIT | 3.1B | 23M |
| Interest Expense | 384M | 0 |
| Net Income | 2.0B | 31M |
| EPS | 8.00 | 0.73 |
| Fiscal Year | 2025 | 2025 |
Income Statement Analysis: The Bottom-Line Duel
This income statement comparison will reveal which company operates its core business with greater efficiency and profitability.
NXP Semiconductors N.V. Analysis
NXP Semiconductors shows steady revenue growth over five years, reaching $12.3B in 2025 despite a slight 2.7% decline from 2024. Net income follows a similar pattern, currently at $2.0B. The company maintains healthy gross and net margins of 54.4% and 16.5%, respectively, reflecting operational strength even amid recent margin contraction.
IPG Photonics Corporation Analysis
IPG Photonics’ revenue shrank by 31% over five years but edged up 2.7% in 2025 to $1.0B. Net income rebounded sharply from a loss in 2024 to $31M in 2025. Its gross margin stands at 38%, while net margin remains slim at 3.1%. The significant net margin growth signals improving profitability momentum despite ongoing scale challenges.
Margin Strength vs. Recovery Momentum
NXP dominates in scale, margin health, and consistent profitability, delivering a robust income statement despite minor recent setbacks. IPG shows impressive margin recovery and earnings turnaround but from a much smaller base and with a weaker overall revenue trend. For investors prioritizing steady profit power and scale, NXP presents a more compelling profile.
Financial Ratios Comparison
These vital ratios act as a diagnostic tool to expose the underlying fiscal health, valuation premiums, and capital efficiency of each company:
| Ratios | NXP Semiconductors N.V. (NXPI) | IPG Photonics Corporation (IPGP) |
|---|---|---|
| ROE | 20.10% | 1.46% |
| ROIC | 11.03% | 0.41% |
| P/E | 27.14 | 98.08 |
| P/B | 5.45 | 1.43 |
| Current Ratio | 2.05 | 6.08 |
| Quick Ratio | 1.38 | 4.74 |
| D/E (Debt-to-Equity) | 1.22 | 0.00 |
| Debt-to-Assets | 46.02% | 0.00% |
| Interest Coverage | 8.62 | 0.00 |
| Asset Turnover | 0.46 | 0.41 |
| Fixed Asset Turnover | 4.12 | 1.57 |
| Payout Ratio | 50.72% | 0.00% |
| Dividend Yield | 1.87% | 0.00% |
| Fiscal Year | 2025 | 2025 |
Efficiency & Valuation Duel: The Vital Signs
Ratios act as a company’s DNA, revealing hidden risks and operational excellence essential for sound investment decisions.
NXP Semiconductors N.V.
NXP demonstrates robust profitability with a 20.1% ROE and a solid 16.47% net margin, reflecting operational strength. The stock appears stretched at a 27.14 P/E and 5.45 P/B, indicating premium valuation. Shareholders benefit from a 1.87% dividend yield, balancing returns with ongoing R&D investment near 18% of revenue.
IPG Photonics Corporation
IPG struggles with weak profitability, posting a 1.46% ROE and a thin 3.1% net margin. Its valuation is highly stretched, with a 98.08 P/E, despite a modest 1.43 P/B. The company pays no dividends, instead maintaining a strong liquidity position and reinvesting modestly in R&D at about 12% of revenue.
Premium Valuation vs. Operational Safety
NXP offers a better balance of profitability and shareholder returns despite its premium valuation. IPG’s weak profitability and sky-high P/E pose higher risks. Investors seeking operational resilience and steady dividends may favor NXP, while those tolerating volatility might consider IPG’s growth potential.
Which one offers the Superior Shareholder Reward?
I compare NXP Semiconductors N.V. (NXPI) and IPG Photonics Corporation (IPGP) on dividends, buybacks, and sustainability for 2026. NXPI pays a 1.87% dividend yield with a 51% payout ratio, backed by strong free cash flow (9.6B). Its buyback program adds to returns. IPGP pays no dividend and shows a negative free cash flow. It reinvests heavily in R&D and growth, but its profitability and cash flow remain weak. NXPI’s balanced dividend and buybacks offer a more durable total return, while IPGP’s model carries higher risk. I favor NXPI for superior shareholder reward in 2026.
Comparative Score Analysis: The Strategic Profile
The radar chart reveals the fundamental DNA and trade-offs of NXP Semiconductors and IPG Photonics, highlighting their core financial strengths and vulnerabilities:
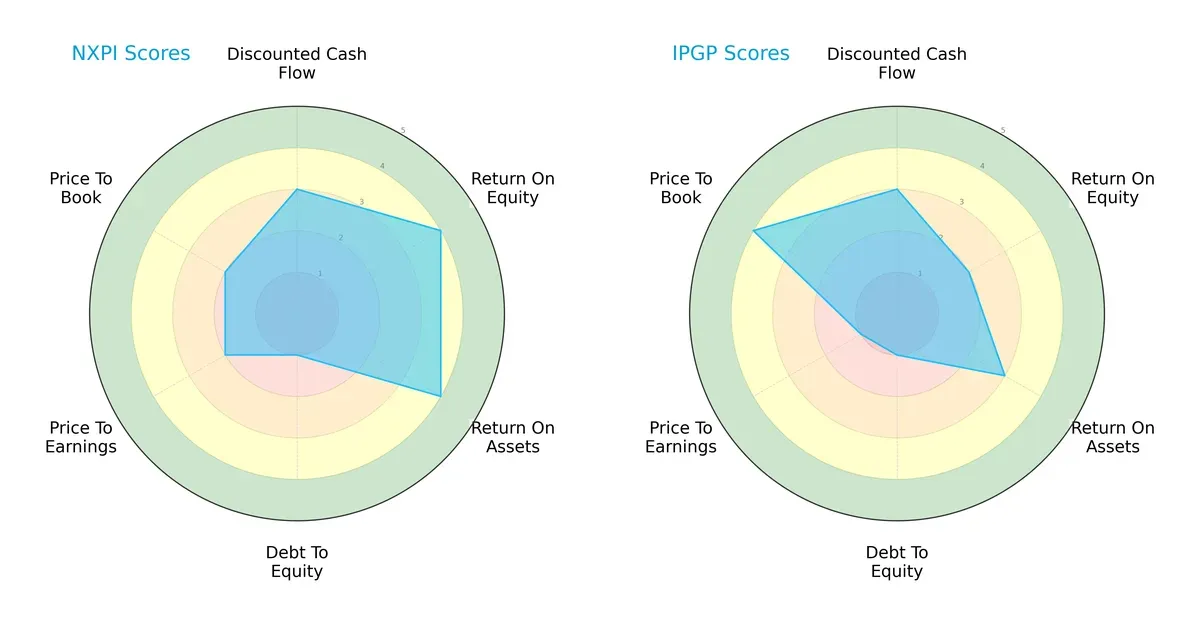
NXP Semiconductors shows a balanced profile with strong ROE (4) and ROA (4) scores, signaling efficient profit generation and asset use. However, its debt-to-equity score is very unfavorable (1), indicating leverage risk. IPG Photonics relies more on valuation edges, with a favorable price-to-book score (4) but weaker profitability scores (ROE 2, ROA 3). NXP dominates operational efficiency, while IPG leans on market valuation advantages.
Bankruptcy Risk: Solvency Showdown
The Altman Z-Score gap signals differing financial resilience:
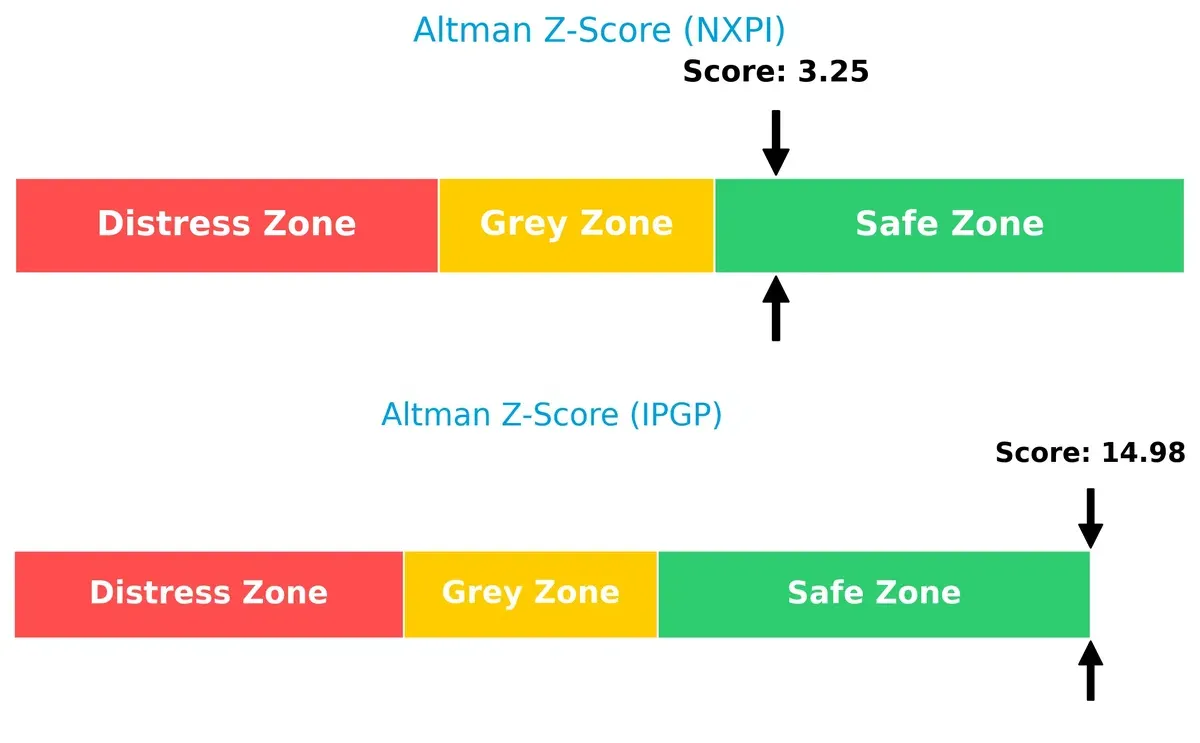
IPG Photonics scores an exceptionally safe 15.0, indicating robust solvency and minimal bankruptcy risk. NXP Semiconductors sits in the safe zone at 3.3 but much closer to distress thresholds, reflecting moderate financial leverage concerns amid current market volatility.
Financial Health: Quality of Operations
Piotroski F-Scores show operational quality and risk flags:
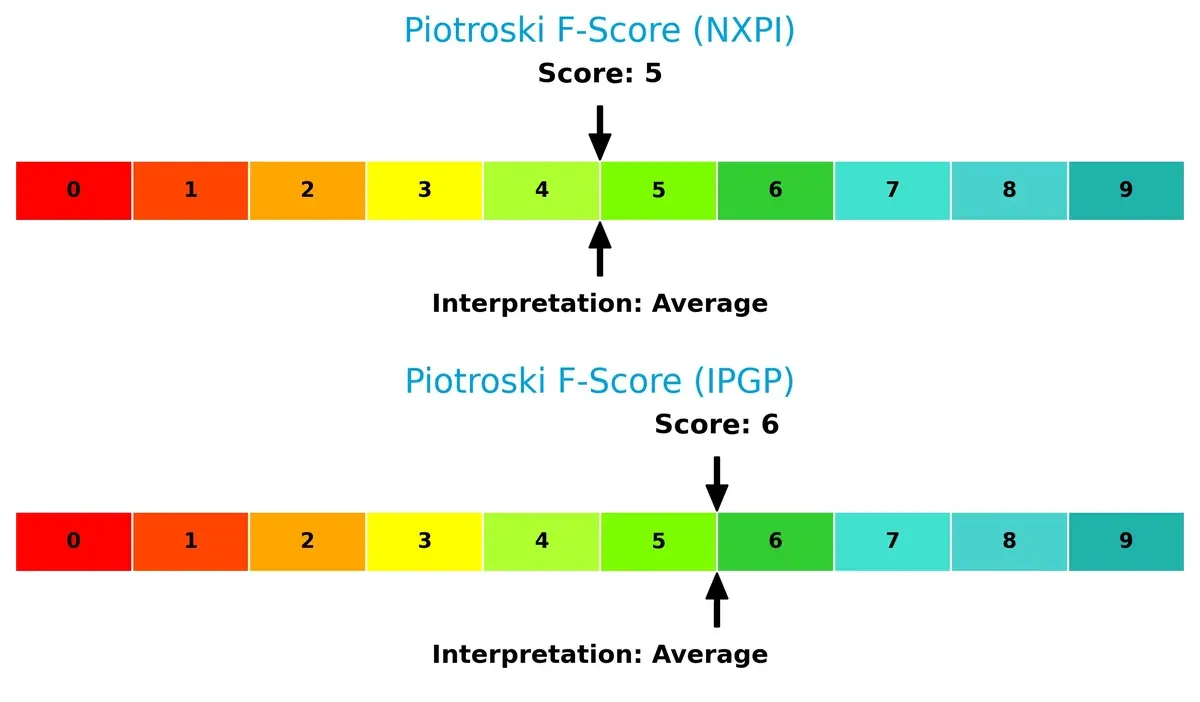
Both firms present average financial health with scores of 5 (NXP) and 6 (IPG). Neither exhibits peak strength, but NXP’s lower score suggests marginally weaker internal metrics. Investors should note that neither company currently signals severe red flags but ongoing scrutiny of operational efficiency is prudent.
How are the two companies positioned?
This section dissects the operational DNA of NXPI and IPGP by comparing their revenue distribution and internal dynamics—strengths and weaknesses. The goal is to confront their economic moats to identify which business model offers the most resilient, sustainable competitive advantage today.
Revenue Segmentation: The Strategic Mix
This visual comparison dissects how NXP Semiconductors N.V. and IPG Photonics Corporation diversify their income streams and where their primary sector bets lie:
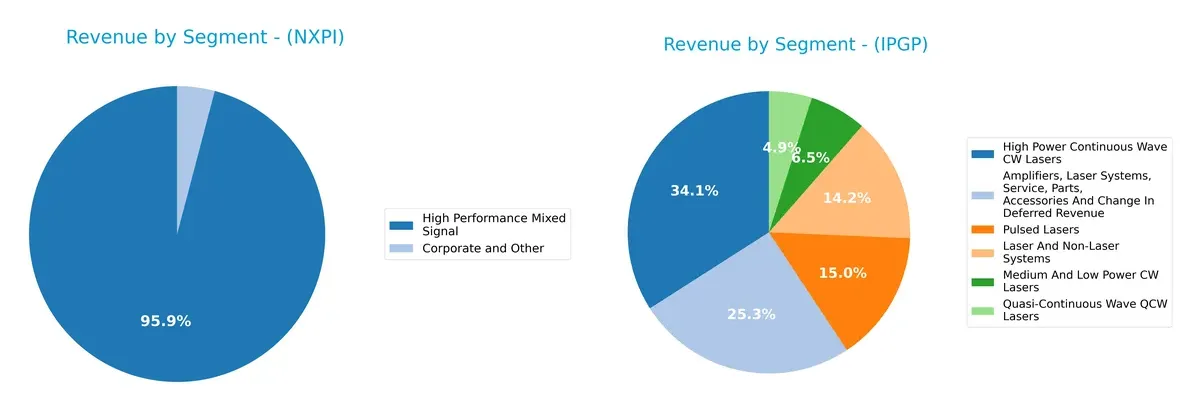
NXP anchors its revenue primarily in High Performance Mixed Signal, generating $9B in 2018, dwarfing Corporate and Other at $385M. This concentration signals a strong moat in mixed-signal semiconductors but presents concentration risk. IPG Photonics displays a more diversified model, with no single dominant segment; its largest category, High Power Continuous Wave Lasers, reached $333M in 2024. This spread mitigates risk and reflects strategic flexibility across laser technologies.
Strengths and Weaknesses Comparison
This table compares the Strengths and Weaknesses of NXP Semiconductors (NXPI) and IPG Photonics (IPGP):
NXPI Strengths
- Strong profitability with 16.47% net margin
- High ROE of 20.1%
- Favorable ROIC above WACC at 11.03%
- Solid liquidity ratios, current ratio 2.05 and quick ratio 1.38
- Global presence in major markets including China, US, and Europe
- Diversified revenue in high performance mixed signal and corporate segments
IPGP Strengths
- Debt-free balance sheet with zero debt-to-assets
- Excellent interest coverage, effectively infinite
- Favorable quick ratio at 4.74
- Diversified product range including multiple laser systems
- Geographic diversification across North America, Europe, and Asia
- Lower PB ratio indicating relative valuation appeal
NXPI Weaknesses
- Elevated valuation multiples with PE 27.14 and PB 5.45
- Higher leverage with debt-to-equity at 1.22
- Relatively low asset turnover at 0.46
- Neutral debt-to-assets at 46% signals moderate financial risk
- Dividend yield moderate at 1.87%
- Standard products segment declining to zero revenue
IPGP Weaknesses
- Low profitability metrics: net margin 3.1%, ROE 1.46%, ROIC 0.41% below WACC
- Very high PE ratio at 98.08 indicating overvaluation
- Extremely high current ratio 6.08 may indicate inefficient asset use
- No dividend yield
- Lower fixed asset turnover at 1.57
- Slightly unfavorable overall financial ratio profile
NXPI’s strengths stem from robust profitability and a balanced global footprint but face risks from high leverage and valuation. IPGP benefits from a clean balance sheet and product variety but struggles with profitability and high valuation, posing strategic challenges.
The Moat Duel: Analyzing Competitive Defensibility
A structural moat is the only barrier protecting long-term profits from relentless competition erosion. Let’s dissect the moats of these two semiconductor players:
NXP Semiconductors N.V.: Intangible Assets and Broad Market Reach
NXP leverages deep intangible assets and broad geographic diversification, reflected in stable gross margins near 54%. Its declining ROIC signals pressure, but new IoT and automotive chips could reinforce its moat in 2026.
IPG Photonics Corporation: Technological Innovation in Fiber Lasers
IPG’s moat is rooted in specialized fiber laser technology, contrasting NXP’s scale. Despite a weaker margin profile, IPG’s recent sharp EBIT and net margin growth showcase its innovation-driven competitive edge. Expansion in advanced manufacturing offers growth avenues.
Verdict: Intangible Assets vs. Niche Innovation Moats
NXP’s wider, geographically diversified intangible asset moat currently outpaces IPG’s niche technology moat. However, IPG’s innovation trajectory could disrupt markets if it sustains growth. For now, NXP is better positioned to defend market share amid intensifying competition.
Which stock offers better returns?
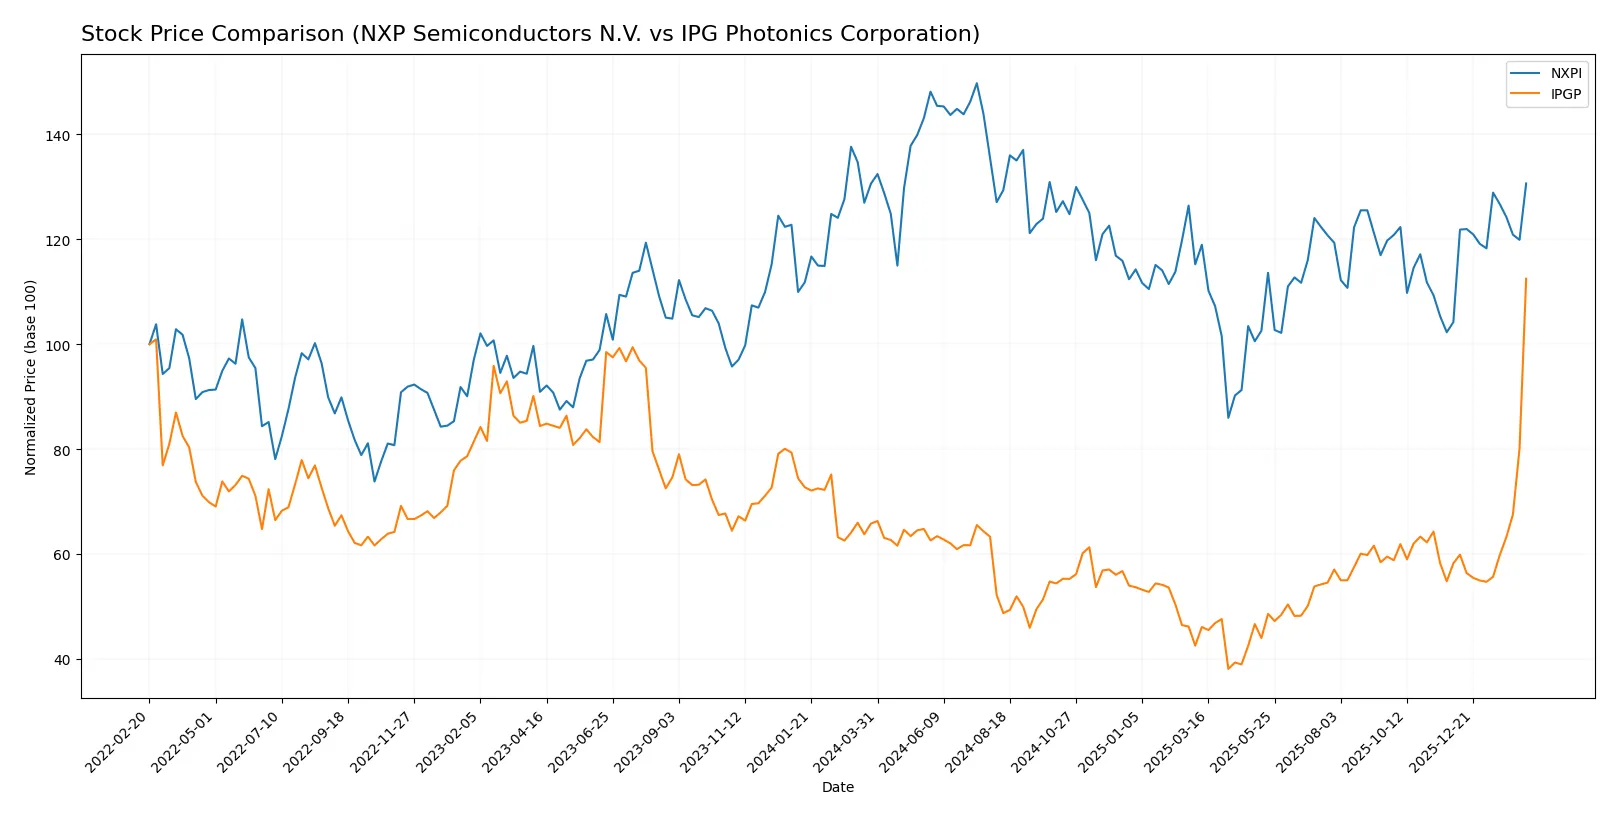
The past year shows marked price advances for both NXP Semiconductors and IPG Photonics, with distinct momentum and trading volume patterns shaping their respective trends.
Trend Comparison
NXP Semiconductors’ stock price rose marginally by 0.04% over the past year, signaling a bullish trend with accelerating momentum. Its price fluctuated between 160.81 and 280.19, showing moderate volatility (std dev 24.14).
IPG Photonics’ stock surged 71.01% over the same period, exhibiting a strong bullish trend with acceleration. The price ranged from 52.12 to 153.91, with lower volatility (std dev 12.46) than NXPI.
Comparatively, IPG Photonics delivered substantially higher returns and stronger upward momentum than NXP Semiconductors over the past year.
Target Prices
Analysts present a balanced target price consensus for NXP Semiconductors N.V. and IPG Photonics Corporation, reflecting cautious optimism.
| Company | Target Low | Target High | Consensus |
|---|---|---|---|
| NXP Semiconductors N.V. | 215 | 280 | 250 |
| IPG Photonics Corporation | 110 | 180 | 151.67 |
The consensus target for NXP (250) sits modestly above its current price (244.43), implying limited upside. IPG’s consensus (151.67) closely matches its current price (153.91), signaling a market expectation of stability.

Don’t Let Luck Decide Your Entry Point
Optimize your entry points with our advanced ProRealTime indicators. You’ll get efficient buy signals with precise price targets for maximum performance. Start outperforming now!
How do institutions grade them?
NXP Semiconductors N.V. Grades
Here are the latest institutional grades for NXP Semiconductors N.V.:
| Grading Company | Action | New Grade | Date |
|---|---|---|---|
| Evercore ISI Group | Maintain | Outperform | 2026-02-04 |
| Citigroup | Maintain | Buy | 2026-02-04 |
| Mizuho | Maintain | Outperform | 2026-02-04 |
| B of A Securities | Maintain | Buy | 2026-02-04 |
| Truist Securities | Maintain | Buy | 2026-02-04 |
| JP Morgan | Maintain | Neutral | 2026-02-04 |
| Needham | Maintain | Buy | 2026-02-03 |
| Citigroup | Maintain | Buy | 2026-01-15 |
| Wells Fargo | Maintain | Overweight | 2026-01-15 |
| Truist Securities | Maintain | Buy | 2025-12-19 |
IPG Photonics Corporation Grades
Below are the current institutional grades for IPG Photonics Corporation:
| Grading Company | Action | New Grade | Date |
|---|---|---|---|
| Stifel | Maintain | Buy | 2026-02-13 |
| Raymond James | Downgrade | Outperform | 2026-02-13 |
| Roth Capital | Maintain | Buy | 2026-02-03 |
| Citigroup | Upgrade | Buy | 2025-11-05 |
| Bernstein | Upgrade | Outperform | 2025-08-07 |
| Raymond James | Maintain | Strong Buy | 2025-05-07 |
| CL King | Upgrade | Buy | 2025-03-18 |
| Citigroup | Maintain | Sell | 2025-02-18 |
| Needham | Maintain | Hold | 2025-02-12 |
| Stifel | Maintain | Buy | 2025-02-12 |
Which company has the best grades?
NXP Semiconductors consistently holds strong Buy and Outperform ratings, reflecting steady confidence. IPG Photonics shows more variability, including a Sell and a recent downgrade. NXP’s more uniform positive grades suggest clearer institutional endorsement, potentially reducing investor uncertainty.
Risks specific to each company
The following categories identify the critical pressure points and systemic threats facing both firms in the 2026 market environment:
1. Market & Competition
NXP Semiconductors N.V.
- Faces intense competition in semiconductors with pressure on margins and innovation cycles.
IPG Photonics Corporation
- Operates in niche laser technology but faces rising competition and market penetration challenges.
2. Capital Structure & Debt
NXP Semiconductors N.V.
- Carries moderate leverage with a debt-to-equity ratio of 1.22, raising financial risk.
IPG Photonics Corporation
- Maintains zero debt, indicating strong financial stability and low leverage risk.
3. Stock Volatility
NXP Semiconductors N.V.
- Beta of 1.458 signals higher volatility than the market, increasing investment risk.
IPG Photonics Corporation
- Beta of 1.028 shows near-market volatility, suggesting more stable stock behavior.
4. Regulatory & Legal
NXP Semiconductors N.V.
- Exposed to semiconductor export controls and IP litigation risks globally.
IPG Photonics Corporation
- Faces regulatory scrutiny related to laser technology safety and export restrictions.
5. Supply Chain & Operations
NXP Semiconductors N.V.
- Complex global supply chain with exposure to geopolitical tensions and component shortages.
IPG Photonics Corporation
- More concentrated supply chain but vulnerable to raw material availability and manufacturing delays.
6. ESG & Climate Transition
NXP Semiconductors N.V.
- Increasing pressure to reduce carbon footprint in manufacturing and comply with ESG standards.
IPG Photonics Corporation
- Faces rising expectations for sustainable production and energy-efficient laser technologies.
7. Geopolitical Exposure
NXP Semiconductors N.V.
- Significant exposure to China and Europe, heightening risk from trade tensions and sanctions.
IPG Photonics Corporation
- Primarily US-based but dependent on international sales, vulnerable to geopolitical trade barriers.
Which company shows a better risk-adjusted profile?
NXP’s most impactful risk is its high stock volatility and leverage, which can amplify market shocks. IPG’s critical risk lies in its weak profitability despite zero debt, reflecting operational challenges. Despite financial leverage concerns, NXP’s diversified operations and average Piotroski score suggest a stronger risk-adjusted profile. The sharp contrast in net margins—16.5% for NXP versus 3.1% for IPG—justifies concern for IPG’s earnings sustainability.
Final Verdict: Which stock to choose?
NXP Semiconductors’ superpower lies in its robust operational efficiency and strong profitability metrics. It maintains a solid balance sheet despite some caution warranted by its relatively high leverage. This stock suits investors with an appetite for aggressive growth backed by steady cash flow generation.
IPG Photonics boasts a strategic moat centered on its niche technology and superior balance sheet strength, highlighted by zero debt and excellent liquidity. It offers a safer profile compared to NXP, appealing to growth-at-a-reasonable-price (GARP) investors who value stability alongside potential upside.
If you prioritize operational efficiency and growth momentum, NXP outshines with its consistent profitability and market presence. However, if you seek financial safety and a niche technological moat, IPG offers better stability despite weaker profitability. Both present distinct analytical scenarios aligned with different investor risk tolerances.
Disclaimer: Investment carries a risk of loss of initial capital. The past performance is not a reliable indicator of future results. Be sure to understand risks before making an investment decision.
Go Further
I encourage you to read the complete analyses of NXP Semiconductors N.V. and IPG Photonics Corporation to enhance your investment decisions: