In the rapidly evolving semiconductor industry, NVIDIA Corporation and IPG Photonics Corporation stand out as innovators with distinct yet overlapping market footprints. NVIDIA leads in graphics processing and AI computing platforms, while IPG Photonics specializes in advanced fiber laser technologies. Both companies drive technological progress but through different approaches. This article will analyze their strengths and risks to help you decide which stock might best suit your investment portfolio.
Table of contents
Companies Overview
I will begin the comparison between NVIDIA Corporation and IPG Photonics Corporation by providing an overview of these two companies and their main differences.
NVIDIA Overview
NVIDIA Corporation, headquartered in Santa Clara, California, specializes in providing graphics, compute, and networking solutions globally. Its product portfolio includes GPUs for gaming and professional visualization, AI and data center platforms, automotive infotainment, and virtual computing software. NVIDIA serves diverse markets such as gaming, automotive, and data centers, positioning itself as a leader in high-performance semiconductors with a market cap exceeding 4.4T USD.
IPG Photonics Overview
IPG Photonics Corporation, based in Marlborough, Massachusetts, develops and manufactures high-performance fiber lasers, amplifiers, and diode lasers primarily for materials processing and telecommunications. Its products range from fiber laser systems to optical transceivers used in advanced applications including medical and communications sectors. With a market cap of about 3.3B USD, IPG focuses on fiber-optic technology and laser system integration worldwide.
Key similarities and differences
Both companies operate within the semiconductor industry and serve technology-driven markets with specialized hardware. However, NVIDIA emphasizes graphics processing, AI, and computing platforms across multiple sectors, while IPG Photonics concentrates on fiber laser technology and optical communications. NVIDIA’s market value and employee base are significantly larger, reflecting broader product diversification and global reach compared to IPG’s more focused laser and amplifier solutions.
Income Statement Comparison
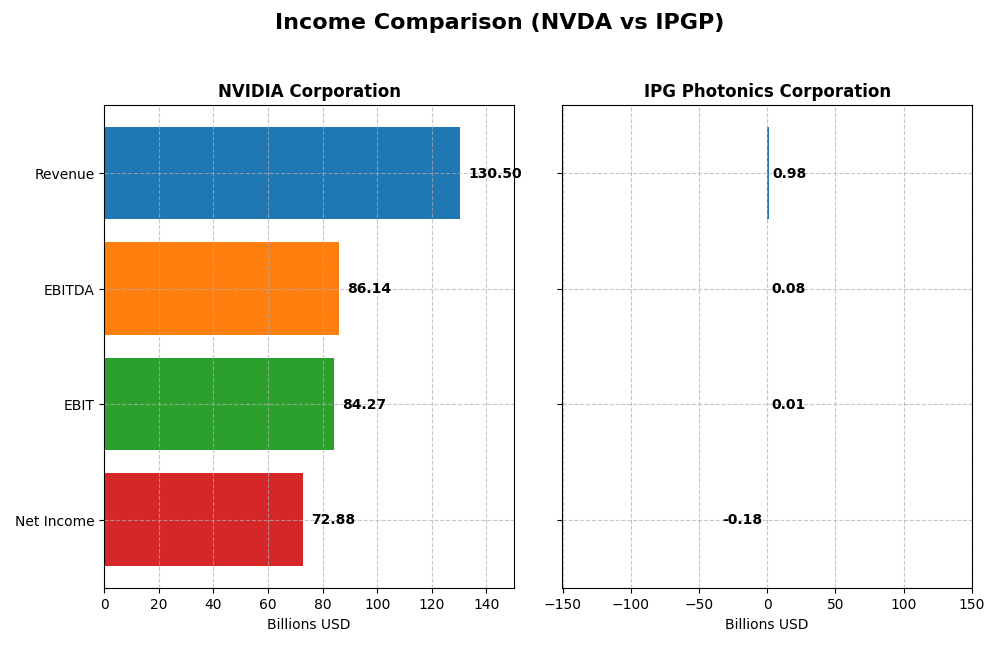
This table presents a side-by-side comparison of the most recent fiscal year income statement metrics for NVIDIA Corporation and IPG Photonics Corporation.
| Metric | NVIDIA Corporation | IPG Photonics Corporation |
|---|---|---|
| Market Cap | 4.46T | 3.27B |
| Revenue | 130.5B | 977M |
| EBITDA | 86.1B | 76M |
| EBIT | 84.3B | 14M |
| Net Income | 72.9B | -182M |
| EPS | 2.97 | -4.09 |
| Fiscal Year | 2025 | 2024 |
Income Statement Interpretations
NVIDIA Corporation
NVIDIA has demonstrated strong revenue and net income growth from 2021 to 2025, with revenue rising from $16.7B to $130.5B and net income surging from $4.3B to $72.9B. Margins have shown consistent improvement, with a gross margin near 75% and a net margin over 55% in 2025. The latest year saw exceptional growth, with revenue more than doubling and net margin expanding, reflecting robust operational efficiency.
IPG Photonics Corporation
IPG Photonics experienced declining revenue from $1.46B in 2021 to $977M in 2024, with net income turning negative at -$182M in 2024 from a positive $278M in 2021. Gross margin remained moderate around 35%, but net margin deteriorated sharply into negative territory. The most recent fiscal year showed substantial contraction in revenue and profitability, indicating challenges in maintaining operational profitability and growth.
Which one has the stronger fundamentals?
NVIDIA clearly exhibits stronger fundamentals with consistently favorable margin trends, significant revenue and net income growth, and a solid profitability profile. Conversely, IPG Photonics faces unfavorable income statement trends, including declining revenues, negative net margins, and shrinking earnings. Based on these income statement metrics alone, NVIDIA’s financial health appears substantially more robust.
Financial Ratios Comparison
The table below presents a side-by-side comparison of the most recent key financial ratios for NVIDIA Corporation and IPG Photonics Corporation based on their latest fiscal year data.
| Ratios | NVIDIA Corporation (2025) | IPG Photonics Corporation (2024) |
|---|---|---|
| ROE | 91.87% | -8.97% |
| ROIC | 75.28% | -9.97% |
| P/E | 39.90 | -17.76 |
| P/B | 36.66 | 1.59 |
| Current Ratio | 4.44 | 6.98 |
| Quick Ratio | 3.88 | 5.59 |
| D/E (Debt-to-Equity) | 0.13 | 0.009 |
| Debt-to-Assets | 9.20% | 0.78% |
| Interest Coverage | 329.77 | 0 |
| Asset Turnover | 1.17 | 0.43 |
| Fixed Asset Turnover | 16.16 | 1.66 |
| Payout Ratio | 1.14% | 0% |
| Dividend Yield | 0.03% | 0% |
Interpretation of the Ratios
NVIDIA Corporation
NVIDIA exhibits strong profitability ratios, with a net margin of 55.85%, ROE at 91.87%, and ROIC at 75.28%, though valuation multiples like P/E of 39.9 and P/B of 36.66 appear stretched. Liquidity is mixed, current ratio is high but unfavorable, while quick ratio is favorable. NVIDIA pays a modest dividend with a low yield of 0.03%, indicating limited shareholder return via dividends.
IPG Photonics Corporation
IPG Photonics shows negative profitability with net margin -18.58%, ROE -8.97%, and ROIC -9.97%, signaling operational challenges. Its valuation metrics are mixed, with a favorable negative P/E and neutral P/B. Liquidity ratios are strong but current ratio is flagged unfavorable. IPG does not pay dividends, likely due to negative earnings and reinvestment priorities.
Which one has the best ratios?
NVIDIA holds a predominantly favorable ratio profile with strong returns and solid financial health despite some overvaluation concerns. In contrast, IPG Photonics faces unfavorable profitability and operational metrics, with a slightly unfavorable overall ratio assessment. Based purely on ratios, NVIDIA presents a more robust financial standing.
Strategic Positioning
This section compares the strategic positioning of NVIDIA and IPG Photonics in terms of Market position, Key segments, and Exposure to technological disruption:
NVIDIA Corporation
- Leading semiconductor firm with significant competitive pressure in global markets.
- Diverse segments: Data Center, Gaming, Automotive, Professional Visualization.
- Positioned in AI, HPC, gaming, autonomous driving, and cloud computing technologies.
IPG Photonics Corporation
- Smaller semiconductor company with more limited scale and competitive pressures.
- Focused on high-performance fiber lasers and amplifiers for materials processing and communications.
- Focused on laser technology with less exposure to broad technological disruptions.
NVIDIA vs IPG Photonics Positioning
NVIDIA pursues a diversified approach across multiple high-growth tech segments, offering broad market exposure. IPG Photonics concentrates on laser-based materials processing and communications, limiting diversification but specializing in niche industrial applications.
Which has the best competitive advantage?
NVIDIA shows a very favorable moat with growing ROIC and strong value creation, indicating a durable competitive advantage. IPG Photonics displays a very unfavorable moat with declining ROIC, reflecting value destruction and weaker competitive positioning.
Stock Comparison
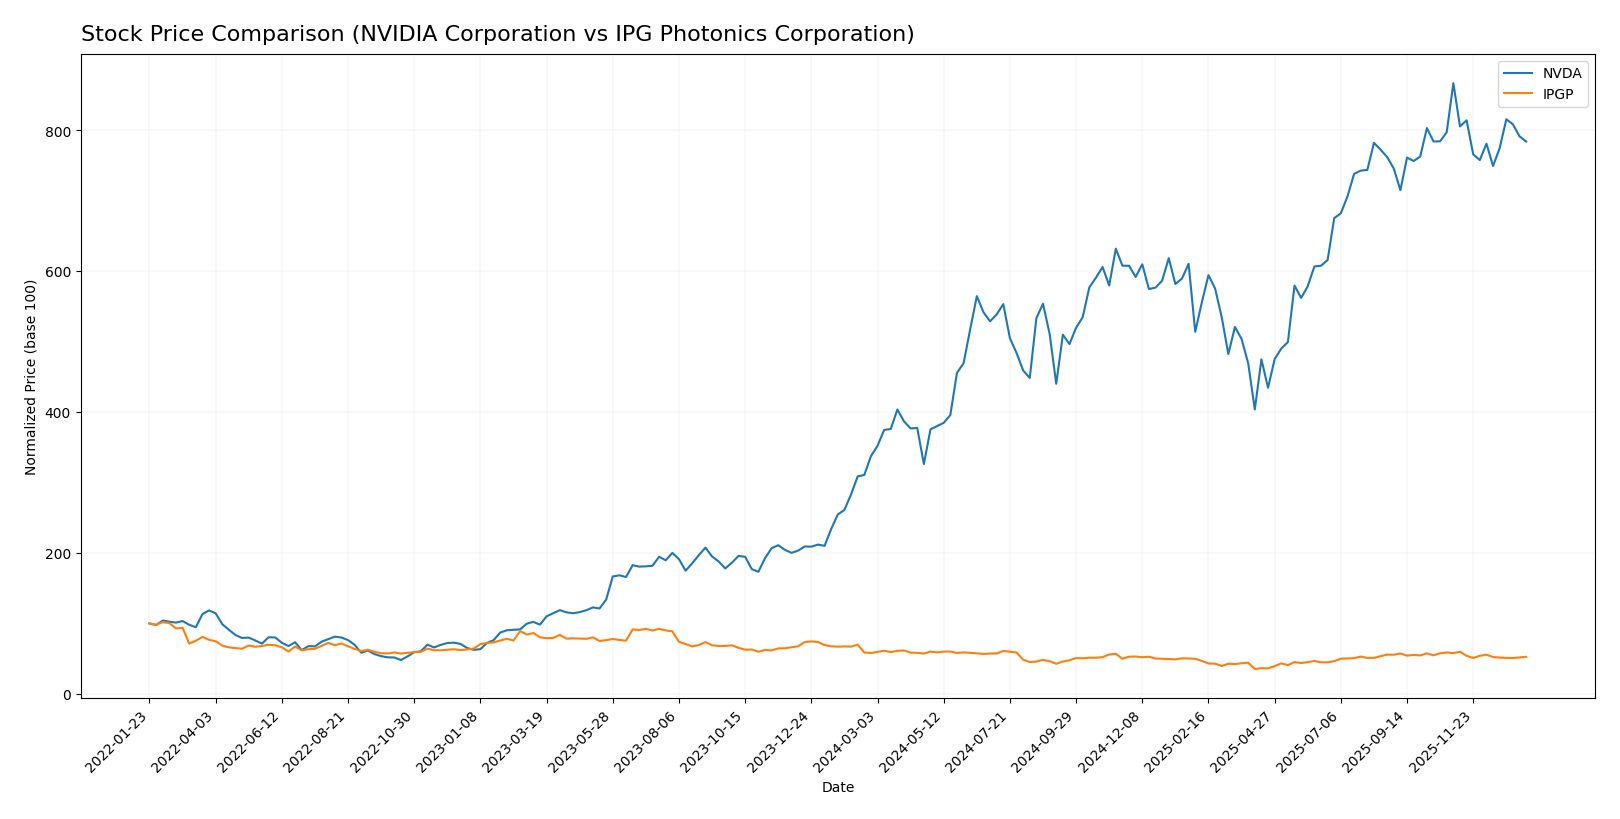
The past year has seen NVIDIA Corporation (NVDA) deliver a strong bullish trend with substantial price appreciation, while IPG Photonics Corporation (IPGP) experienced a bearish trend marked by declining prices and contrasting volume dynamics.
Trend Analysis
NVIDIA’s stock rose 132.35% over the past 12 months, indicating a bullish trend with decelerating momentum. The price fluctuated between a low of 76.2 and a high of 202.49, exhibiting high volatility (std deviation 32.46).
IPG Photonics showed a 9.39% decline over the same period, reflecting a bearish trend with deceleration. Its price ranged from 52.12 to 90.69, with moderate volatility (std deviation 9.27).
Comparing both, NVIDIA’s stock has significantly outperformed IPG Photonics, delivering the highest market performance over the last year.
Target Prices
Here is the current consensus from verified analysts for NVIDIA Corporation and IPG Photonics Corporation.
| Company | Target High | Target Low | Consensus |
|---|---|---|---|
| NVIDIA Corporation | 352 | 140 | 264.34 |
| IPG Photonics Corporation | 96 | 92 | 94 |
Analysts expect NVIDIA’s stock to appreciate significantly from its current price of 183.14 USD, targeting an average of 264.34 USD, while IPG Photonics is also expected to rise from 77.54 USD to around 94 USD on average.
Analyst Opinions Comparison
This section compares analysts’ ratings and grades for NVIDIA Corporation and IPG Photonics Corporation:
Rating Comparison
NVDA Rating
- Rating: Both have a B+ rating, considered very favorable by analysts.
- Discounted Cash Flow Score: Moderate score of 3, indicating average valuation prospects.
- ROE Score: Very favorable 5, showing strong profit generation from equity.
- ROA Score: Very favorable 5, indicating effective asset utilization.
- Debt To Equity Score: Moderate 3, implying average financial risk.
- Overall Score: Moderate 3, summarizing average financial standing.
IPGP Rating
- Rating: Both have a B+ rating, considered very favorable by analysts.
- Discounted Cash Flow Score: Favorable score of 4, suggesting better valuation potential.
- ROE Score: Moderate score of 2, reflecting lower profitability efficiency.
- ROA Score: Moderate 3, showing average effectiveness in asset use.
- Debt To Equity Score: Favorable 4, indicating stronger balance sheet stability.
- Overall Score: Moderate 3, reflecting similar overall financial health.
Which one is the best rated?
Both companies share the same B+ rating and overall score of 3, indicating moderate financial standing. NVDA excels in profitability metrics (ROE and ROA), while IPGP shows better valuation and balance sheet scores.
Scores Comparison
Here is a comparison of the Altman Z-Score and Piotroski Score for NVIDIA Corporation and IPG Photonics Corporation:
NVIDIA Scores
- Altman Z-Score: 68.04, indicating safe zone with very low bankruptcy risk.
- Piotroski Score: 6, classified as average financial strength.
IPG Photonics Scores
- Altman Z-Score: 9.65, indicating safe zone with very low bankruptcy risk.
- Piotroski Score: 7, classified as strong financial strength.
Which company has the best scores?
IPG Photonics has a lower Altman Z-Score than NVIDIA but both are in the safe zone, while IPG shows a stronger Piotroski Score, suggesting better overall financial strength based on the provided data.
Grades Comparison
Here is a detailed comparison of recent grades for NVIDIA Corporation and IPG Photonics Corporation:
NVIDIA Corporation Grades
The following table summarizes recent actionable grades assigned by reputable grading companies for NVIDIA Corporation:
| Grading Company | Action | New Grade | Date |
|---|---|---|---|
| Mizuho | Maintain | Outperform | 2026-01-09 |
| Truist Securities | Maintain | Buy | 2025-12-29 |
| Stifel | Maintain | Buy | 2025-12-29 |
| B of A Securities | Maintain | Buy | 2025-12-26 |
| Baird | Maintain | Outperform | 2025-12-26 |
| Bernstein | Maintain | Outperform | 2025-12-26 |
| Truist Securities | Maintain | Buy | 2025-12-19 |
| Tigress Financial | Maintain | Strong Buy | 2025-12-18 |
| Morgan Stanley | Maintain | Overweight | 2025-12-01 |
| Deutsche Bank | Maintain | Hold | 2025-11-20 |
NVIDIA’s grades consistently show strong buy-side sentiment with most firms maintaining Buy or Outperform ratings, reflecting broad confidence in the stock.
IPG Photonics Corporation Grades
The following table presents recent grades from recognized grading companies for IPG Photonics Corporation:
| Grading Company | Action | New Grade | Date |
|---|---|---|---|
| Citigroup | Upgrade | Buy | 2025-11-05 |
| Bernstein | Upgrade | Outperform | 2025-08-07 |
| Raymond James | Maintain | Strong Buy | 2025-05-07 |
| CL King | Upgrade | Buy | 2025-03-18 |
| Citigroup | Maintain | Sell | 2025-02-18 |
| Stifel | Maintain | Buy | 2025-02-12 |
| Needham | Maintain | Hold | 2025-02-12 |
| Seaport Global | Downgrade | Neutral | 2024-08-01 |
| Stifel | Maintain | Buy | 2024-07-31 |
| Raymond James | Maintain | Strong Buy | 2024-07-31 |
IPG Photonics shows a mix of Buy and Strong Buy ratings with some recent upgrades, but also a notable Sell and Neutral rating, indicating a more varied analyst outlook.
Which company has the best grades?
NVIDIA Corporation has received more consistent and predominantly positive grades, mostly Buy and Outperform, compared to IPG Photonics’ mixed ratings. For investors, NVIDIA’s stronger consensus may suggest comparatively lower perceived risk and greater confidence from analysts.
Strengths and Weaknesses
Below is a comparative overview of key strengths and weaknesses of NVIDIA Corporation (NVDA) and IPG Photonics Corporation (IPGP) based on the most recent financial and strategic data.
| Criterion | NVIDIA Corporation (NVDA) | IPG Photonics Corporation (IPGP) |
|---|---|---|
| Diversification | Highly diversified revenue streams: Data Center ($115B), Gaming ($11.35B), Automotive ($1.69B), Professional Visualization ($1.88B) | More concentrated in laser systems and related services, with main revenue from High Power CW Lasers ($333M) and Amplifiers & Services ($247M) |
| Profitability | Very high profitability: Net margin 55.85%, ROIC 75.28%, ROE 91.87% | Negative profitability: Net margin -18.58%, ROIC -9.97%, ROE -8.97% |
| Innovation | Strong innovation with durable competitive advantage; ROIC growing 339% over recent years | Declining innovation impact; ROIC dropped -276%, indicating weakening competitive edge |
| Global presence | Extensive global presence with diverse markets served | More niche market presence, focused on specialized laser applications |
| Market Share | Leading market share in GPUs and data center accelerators | Smaller, specialized market share in industrial laser systems |
Key takeaways: NVIDIA demonstrates robust diversification, exceptional profitability, and a durable competitive moat with strong innovation and global reach. Conversely, IPG Photonics faces profitability challenges and a shrinking economic moat, reflecting risks that investors should carefully consider.
Risk Analysis
Below is a comparative risk assessment for NVIDIA Corporation (NVDA) and IPG Photonics Corporation (IPGP) based on the most recent financial and market data.
| Metric | NVIDIA Corporation (NVDA) | IPG Photonics Corporation (IPGP) |
|---|---|---|
| Market Risk | High beta (2.314) indicates significant sensitivity to market fluctuations. | Moderate beta (1.017), showing average market volatility exposure. |
| Debt level | Low debt-to-equity (0.13) and debt-to-assets (9.2%), strong interest coverage (341x). | Very low debt-to-equity (0.01) and debt-to-assets (0.78%), excellent interest coverage. |
| Regulatory Risk | Moderate, given global operations including China and automotive sectors. | Moderate, with exposure in materials processing and communications industries. |
| Operational Risk | Complex supply chain and dependence on semiconductor manufacturing capacity. | Specialized manufacturing of fiber lasers with niche market risks. |
| Environmental Risk | Moderate, due to energy-intensive manufacturing and increasing sustainability regulations. | Low to moderate, focused on laser tech with lesser environmental footprint. |
| Geopolitical Risk | High, significant exposure to U.S.-China trade tensions and global tech restrictions. | Moderate, less global footprint but still vulnerable to supply chain disruptions. |
The most likely and impactful risks are NVIDIA’s market volatility and geopolitical exposure, particularly involving China and semiconductor regulations, which could affect supply and sales. IPG Photonics faces operational risks from its niche market and moderate regulatory pressures. Both companies maintain low debt levels, reducing financial distress risk.
Which Stock to Choose?
NVIDIA Corporation (NVDA) has shown strong income growth with a 114.2% revenue increase in one year and a 682.59% growth over five years. Its profitability is high, with a 55.85% net margin and favorable returns on equity (91.87%) and invested capital (75.28%). The company maintains low debt levels and a very favorable rating of B+, reflecting solid financial health and growth potential.
IPG Photonics Corporation (IPGP) experienced declining income, with a 24.1% revenue drop in one year and negative net margin (-18.58%). Profitability ratios are mostly unfavorable, including negative return on equity (-8.97%) and invested capital (-9.97%). Despite low debt and a B+ rating, its financial ratios and income trends suggest weaker operational performance and value creation.
For investors focused on growth and strong profitability, NVIDIA’s very favorable rating and robust income and ratio performance might appear more attractive. Conversely, those prioritizing value or stability may find IPG Photonics’ low debt and moderate rating more aligned, though its recent income and profitability trends could signal caution.
Disclaimer: Investment carries a risk of loss of initial capital. The past performance is not a reliable indicator of future results. Be sure to understand risks before making an investment decision.
Go Further
I encourage you to read the complete analyses of NVIDIA Corporation and IPG Photonics Corporation to enhance your investment decisions: