Home > Comparison > Technology > IPGP vs NVEC
The strategic rivalry between IPG Photonics Corporation and NVE Corporation shapes the semiconductor sector’s innovation frontier. IPG Photonics operates as a capital-intensive leader in high-performance fiber lasers, while NVE Corporation focuses on niche spintronic sensor technology with a lean operational model. This head-to-head pits broad industrial scale against specialized technological innovation. This analysis will clarify which trajectory offers a superior risk-adjusted outlook for a diversified portfolio in the evolving tech landscape.
Table of contents
Companies Overview
IPG Photonics and NVE Corporation stand as notable players in the semiconductor industry, each commanding unique market niches.
IPG Photonics Corporation: Leader in High-Performance Fiber Lasers
IPG Photonics dominates the market with high-performance fiber lasers and amplifiers used in materials processing and communications. Its core revenue stems from selling integrated laser systems and optical components globally. In 2026, the company focuses strategically on expanding advanced laser applications in manufacturing and telecom sectors to reinforce its competitive edge.
NVE Corporation: Pioneer in Spintronic Devices
NVE Corporation specializes in spintronic sensors and couplers, leveraging nanotechnology to innovate data acquisition and transmission. Its revenue mainly comes from factory automation and medical device markets. The 2026 strategic emphasis lies in expanding industrial IoT applications and licensing spintronic memory technology to capture emerging opportunities.
Strategic Collision: Similarities & Divergences
Both firms invest in semiconductor innovation but diverge in technology focus—IPG on fiber laser systems, NVE on spintronics. Their primary battleground is advanced sensing and communication devices for industrial and medical uses. IPG presents a broad industrial footprint with scale advantages, while NVE’s niche innovation offers a distinct, high-margin growth profile.
Income Statement Comparison
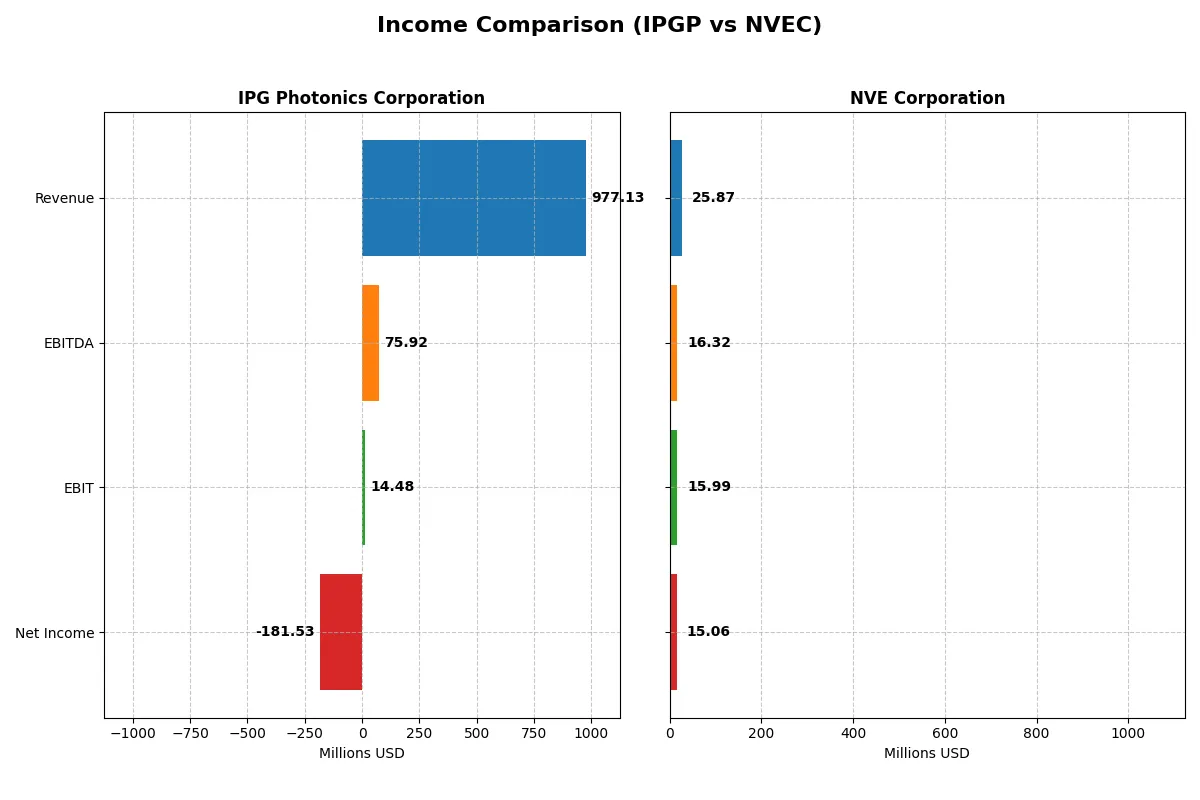
The following data dissects the core profitability and scalability of both corporate engines to reveal who dominates the bottom line:
| Metric | IPG Photonics Corporation (IPGP) | NVE Corporation (NVEC) |
|---|---|---|
| Revenue | 977M | 26M |
| Cost of Revenue | 639M | 4.2M |
| Operating Expenses | 546M | 5.6M |
| Gross Profit | 338M | 22M |
| EBITDA | 76M | 16M |
| EBIT | 14M | 16M |
| Interest Expense | 0 | 0 |
| Net Income | -182M | 15M |
| EPS | -4.09 | 3.12 |
| Fiscal Year | 2024 | 2025 |
Income Statement Analysis: The Bottom-Line Duel
The forthcoming income statement comparison reveals the true operational efficiency and profitability of two distinct corporate engines.
IPG Photonics Corporation Analysis
IPGP’s revenue declined steadily from 1.46B in 2021 to 977M in 2024, with net income swinging from a robust 278M profit in 2021 to a sharp 182M loss in 2024. Gross margin held at a moderate 34.6%, but net margin plunged to -18.6%, signaling deteriorating bottom-line efficiency and severe profitability headwinds in the latest year.
NVE Corporation Analysis
NVEC posted revenue growth over the longer term, rising from 21M in 2021 to 26M in 2025 despite a recent 13% dip. It sustained a stellar gross margin above 83% and a strong net margin around 58%, reflecting exceptional operating leverage. The company’s bottom line expanded steadily, with net income reaching 15M in 2025, highlighting consistent profitability and margin resilience.
Margin Mastery vs. Revenue Resilience
NVEC outperforms IPGP with superior margins and sustained net income growth, while IPGP struggles with declining revenue and mounting losses. NVEC’s high-margin, profitable model offers a cleaner, more reliable earnings profile. IPGP’s profile carries higher risk due to deteriorating profitability and negative net margins, making NVEC’s earnings quality more attractive for investors seeking operational efficiency.
Financial Ratios Comparison
These vital ratios act as a diagnostic tool to expose the underlying fiscal health, valuation premiums, and capital efficiency of the companies compared below:
| Ratios | IPG Photonics Corporation (IPGP) | NVE Corporation (NVEC) |
|---|---|---|
| ROE | -8.97% (2024) | 24.19% (2025) |
| ROIC | -9.97% (2024) | 21.14% (2025) |
| P/E | -17.76 (2024) | 20.46 (2025) |
| P/B | 1.59 (2024) | 4.95 (2025) |
| Current Ratio | 6.98 (2024) | 28.40 (2025) |
| Quick Ratio | 5.59 (2024) | 22.03 (2025) |
| D/E | 0.009 (2024) | 0.015 (2025) |
| Debt-to-Assets | 0.78% (2024) | 1.43% (2025) |
| Interest Coverage | 0 (2024) | 0 (2025) |
| Asset Turnover | 0.43 (2024) | 0.40 (2025) |
| Fixed Asset Turnover | 1.66 (2024) | 8.91 (2025) |
| Payout ratio | 0% (2024) | 128.38% (2025) |
| Dividend yield | 0% (2024) | 6.28% (2025) |
| Fiscal Year | 2024 | 2025 |
Efficiency & Valuation Duel: The Vital Signs
Financial ratios act as a company’s DNA, exposing hidden risks and highlighting operational strengths beyond surface-level figures.
IPG Photonics Corporation
IPGP displays troubling profitability with a negative ROE of -9% and net margin of -18.6%. Its valuation appears attractive with a negative P/E, signaling losses rather than overvaluation. The company does not pay dividends, instead reinvesting heavily in R&D (11.2% of revenue), aiming for long-term growth despite current inefficiency.
NVE Corporation
NVEC boasts robust profitability, with a 24% ROE and a strong net margin above 58%. Its P/E ratio of 20.5 aligns with growth peers, though a high P/B at 4.95 suggests stretched valuation. NVEC returns value via a 6.28% dividend yield, balancing shareholder income with solid reinvestment in innovation (14% R&D).
Contrasting Profitability and Valuation Profiles
NVEC offers superior operational efficiency and profitable growth, supported by dividends and reinvestment. IPGP suffers from unprofitable operations and relies solely on R&D for returns. Investors seeking growth with income may prefer NVEC’s profile, while those tolerating losses for future scale might consider IPGP’s riskier path.
Which one offers the Superior Shareholder Reward?
I observe that IPG Photonics (IPGP) pays no dividends and allocates capital mainly to R&D and growth, with zero payout ratio and no buybacks. NVE Corporation (NVEC) offers a robust dividend yield around 4.5–7.3% and maintains payout ratios slightly above 100%, signaling aggressive shareholder returns via dividends. NVEC’s buyback intensity is not explicit, but its strong free cash flow coverage (~90–100%) suggests sustainable distributions. IPGP’s capital allocation favors long-term innovation but currently shows negative net margins, raising sustainability concerns. NVEC delivers superior total shareholder reward in 2026 through consistent dividends backed by solid profitability and cash flow.
Comparative Score Analysis: The Strategic Profile
The radar chart reveals the fundamental DNA and trade-offs of IPG Photonics Corporation and NVE Corporation, highlighting their financial strengths and valuation nuances:
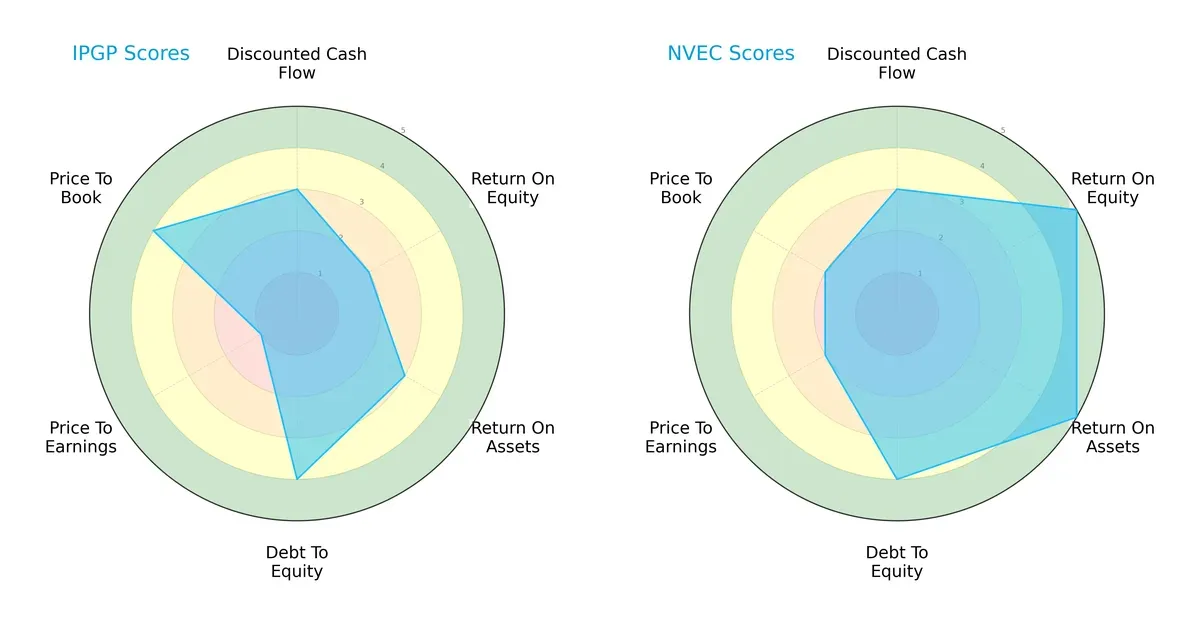
NVE displays a stronger profitability edge with top ROE and ROA scores (5 each) compared to IPGP’s moderate returns (2 and 3). Both share solid debt management (score 4). IPGP’s valuation looks more attractive via P/B (4) but suffers from a poor P/E score (1), indicating potential market skepticism. NVE presents a more balanced financial profile, while IPGP leans on valuation gaps for appeal.
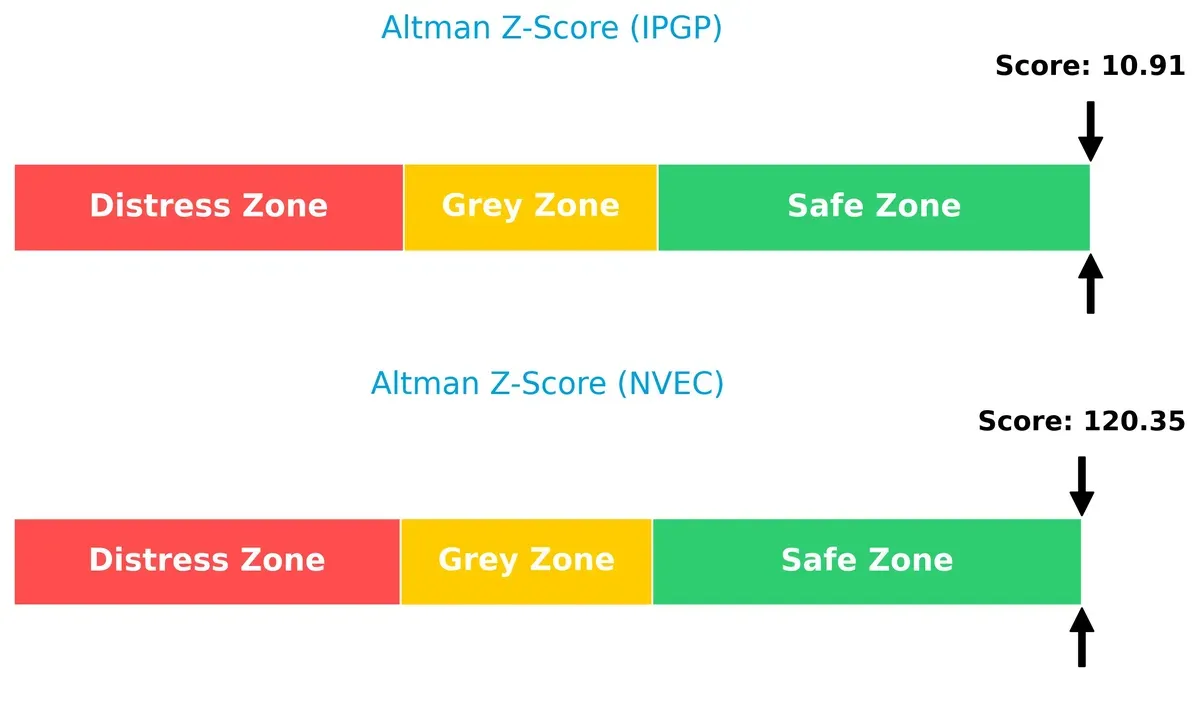
Bankruptcy Risk: Solvency Showdown
NVE’s Altman Z-Score far exceeds IPGP’s, both safely above 3, signaling robust solvency. This gap implies NVE is exceptionally well-positioned to withstand economic downturns:
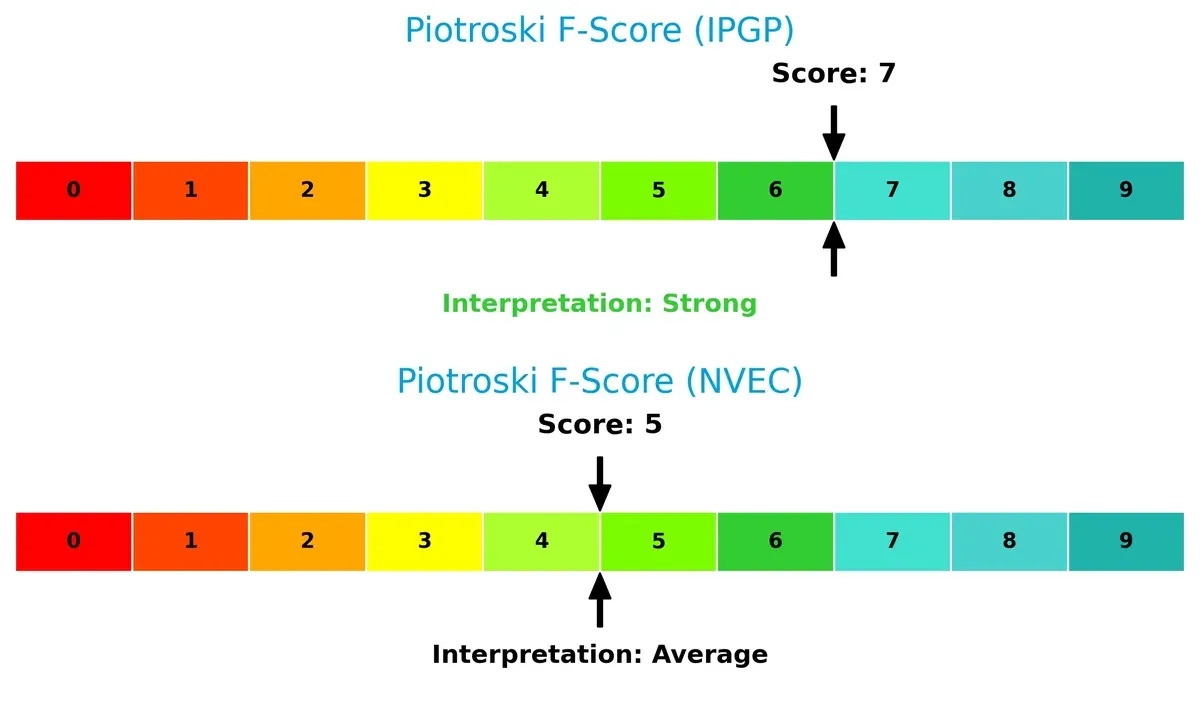
Financial Health: Quality of Operations
IPGP’s Piotroski F-Score of 7 indicates strong internal financial health, outperforming NVE’s average score of 5. IPGP shows fewer red flags in profitability and efficiency metrics:
How are the two companies positioned?
This section dissects the operational DNA of IPGP and NVEC by comparing revenue distribution and internal dynamics—strengths and weaknesses. The goal is to confront their economic moats and identify which model offers the most resilient competitive advantage today.
Revenue Segmentation: The Strategic Mix
This visual comparison dissects how IPG Photonics Corporation and NVE Corporation diversify their income streams and reveals where their primary sector bets lie:
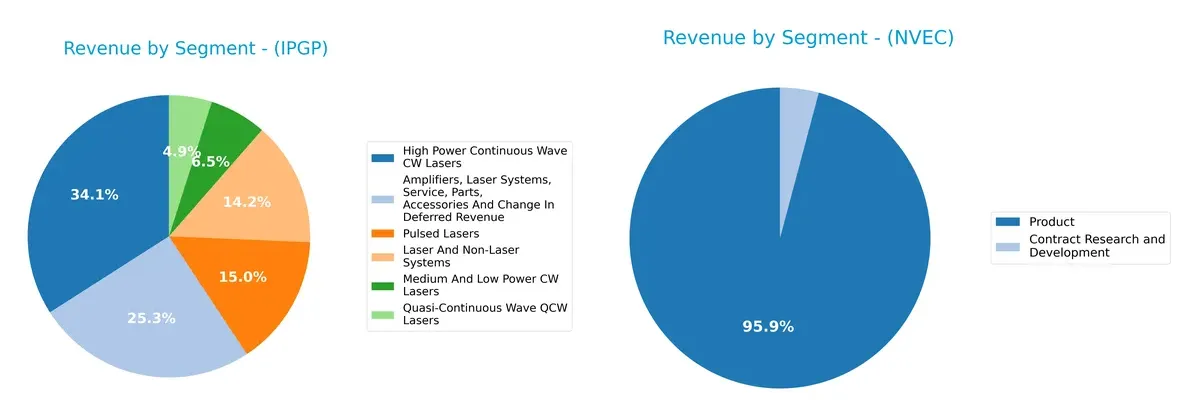
IPG Photonics anchors its revenue in High Power Continuous Wave CW Lasers, generating $333M in 2024, but balances this with Pulsed Lasers ($147M) and Amplifiers & Services ($247M). This mix shows strategic depth with moderate diversification. NVE Corporation, by contrast, pivots heavily on its Product segment, which dwarfs Contract Research and Development, reaching nearly $26M versus $1.1M. IPG’s broader portfolio reduces concentration risk, while NVE’s focus signals potential vulnerability but also specialization strength.
Strengths and Weaknesses Comparison
This table compares the Strengths and Weaknesses of IPG Photonics Corporation and NVE Corporation:
IPGP Strengths
- Strong diversification across laser product lines
- Low debt-to-equity of 0.01
- Favorable quick ratio at 5.59
- Infinite interest coverage
- Global sales spread across Asia, Europe, North America
NVEC Strengths
- High profitability with 58% net margin
- Strong ROE of 24% and ROIC of 21%
- Favorable low debt-to-equity of 0.01
- Excellent fixed asset turnover at 8.91
- Global presence with notable US and Europe sales
IPGP Weaknesses
- Negative net margin at -18.58%
- Negative ROE and ROIC
- Unfavorable current ratio at 6.98
- Low asset turnover at 0.43
- No dividend yield
NVEC Weaknesses
- Unfavorable high P/B ratio at 4.95
- Unfavorable very high current ratio at 28.4
- Asset turnover low at 0.4
IPGP exhibits solid product diversification and conservative leverage but suffers from weak profitability and operational efficiency. NVEC demonstrates robust profitability and asset utilization but shows valuation and liquidity concerns. These contrasts highlight differing strategic and financial positions between the companies.
The Moat Duel: Analyzing Competitive Defensibility
A structural moat protects long-term profits from relentless competition erosion. Only durable competitive advantages ensure sustainable value creation:
IPG Photonics Corporation: Cost Advantage in Fiber Laser Technology
IPGP’s moat stems from its cost-efficient fiber laser manufacturing. However, declining ROIC and shrinking profits indicate this advantage is eroding in 2026. Expansion risks loom amid intensifying global competition.
NVE Corporation: Intangible Assets Fueled by Spintronics Innovation
NVEC relies on proprietary spintronic technology, creating high-margin, specialized sensors. Its growing ROIC and strong net margins reflect superior capital efficiency. Innovation-driven growth in IoT markets could widen its moat further.
Cost Leadership vs. Innovation Edge: The Moat Showdown
NVEC holds a deeper, more durable moat with expanding profitability and technological leadership. IPGP’s cost advantage weakens amid falling returns. NVEC stands better positioned to defend and grow its market share in 2026.
Which stock offers better returns?
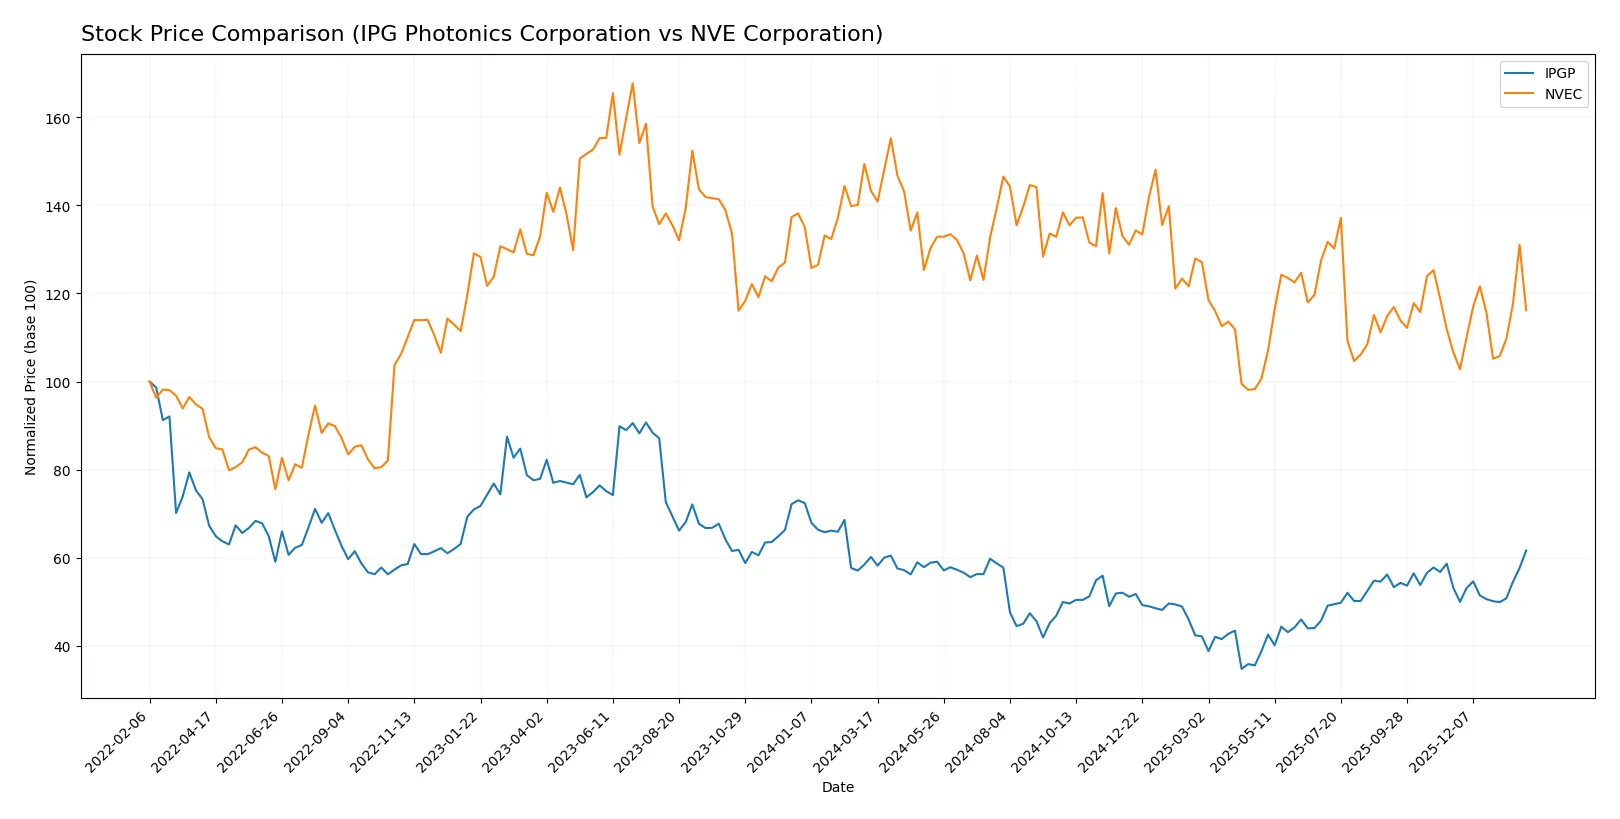
Over the past year, IPG Photonics Corporation’s stock price shows a modest bullish trend with accelerating gains. NVE Corporation’s shares display a sustained bearish trend despite recent recovery efforts.
Trend Comparison
IPG Photonics Corporation’s stock rose 2.4% over the past 12 months, marking a bullish trend with accelerating momentum and a high volatility of 9.36%. The price ranged between 52.12 and 92.41.
NVE Corporation’s stock fell 18.93% over the same period, confirming a bearish trend with accelerating decline. Recent gains of 8.94% suggest a partial rebound amid moderate volatility of 7.6%.
IPGP delivered the highest market performance with a positive 2.4% gain versus NVEC’s 18.93% decline over 12 months.
Target Prices
Analysts set a firm consensus target for IPG Photonics Corporation.
| Company | Target Low | Target High | Consensus |
|---|---|---|---|
| IPG Photonics Corporation | 92 | 96 | 94 |
The target consensus of $94 slightly exceeds the current price of $92.41, indicating modest upside potential. No verified target price data is available for NVE Corporation.

Don’t Let Luck Decide Your Entry Point
Optimize your entry points with our advanced ProRealTime indicators. You’ll get efficient buy signals with precise price targets for maximum performance. Start outperforming now!
How do institutions grade them?
The following presents institutional grades for IPG Photonics Corporation and NVE Corporation:
IPG Photonics Corporation Grades
This table summarizes recent grades issued by reputable financial institutions for IPG Photonics Corporation.
| Grading Company | Action | New Grade | Date |
|---|---|---|---|
| Citigroup | Upgrade | Buy | 2025-11-05 |
| Bernstein | Upgrade | Outperform | 2025-08-07 |
| Raymond James | Maintain | Strong Buy | 2025-05-07 |
| CL King | Upgrade | Buy | 2025-03-18 |
| Citigroup | Maintain | Sell | 2025-02-18 |
| Stifel | Maintain | Buy | 2025-02-12 |
| Needham | Maintain | Hold | 2025-02-12 |
| Seaport Global | Downgrade | Neutral | 2024-08-01 |
| Stifel | Maintain | Buy | 2024-07-31 |
| Raymond James | Maintain | Strong Buy | 2024-07-31 |
Which company has the best grades?
IPG Photonics Corporation has multiple recent upgrades and strong buy ratings from credible firms, while NVE Corporation lacks any available grades. IPGP’s positive institutional sentiment could influence investor confidence and valuation models more favorably.
Risks specific to each company
The following categories identify critical pressure points and systemic threats facing IPG Photonics Corporation and NVE Corporation in the 2026 market environment:
1. Market & Competition
IPG Photonics Corporation
- Faces intense competition in fiber laser tech, with pressure on margins amid evolving semiconductor cycles.
NVE Corporation
- Competes in niche spintronics market, benefiting from innovation but limited by smaller scale and customer base.
2. Capital Structure & Debt
IPG Photonics Corporation
- Extremely low debt (D/E 0.01) with strong interest coverage, indicating conservative leverage.
NVE Corporation
- Also low debt (D/E 0.01), maintaining financial stability despite smaller market cap.
3. Stock Volatility
IPG Photonics Corporation
- Beta near 1.02 suggests average volatility aligned with broad tech sector risks.
NVE Corporation
- Beta higher at 1.20, indicating greater sensitivity to market swings and investor sentiment.
4. Regulatory & Legal
IPG Photonics Corporation
- Operates globally, facing standard semiconductor export controls and IP risks.
NVE Corporation
- Exposed to regulations on emerging spintronics and potential export restrictions on advanced tech.
5. Supply Chain & Operations
IPG Photonics Corporation
- Large, complex supply chain risks due to scale and global materials sourcing.
NVE Corporation
- Smaller operation but reliant on specialized components, making supply chain disruptions impactful.
6. ESG & Climate Transition
IPG Photonics Corporation
- Moderate ESG risks; energy-intensive manufacturing could face rising compliance costs.
NVE Corporation
- ESG footprint smaller but must manage risks tied to nanotech manufacturing and waste.
7. Geopolitical Exposure
IPG Photonics Corporation
- Global sales and manufacturing expose it to US-China tensions and trade policy shifts.
NVE Corporation
- Less globally diversified, but still vulnerable to US export controls and foreign market access.
Which company shows a better risk-adjusted profile?
NVE’s strongest risk is its high stock volatility and niche market dependency, which could amplify downside risks. IPG’s critical risk lies in its weak profitability and operational efficiency despite strong liquidity and low debt. Overall, NVE presents a better risk-adjusted profile, supported by superior profitability metrics and a very favorable Altman Z-score. However, NVE’s recent 6.3% stock drop signals heightened investor concern over volatility.
Final Verdict: Which stock to choose?
IPG Photonics Corporation’s superpower lies in its robust liquidity and conservative debt profile, providing a strong cash buffer. However, its declining profitability and value destruction signal a point of vigilance. It suits portfolios willing to weather volatility for potential recovery, fitting an Aggressive Growth strategy.
NVE Corporation commands a durable competitive moat with a high and growing ROIC, reflecting efficient capital use and consistent value creation. Its strong profitability and favorable financial ratings offer better stability compared to IPGP. It fits well within GARP portfolios seeking growth with reasonable risk.
If you prioritize capital efficiency and durable competitive advantage, NVE Corporation outshines IPG Photonics with superior profitability and stability. However, if you seek high-risk, high-reward exposure aiming at recovery plays, IPG Photonics could fit that niche despite its current challenges.
Disclaimer: Investment carries a risk of loss of initial capital. The past performance is not a reliable indicator of future results. Be sure to understand risks before making an investment decision.
Go Further
I encourage you to read the complete analyses of IPG Photonics Corporation and NVE Corporation to enhance your investment decisions: