Home > Comparison > Technology > IPGP vs MXL
The strategic rivalry between IPG Photonics Corporation and MaxLinear, Inc. shapes the semiconductor industry’s evolution. IPG Photonics operates as a capital-intensive leader in high-performance fiber lasers, serving materials processing and advanced applications. Conversely, MaxLinear excels as a high-margin provider of integrated RF and mixed-signal SoCs for communications infrastructure. This analysis will assess which company’s operational model offers a superior risk-adjusted outlook for a diversified portfolio amid sector innovation and competitive pressures.
Table of contents
Companies Overview
IPG Photonics Corporation and MaxLinear, Inc. both shape critical segments of the semiconductor industry with distinct technological emphases.
IPG Photonics Corporation: Leader in High-Performance Fiber Lasers
IPG Photonics dominates the fiber laser market, generating revenue from manufacturing advanced fiber lasers and amplifiers. Its 2026 strategy centers on expanding materials processing and communications applications. The company leverages proprietary laser technology and integrated systems to serve OEMs and system integrators worldwide.
MaxLinear, Inc.: Innovator in Communications SoCs
MaxLinear specializes in high-performance analog and mixed-signal SoCs for broadband, wireless, and industrial uses. Its core revenue comes from integrated communication platforms including RF transceivers and power management. In 2026, MaxLinear focuses on enhancing 4G/5G infrastructure and data center transport solutions to capture growing connectivity demands.
Strategic Collision: Similarities & Divergences
Both companies operate within semiconductors but pursue different technology architectures—IPG with closed laser systems versus MaxLinear’s open communications platforms. They compete primarily in communications hardware, targeting diverse end markets from industrial to data networks. IPG offers a capital-intensive, innovation-driven moat; MaxLinear presents a scalable, integrated solution model with higher beta risk.
Income Statement Comparison
This data dissects the core profitability and scalability of both corporate engines to reveal who dominates the bottom line:
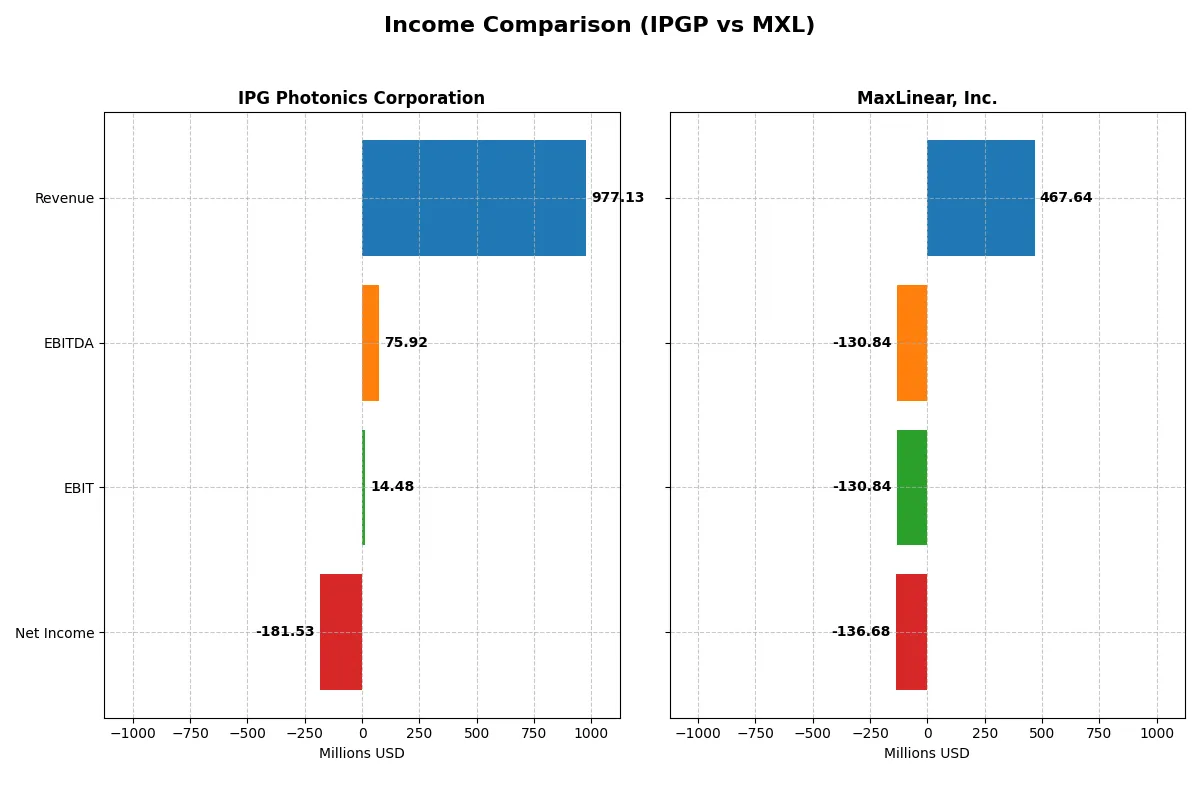
| Metric | IPG Photonics Corporation (IPGP) | MaxLinear, Inc. (MXL) |
|---|---|---|
| Revenue | 977M | 360M |
| Cost of Revenue | 639M | 168M |
| Operating Expenses | 546M | 361M |
| Gross Profit | 338M | 192M |
| EBITDA | 76M | -182M |
| EBIT | 14M | -228M |
| Interest Expense | 0 | 11M |
| Net Income | -182M | -245M |
| EPS | -4.09 | -2.93 |
| Fiscal Year | 2024 | 2024 |
Income Statement Analysis: The Bottom-Line Duel
This income statement comparison reveals which company runs a more efficient and resilient corporate engine through recent performance.
IPG Photonics Corporation Analysis
IPGP’s revenue declined steadily from 1.46B in 2021 to 977M in 2024, with net income swinging from a 278M profit in 2021 to a -182M loss in 2024. Its gross margin remains solid at 34.6%, but net margin collapsed to -18.6%. The sharp downturn in 2024 highlights serious efficiency and profitability challenges.
MaxLinear, Inc. Analysis
MXL’s revenue fell overall from 892M in 2021 to 468M in 2025, but rebounded 30% in the last year. Net income remains negative, at -137M in 2025, with a weak net margin of -29.2%. However, a rising gross margin of 56.8% and recent margin improvements indicate some operational momentum despite ongoing losses.
Margin Resilience vs. Profitability Collapse
IPGP shows stronger historical profitability but suffers a dramatic 2024 collapse, while MXL struggles with losses but demonstrates recent margin and top-line recovery. IPGP’s margin erosion and net losses raise red flags; MXL’s improving gross margins suggest potential operational leverage. For investors, IPGP’s profile signals caution, whereas MXL’s turnaround momentum may attract those seeking growth potential amid risk.
Financial Ratios Comparison
These vital ratios act as a diagnostic tool to expose the underlying fiscal health, valuation premiums, and capital efficiency of the companies compared below:
| Ratios | IPG Photonics Corporation (IPGP) | MaxLinear, Inc. (MXL) |
|---|---|---|
| ROE | -8.97% (2024) | -47.49% (2024) |
| ROIC | -9.97% (2024) | -24.31% (2024) |
| P/E | -17.76 (2024) | -6.74 (2024) |
| P/B | 1.59 (2024) | 3.20 (2024) |
| Current Ratio | 6.98 (2024) | 1.77 (2024) |
| Quick Ratio | 5.59 (2024) | 1.28 (2024) |
| D/E | 0.01 (2024) | 0.29 (2024) |
| Debt-to-Assets | 0.78% (2024) | 17.23% (2024) |
| Interest Coverage | 0 (2024) | -15.52 (2024) |
| Asset Turnover | 0.43 (2024) | 0.42 (2024) |
| Fixed Asset Turnover | 1.66 (2024) | 4.65 (2024) |
| Payout ratio | 0% (2024) | 0% (2024) |
| Dividend yield | 0% (2024) | 0% (2024) |
| Fiscal Year | 2024 | 2024 |
Efficiency & Valuation Duel: The Vital Signs
Financial ratios serve as the company’s DNA, exposing operational strengths and hidden risks crucial for investment decisions.
IPG Photonics Corporation
IPGP’s profitability metrics reveal weakness, with negative ROE at -9% and a net margin below zero, signaling operational challenges. Valuation appears reasonable with a P/E of -17.76 and a neutral P/B of 1.59. The firm does not pay dividends but reinvests heavily in R&D (11% of revenue), aiming for long-term growth despite current profitability issues.
MaxLinear, Inc.
MXL shows deeper profitability struggles, with a sharply negative ROE of -47% and a net margin of -68%, reflecting severe operational losses. Its valuation is mixed: a favorable negative P/E of -6.74 contrasts with an expensive P/B of 3.2. The company yields no dividend; instead, it allocates over 62% of revenue to R&D, emphasizing aggressive reinvestment amid financial strain.
Operational Efficiency vs. Growth Intensity
IPGP balances a stretched operational performance with moderate valuation and solid reinvestment, while MXL faces harsher profitability and valuation disconnects despite higher R&D spending. For investors prioritizing risk control, IPGP’s profile offers a somewhat safer path, whereas MXL fits a high-risk, growth-focused appetite.
Which one offers the Superior Shareholder Reward?
I compare IPG Photonics Corporation (IPGP) and MaxLinear, Inc. (MXL) on their shareholder reward strategies. Both companies do not pay dividends, so I focus on buyback intensity and reinvestment approaches. IPGP boasts strong free cash flow (3.4/share in 2024) supporting buybacks and capex (2.2/share). MXL posts negative free cash flow (-0.75/share), limiting buybacks and relying on cash burn. IPGP’s robust cash ratio (3.0) and near-zero debt underpin sustainable capital allocation. MXL struggles with leverage (debt/equity 0.29) and negative margins, signaling risk. Historically, IPGP’s conservative financials fuel consistent shareholder returns via buybacks and growth investments. I conclude IPGP offers a clearly superior total return profile in 2026.
Comparative Score Analysis: The Strategic Profile
The radar chart reveals the fundamental DNA and trade-offs of both firms across valuation, profitability, and leverage metrics:
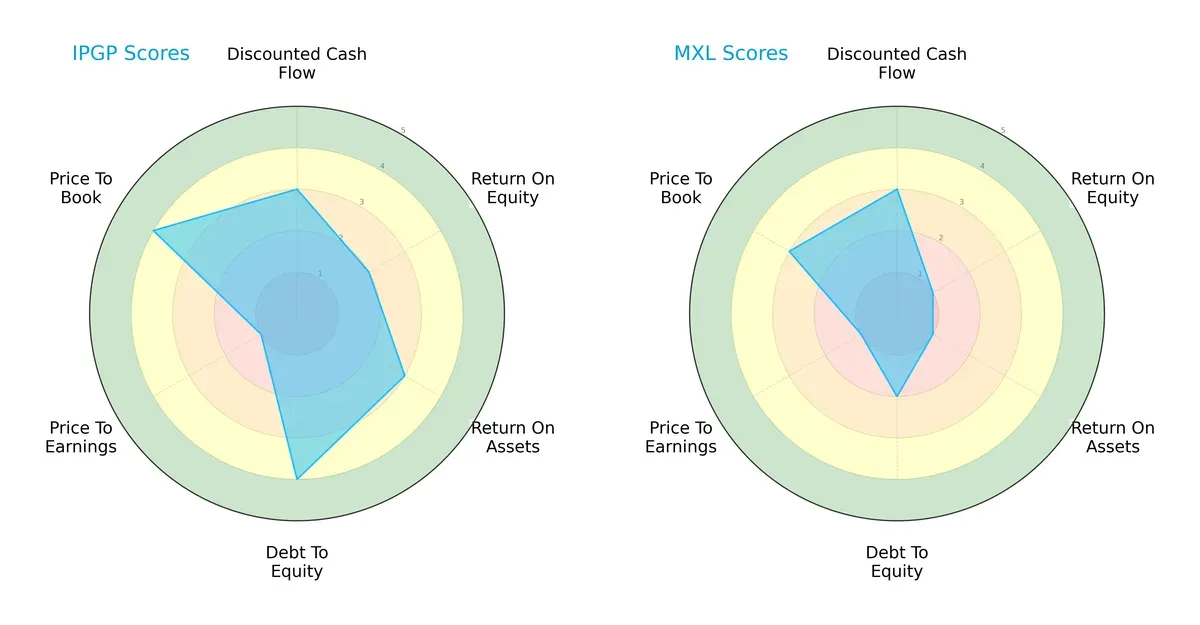
IPG Photonics Corporation (IPGP) shows a balanced profile with moderate DCF, ROE, and ROA scores, paired with a strong debt-to-equity score and favorable price-to-book valuation. MaxLinear, Inc. (MXL) leans heavily on moderate DCF but falters significantly in profitability (ROE and ROA) and financial stability (debt-to-equity). IPGP’s profile suggests diversified strengths, while MXL relies on a narrower competitive edge.
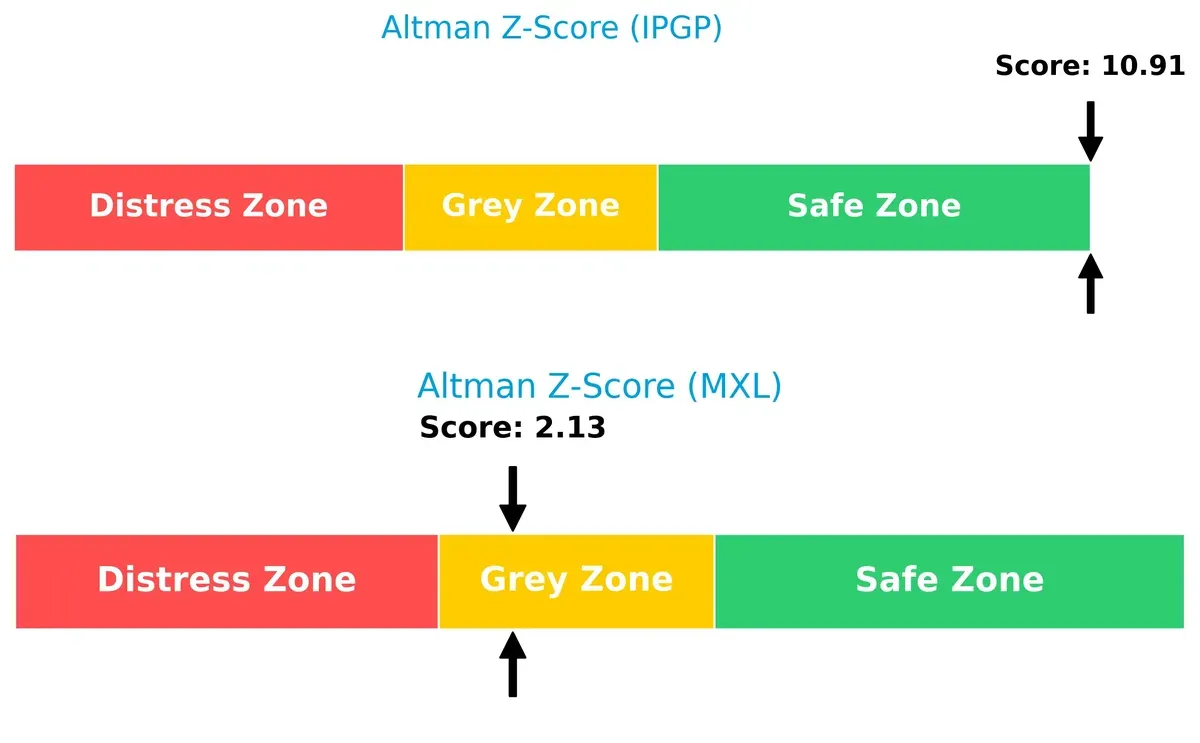
Bankruptcy Risk: Solvency Showdown
IPGP’s Altman Z-Score of 10.9 firmly places it in the safe zone, signaling robust long-term solvency. MXL’s 2.1 score sits in the grey zone, indicating moderate bankruptcy risk during economic downturns:
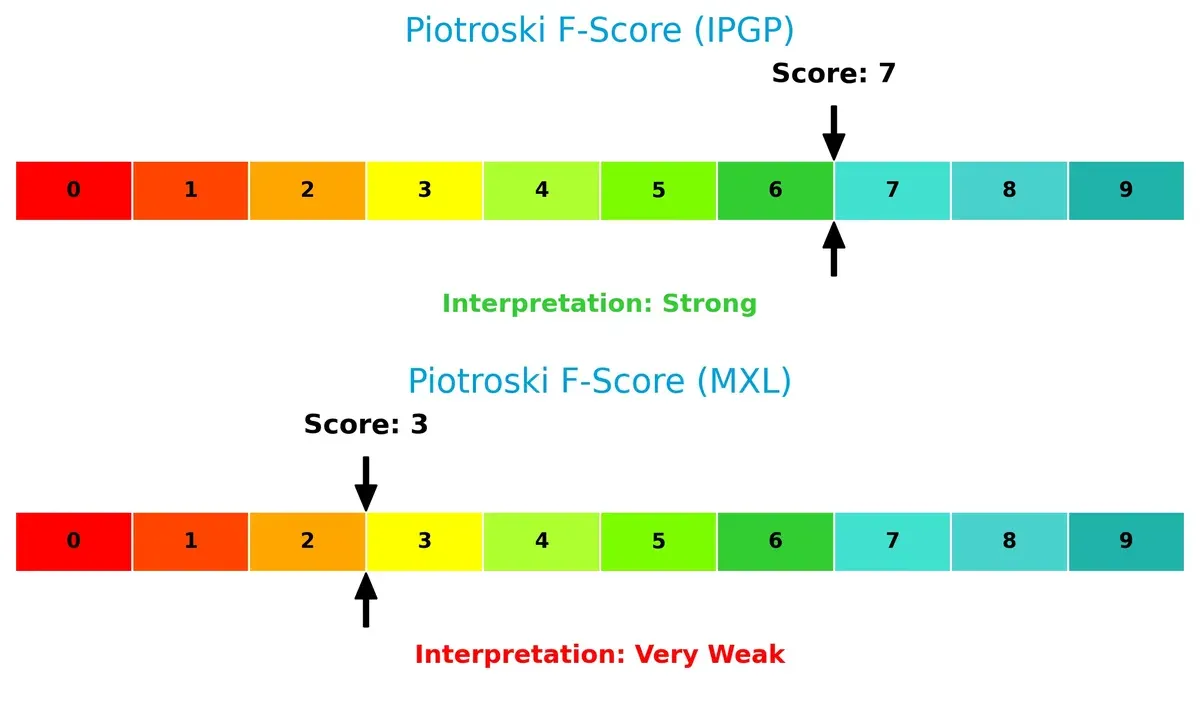
Financial Health: Quality of Operations
IPGP’s Piotroski F-Score of 7 indicates strong financial health and operational quality. MXL’s score of 3 raises red flags, reflecting weak profitability and efficiency metrics relative to its peer:
How are the two companies positioned?
This section dissects IPGP and MXL’s operational DNA by comparing revenue distribution and internal strengths and weaknesses. The goal is to confront their economic moats and identify which model delivers the most resilient, sustainable competitive advantage today.
Revenue Segmentation: The Strategic Mix
This visual comparison dissects how IPG Photonics Corporation and MaxLinear, Inc. diversify their income streams and reveals where their primary sector bets lie:
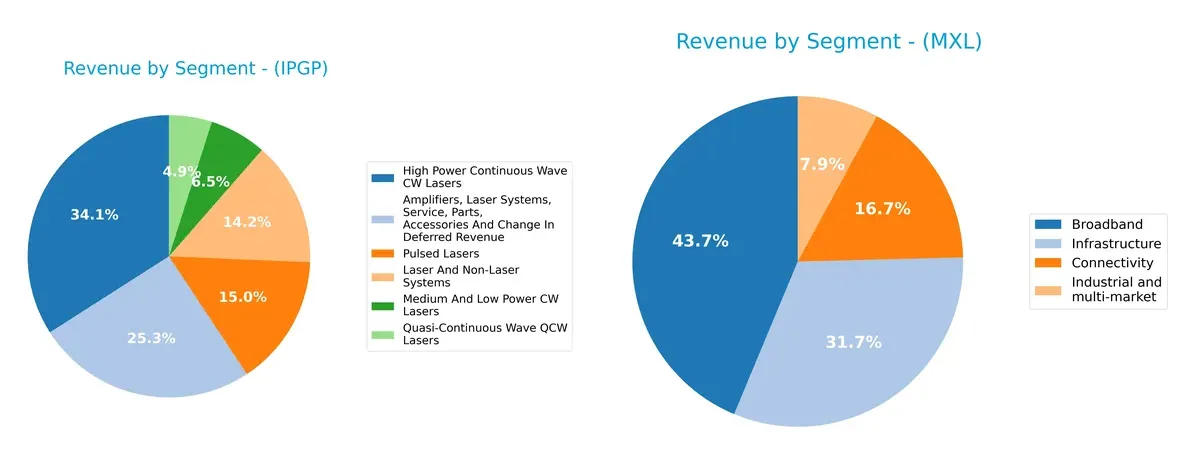
IPG Photonics anchors its revenue in High Power Continuous Wave CW Lasers at $333M (2024), showing a concentrated but technologically specialized portfolio. In contrast, MaxLinear displays a more diversified mix with Broadband ($204M), Infrastructure ($148M), Connectivity ($78M), and Industrial ($37M) segments in 2025. IPGP’s focus signals strong niche dominance but higher concentration risk. MXL’s spread across multiple markets suggests resilience via ecosystem lock-in and less reliance on a single sector.
Strengths and Weaknesses Comparison
This table compares the Strengths and Weaknesses of IPG Photonics Corporation and MaxLinear, Inc.:
IPGP Strengths
- Diverse laser product segments support revenue stability
- Strong quick ratio at 5.59 indicates liquidity
- Very low debt-to-assets at 0.78% reduces financial risk
- Interest coverage infinite, showing debt service capacity
MXL Strengths
- Multiple technology segments diversify revenue streams
- Favorable current and quick ratios reflect good liquidity
- Moderate debt-to-assets at 17.23% manageable
- High fixed asset turnover at 4.65 signals efficient asset use
IPGP Weaknesses
- Negative net margin (-18.58%) and ROE (-8.97%) signal profitability issues
- Asset turnover low at 0.43 suggests underutilized assets
- Current ratio extremely high at 6.98 may indicate inefficient working capital
- No dividend yield limits income appeal
MXL Weaknesses
- Severely negative net margin (-68.01%) and ROE (-47.49%) reflect deep losses
- WACC at 11.7% is unfavorable, increasing capital cost
- Interest coverage negative, risking debt servicing
- PB ratio of 3.2 may indicate overvaluation concerns
- Asset turnover low at 0.42
IPGP shows stronger balance sheet health and better debt management but suffers from profitability and asset use challenges. MXL’s broader diversification and asset efficiency contrast with its serious profitability and capital cost weaknesses. Both companies face risks that will shape their strategic priorities.
The Moat Duel: Analyzing Competitive Defensibility
A structural moat is the only reliable shield protecting long-term profits from relentless competitive erosion in dynamic markets:
IPG Photonics Corporation: Intangible Asset Moat with Technological Leadership
IPGP’s moat stems from proprietary fiber laser technology, enabling premium pricing and stable gross margins near 35%. However, declining revenue and net income signal rising competitive pressure in 2026.
MaxLinear, Inc.: Integrated Systems Cost Advantage
MXL leverages SoC integration to reduce costs and capture broadband market share. Its 57% gross margin growth and expanding revenue highlight operational strength, though EBIT losses weigh on moat durability versus IPGP.
Verdict: Proprietary Technology vs. Cost Integration Battle
Both firms struggle with negative ROIC trends, indicating value erosion. Still, IPGP’s intangible assets create a deeper moat than MXL’s cost advantage. IPGP is better positioned to defend market share amid intensifying competition.
Which stock offers better returns?
The past year reveals divergent price dynamics: IPG Photonics shows a modest but accelerating bullish trend, while MaxLinear faces a significant overall decline despite recent gains.
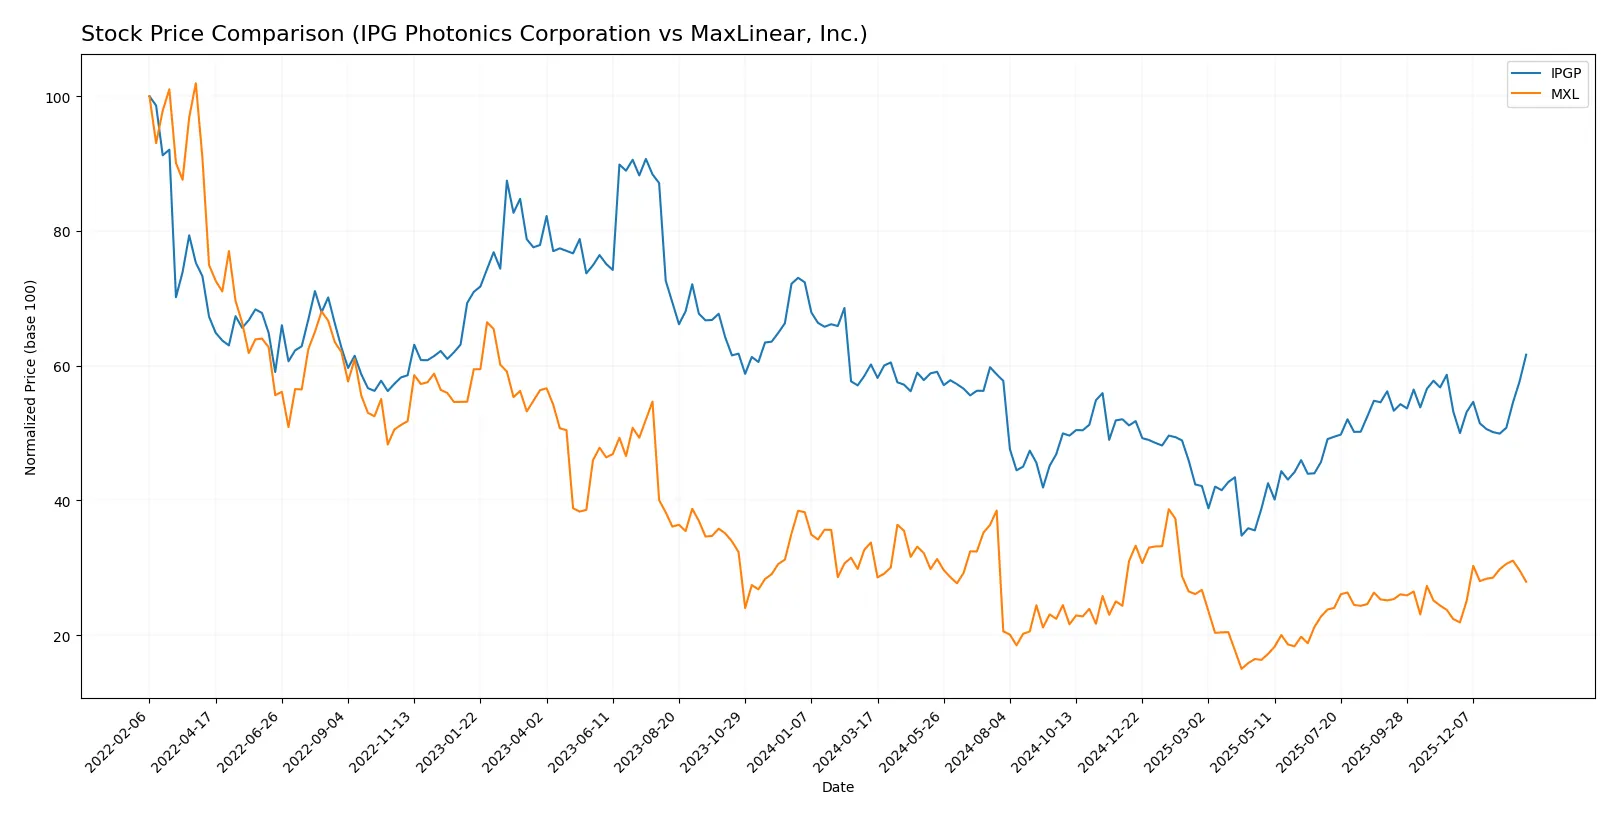
Trend Comparison
IPG Photonics posts a 2.4% price gain over 12 months, marking an accelerating bullish trend with notable volatility (std dev 9.36) and a high near 92.41.
MaxLinear suffers a 17.26% loss over the same period, reflecting an accelerating bearish trend with lower volatility (std dev 3.37) and a peak at 24.05.
Comparing both, IPG Photonics delivers the highest market performance with steady gains, contrasting MaxLinear’s broader decline despite recent upward momentum.
Target Prices
Analysts present a moderate upside potential for IPG Photonics and MaxLinear based on current consensus.
| Company | Target Low | Target High | Consensus |
|---|---|---|---|
| IPG Photonics Corporation | 92 | 96 | 94 |
| MaxLinear, Inc. | 15 | 25 | 21 |
IPG Photonics trades near its consensus target, signaling limited upside. MaxLinear’s consensus suggests a 21% upside from its current price, reflecting analyst optimism.

Don’t Let Luck Decide Your Entry Point
Optimize your entry points with our advanced ProRealTime indicators. You’ll get efficient buy signals with precise price targets for maximum performance. Start outperforming now!
How do institutions grade them?
IPG Photonics Corporation Grades
Here are recent grades from reputable institutions for IPG Photonics Corporation:
| Grading Company | Action | New Grade | Date |
|---|---|---|---|
| Citigroup | Upgrade | Buy | 2025-11-05 |
| Bernstein | Upgrade | Outperform | 2025-08-07 |
| Raymond James | Maintain | Strong Buy | 2025-05-07 |
| CL King | Upgrade | Buy | 2025-03-18 |
| Citigroup | Maintain | Sell | 2025-02-18 |
| Stifel | Maintain | Buy | 2025-02-12 |
| Needham | Maintain | Hold | 2025-02-12 |
| Seaport Global | Downgrade | Neutral | 2024-08-01 |
| Stifel | Maintain | Buy | 2024-07-31 |
| Raymond James | Maintain | Strong Buy | 2024-07-31 |
MaxLinear, Inc. Grades
Here are recent grades from reputable institutions for MaxLinear, Inc.:
| Grading Company | Action | New Grade | Date |
|---|---|---|---|
| Wells Fargo | Maintain | Equal Weight | 2026-01-30 |
| Benchmark | Maintain | Buy | 2026-01-16 |
| Benchmark | Maintain | Buy | 2025-10-24 |
| Benchmark | Maintain | Buy | 2025-10-17 |
| Benchmark | Maintain | Buy | 2025-09-02 |
| Loop Capital | Maintain | Hold | 2025-08-04 |
| Wells Fargo | Maintain | Equal Weight | 2025-07-24 |
| Benchmark | Maintain | Buy | 2025-07-24 |
| Susquehanna | Maintain | Neutral | 2025-07-24 |
| Susquehanna | Maintain | Neutral | 2025-07-22 |
Which company has the best grades?
IPG Photonics shows a stronger consensus with multiple upgrades to Buy and Strong Buy grades. MaxLinear’s ratings mostly hold steady at Buy or Equal Weight. Investors may view IPGP’s positive momentum as a sign of growing confidence, while MXL’s stable grades suggest more cautious institutional sentiment.
Risks specific to each company
The following categories identify the critical pressure points and systemic threats facing both firms in the 2026 market environment:
1. Market & Competition
IPG Photonics Corporation
- Faces intense competition in fiber lasers with pressure to innovate rapidly.
MaxLinear, Inc.
- Operates in a highly competitive SoC market with rapid technological shifts.
2. Capital Structure & Debt
IPG Photonics Corporation
- Nearly debt-free, excellent interest coverage, very low financial risk.
MaxLinear, Inc.
- Moderate debt level with negative interest coverage, raising solvency concerns.
3. Stock Volatility
IPG Photonics Corporation
- Beta near 1 suggests average market volatility, relatively stable.
MaxLinear, Inc.
- High beta of 1.77 indicates elevated stock price volatility and risk.
4. Regulatory & Legal
IPG Photonics Corporation
- Faces standard semiconductor regulatory scrutiny, no major legal red flags.
MaxLinear, Inc.
- Similar regulatory environment; higher risk due to rapid market changes.
5. Supply Chain & Operations
IPG Photonics Corporation
- Large scale with diversified suppliers, but vulnerable to materials cost swings.
MaxLinear, Inc.
- Smaller scale and higher operational leverage increase supply chain risks.
6. ESG & Climate Transition
IPG Photonics Corporation
- Moderate ESG focus; energy-intensive production may face rising costs.
MaxLinear, Inc.
- ESG efforts less visible; transition risks could impact cost structure.
7. Geopolitical Exposure
IPG Photonics Corporation
- US-based with global sales; exposed to trade tensions and export controls.
MaxLinear, Inc.
- Also US-based; supply chain and sales subject to geopolitical volatility.
Which company shows a better risk-adjusted profile?
IPG Photonics’ superior capital structure and moderate stock volatility offer a stronger risk-adjusted profile. MaxLinear’s high leverage, poor interest coverage, and elevated volatility heighten its risk. IPG’s Altman Z-score of 10.9 signals financial stability, unlike MaxLinear’s 2.1 in the grey zone. The greatest risk for IPG is rapid market competition; for MaxLinear, it is financial distress from weak capital structure.
Final Verdict: Which stock to choose?
IPG Photonics’ superpower lies in its robust cash generation and rock-solid balance sheet, offering strong liquidity and financial stability. However, its declining profitability signals a point of vigilance amid a challenging macro environment. It suits portfolios focused on resilient capital preservation with selective growth.
MaxLinear’s strategic moat is its high gross margins and aggressive R&D investment, signaling a push toward innovation-led growth. Relative to IPG Photonics, it carries higher operational risk and less financial stability. It fits a GARP (Growth at a Reasonable Price) portfolio that seeks turnaround potential with tolerance for volatility.
If you prioritize financial resilience and steady cash flow, IPG Photonics is the compelling choice due to its superior liquidity and balance sheet strength. However, if you seek growth fueled by innovation and can embrace higher risk, MaxLinear offers better upside through its strategic R&D focus despite its operational headwinds.
Disclaimer: Investment carries a risk of loss of initial capital. The past performance is not a reliable indicator of future results. Be sure to understand risks before making an investment decision.
Go Further
I encourage you to read the complete analyses of IPG Photonics Corporation and MaxLinear, Inc. to enhance your investment decisions: