Home > Comparison > Technology > KLAC vs IPGP
The strategic rivalry between KLA Corporation and IPG Photonics Corporation defines the current trajectory of the semiconductor industry. KLA operates as a capital-intensive leader in semiconductor process control, focusing on yield management and inspection technologies. In contrast, IPG Photonics specializes in high-performance fiber lasers for materials processing and communications. This analysis will assess which company’s business model presents a superior risk-adjusted opportunity for a diversified portfolio amid evolving technology demands.
Table of contents
Companies Overview
KLA Corporation and IPG Photonics Corporation are pivotal players in the semiconductor technology landscape.
KLA Corporation: Precision in Semiconductor Process Control
KLA Corporation commands a leading position in semiconductor process control solutions. It generates revenue through a diverse portfolio spanning wafer inspection, metrology, and defect analysis technologies. In 2026, KLA emphasizes integrated software and hardware to optimize semiconductor yield and quality, reinforcing its competitive advantage in advanced manufacturing diagnostics.
IPG Photonics Corporation: Innovator in Fiber Laser Technology
IPG Photonics Corporation specializes in high-performance fiber lasers and amplifiers crucial for materials processing and communications. Its core revenue stems from selling laser systems to OEMs and end users worldwide. In 2026, IPG focuses on expanding applications in telecommunications and industrial laser systems, driving innovation in precision laser technology.
Strategic Collision: Similarities & Divergences
Both companies operate within the semiconductor ecosystem but adopt distinct philosophies: KLA pursues integrated process control solutions, while IPG leverages cutting-edge fiber laser technology. Their primary battleground lies in supplying critical components for semiconductor fabrication and materials processing. Investors face contrasting profiles—KLA’s scale and diversified product mix versus IPG’s niche laser innovation and growth potential.
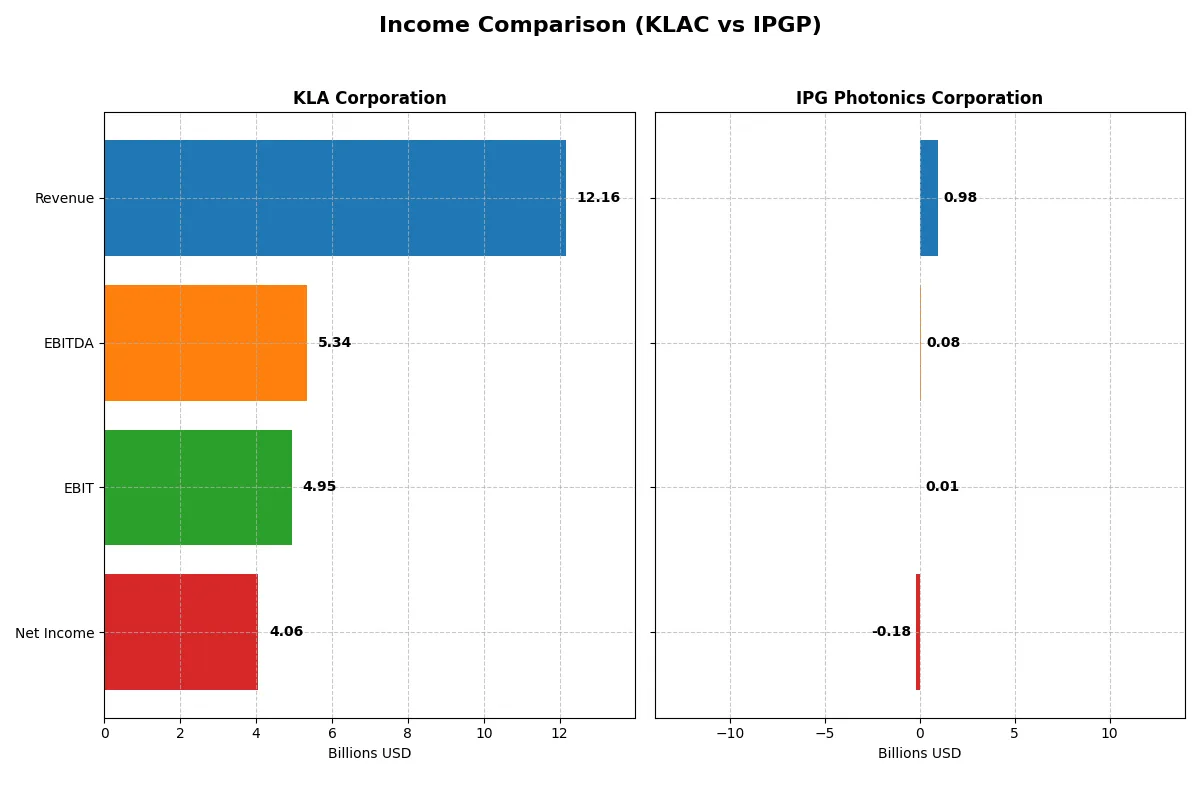
Income Statement Comparison
This data dissects the core profitability and scalability of both corporate engines to reveal who dominates the bottom line:
| Metric | KLA Corporation (KLAC) | IPG Photonics Corporation (IPGP) |
|---|---|---|
| Revenue | 12.2B | 977M |
| Cost of Revenue | 4.58B | 639M |
| Operating Expenses | 2.33B | 546M |
| Gross Profit | 7.58B | 338M |
| EBITDA | 5.34B | 76M |
| EBIT | 4.95B | 14M |
| Interest Expense | 302M | 0 |
| Net Income | 4.06B | -182M |
| EPS | 30.53 | -4.09 |
| Fiscal Year | 2025 | 2024 |
Income Statement Analysis: The Bottom-Line Duel
This income statement comparison exposes the true efficiency and profitability of each company’s business engine over recent years.
KLA Corporation Analysis
KLA’s revenue rose sharply from $6.9B in 2021 to $12.2B in 2025, nearly doubling in four years. Net income surged as well, hitting $4.1B in 2025. The company sustains robust margins: a gross margin of 62.3% and a net margin of 33.4%. Its EBIT margin stands out at 40.7%, reflecting operational excellence and strong cost control. Momentum is evident with 23.9% revenue growth and 41.3% EBIT growth in the latest year.
IPG Photonics Corporation Analysis
IPG’s revenue declined from $1.46B in 2021 to $977M in 2024, a 33% drop. Net income swung from a $278M profit in 2021 to a $182M loss in 2024. Gross margin held at 34.6%, but the EBIT margin collapsed to 1.5%, and net margin turned sharply negative at -18.6%. The latest year shows deteriorating profitability and shrinking scale, with revenue down 24.1% and net margin worsening by over 200%.
Growth and Margin Dominance vs. Declining Scale and Profitability
KLA clearly dominates with substantial revenue and profit growth, paired with industry-leading margins. IPG faces shrinking sales and steep margin deterioration, signaling operational and market challenges. For investors, KLA’s profile offers growth backed by efficient capital allocation, while IPG’s financials highlight significant risks and contraction.
Financial Ratios Comparison
These vital ratios act as a diagnostic tool to expose the underlying fiscal health, valuation premiums, and capital efficiency of the companies compared below:
| Ratios | KLA Corporation (KLAC) | IPG Photonics Corporation (IPGP) |
|---|---|---|
| ROE | 86.56% | -8.97% |
| ROIC | 37.97% | -9.97% |
| P/E | 29.34 | -17.76 |
| P/B | 25.39 | 1.59 |
| Current Ratio | 2.62 | 6.98 |
| Quick Ratio | 1.83 | 5.59 |
| D/E | 1.30 | 0.01 |
| Debt-to-Assets | 37.89% | 0.78% |
| Interest Coverage | 17.34 | 0 |
| Asset Turnover | 0.76 | 0.43 |
| Fixed Asset Turnover | 9.70 | 1.66 |
| Payout ratio | 22.27% | 0% |
| Dividend yield | 0.76% | 0% |
| Fiscal Year | 2025 | 2024 |
Efficiency & Valuation Duel: The Vital Signs
Financial ratios act as a company’s DNA, revealing hidden risks and operational excellence beyond surface-level figures.
KLA Corporation
KLA exhibits strong profitability with an 86.56% ROE and a 33.41% net margin, signaling operational efficiency. However, its valuation appears stretched, with a P/E of 29.34 and a high price-to-book of 25.39. Dividend yield is modest at 0.76%, reflecting limited shareholder returns but a focus on reinvesting in growth and R&D.
IPG Photonics Corporation
IPGP struggles with negative returns: ROE at -8.97% and net margin at -18.58%, indicating operational challenges. The stock trades at a negative P/E, which can signal distress but also a lower valuation risk. No dividends are paid, and the company maintains a conservative capital structure with minimal debt and strong liquidity, suggesting a defensive posture.
Premium Valuation vs. Operational Safety
KLA balances high profitability with stretched valuation, offering growth-oriented investors an efficient operator. IPGP presents a riskier profile with weak profitability but lower valuation and strong liquidity. KLA fits investors seeking operational strength, while IPGP suits those prioritizing balance sheet safety amid uncertainty.
Which one offers the Superior Shareholder Reward?
I compare KLA Corporation (KLAC) and IPG Photonics Corporation (IPGP) based on dividends, payout ratios, and buybacks. KLAC yields 0.76% with a 22% payout ratio, supported by strong free cash flow (28B) and steady buybacks enhancing returns. IPGP offers no dividends, reinvesting heavily in growth and R&D, with modest buybacks. KLAC’s balanced distribution and cash-backed dividends signal a more sustainable long-term reward. IPGP’s zero payout raises risk despite growth potential. I conclude KLAC provides a superior total shareholder return profile for 2026 investors.
Comparative Score Analysis: The Strategic Profile
The radar chart reveals the fundamental DNA and trade-offs of KLA Corporation and IPG Photonics Corporation, highlighting their financial strengths and vulnerabilities:
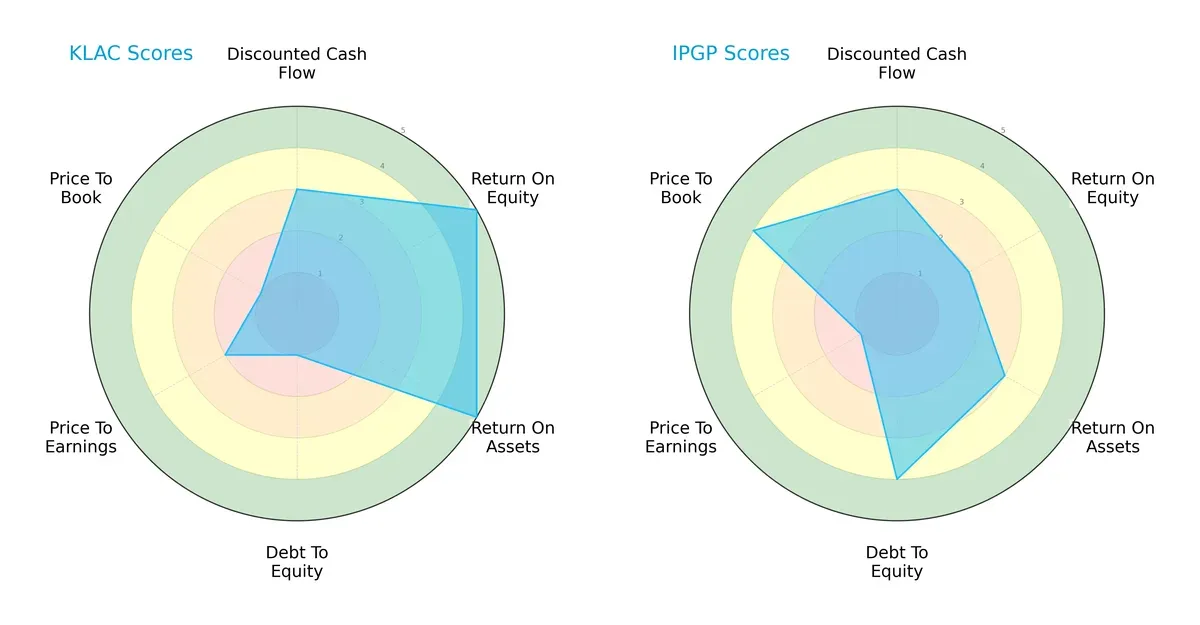
KLA demonstrates exceptional profitability with top-tier ROE and ROA scores (5 each), signaling efficient capital and asset use. However, it carries heavy financial risk, reflected by a very unfavorable debt-to-equity score (1). IPG offers a more balanced leverage profile with a favorable debt-to-equity score (4) but lags in profitability metrics (ROE 2, ROA 3). Valuation scores favor IPG’s price-to-book ratio (4), while KLA’s valuation metrics suggest potential overpricing. Overall, KLA relies on operational excellence, whereas IPG balances moderate profitability with financial stability.
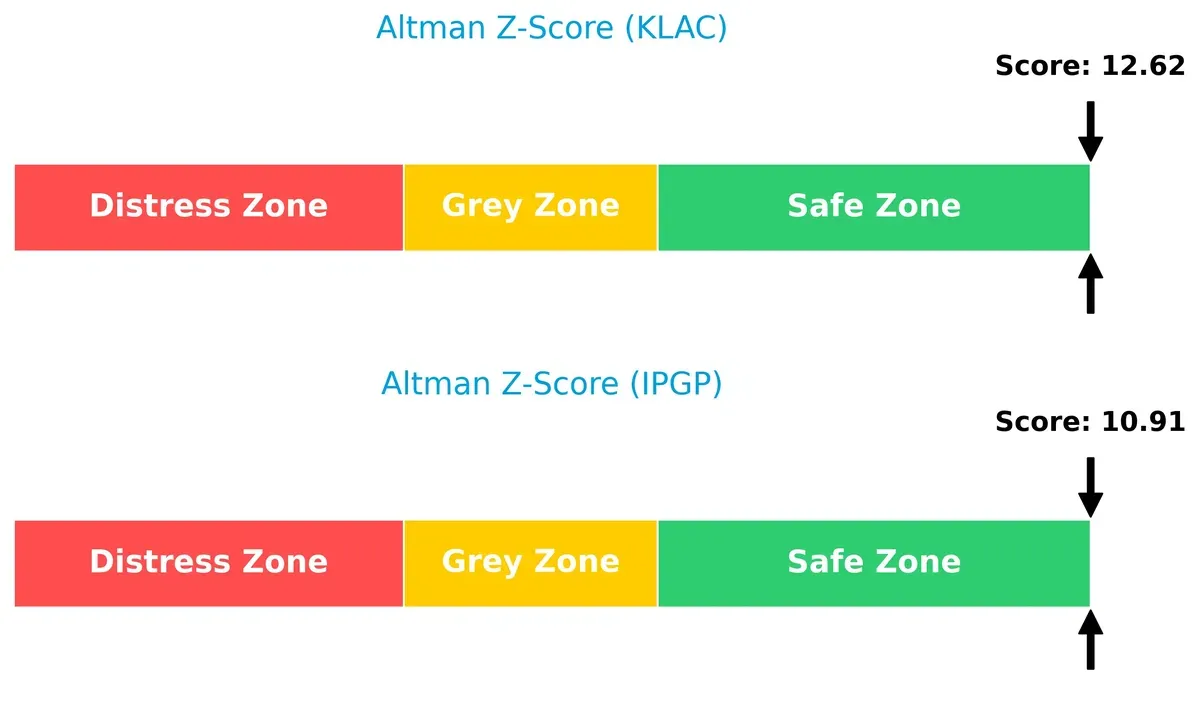
Bankruptcy Risk: Solvency Showdown
KLA’s Altman Z-Score of 12.62 surpasses IPG’s 10.91, both firmly in the safe zone, indicating strong solvency and low bankruptcy risk in this cycle:
Financial Health: Quality of Operations
KLA scores an 8 on the Piotroski F-Score, indicating very strong financial health. IPG follows closely with a strong 7, showing solid but slightly less robust internal metrics:
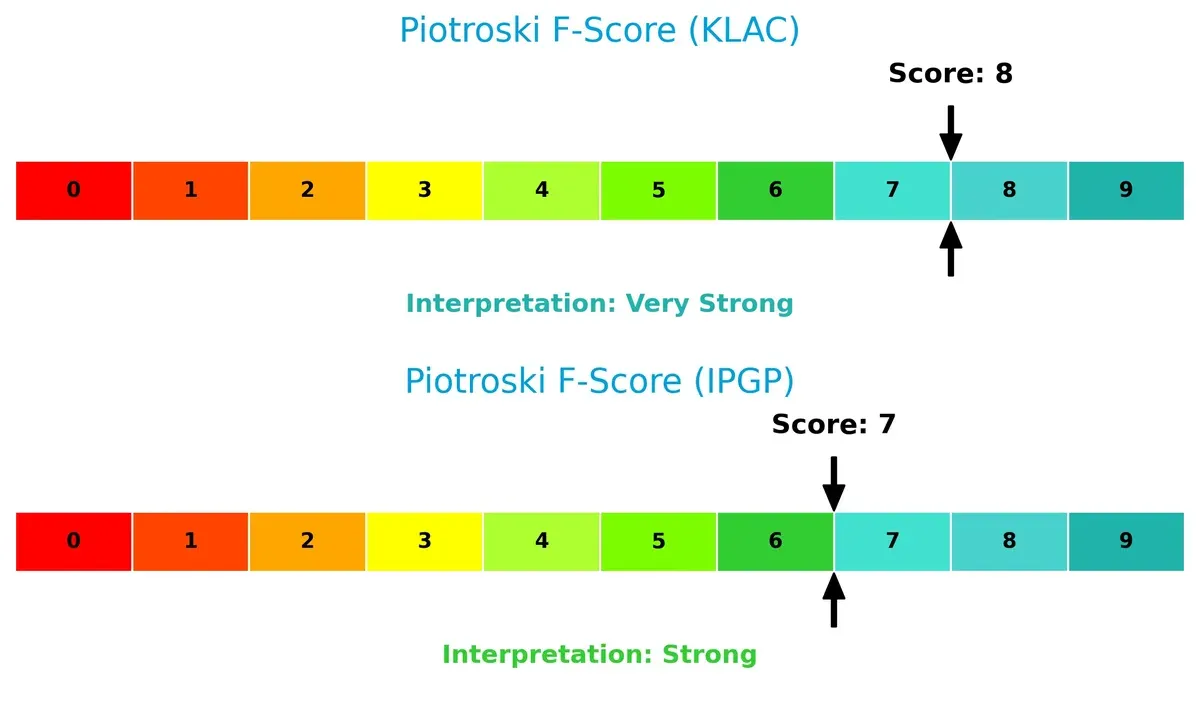
KLA’s higher Piotroski score underscores better profitability, liquidity, and operational efficiency, while IPG’s score suggests room for improvement despite overall strength.
How are the two companies positioned?
This section dissects KLAC and IPGP’s operational DNA by comparing their revenue distribution and internal strengths and weaknesses. The goal is to confront their economic moats to reveal which model offers the most resilient, sustainable competitive advantage today.
Revenue Segmentation: The Strategic Mix
This visual comparison dissects how KLA Corporation and IPG Photonics Corporation diversify their income streams and where their primary sector bets lie:
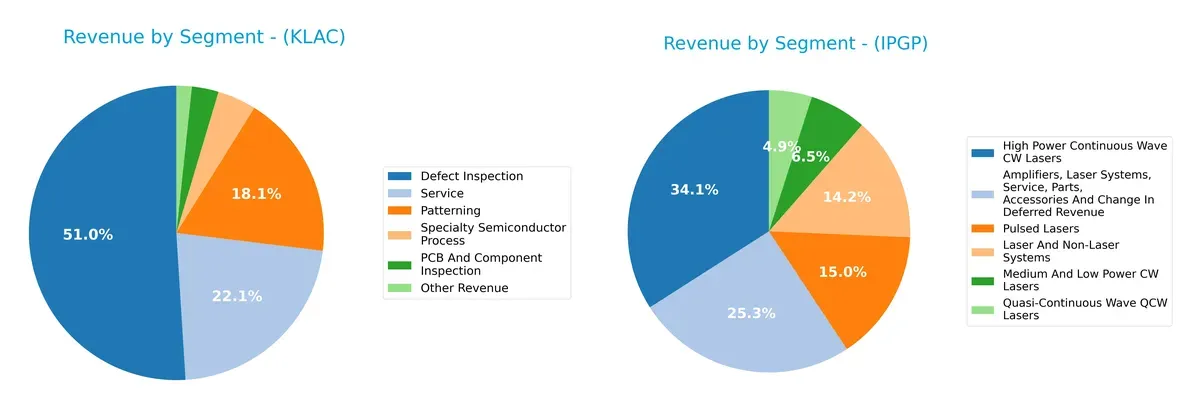
KLA leans heavily on Defect Inspection, anchoring $6.2B in 2025, dwarfing other segments like Patterning ($2.2B) and Service ($2.7B). This signals a strong infrastructure dominance but also some concentration risk. Conversely, IPG Photonics spreads revenue more evenly, with High Power CW Lasers at $333M and Amplifiers/Systems at $247M, reflecting a diversified portfolio that pivots across laser technologies and services.
Strengths and Weaknesses Comparison
This table compares the strengths and weaknesses of KLA Corporation and IPG Photonics Corporation:
KLA Corporation Strengths
- Strong profitability with 33.41% net margin and 86.56% ROE
- Favorable liquidity ratios: current ratio 2.62, quick ratio 1.83
- High fixed asset turnover at 9.7 indicates efficient asset use
- Diverse product segments including defect inspection and specialty semiconductor process
- Significant global presence with high revenues in China, Taiwan, and Korea
IPG Photonics Corporation Strengths
- Favorable debt metrics: very low debt-to-equity at 0.01 and debt-to-assets 0.78%
- Strong interest coverage with infinite ratio
- Favorable quick ratio of 5.59 indicates solid short-term liquidity
- Product range includes various laser systems and amplifiers
- Geographic diversification with notable revenue streams from North America, Europe, and China
KLA Corporation Weaknesses
- Elevated WACC at 10.42%, exceeding ROIC comfort zone
- Unfavorable valuation multiples: P/E 29.34 and P/B 25.39 suggest expensive stock
- Debt-to-equity ratio of 1.3 signals higher leverage risk
- Dividend yield low at 0.76% compared to peers
- Moderate asset turnover at 0.76 limits revenue efficiency
IPG Photonics Corporation Weaknesses
- Negative profitability: net margin -18.58%, ROE -8.97%, ROIC -9.97%
- Unfavorable current ratio at 6.98 may indicate inefficient asset use
- Unfavorable asset turnover at 0.43 reflects lower operational efficiency
- Zero dividend yield limits income potential for investors
The comparison reveals KLA’s strengths lie in profitability, liquidity, and asset efficiency, supported by diversified global revenues. IPG shows financial conservatism with low leverage and good liquidity but struggles with profitability and operational efficiency. These factors are crucial for shaping each company’s strategic priorities going forward.
The Moat Duel: Analyzing Competitive Defensibility
A structural moat shields a company’s long-term profits from relentless competition and market disruption. Here’s how KLA Corporation and IPG Photonics stack up:
KLA Corporation: Dominant Process Control Moat
KLA’s moat stems from its indispensable semiconductor process control technology. It sustains high ROIC above WACC by delivering superior yield management and inspection solutions. New product innovations and expanded market penetration in Asia reinforce its durable competitive edge in 2026.
IPG Photonics Corporation: Specialized Fiber Laser Moat Under Pressure
IPG relies on its fiber laser technology as a niche moat, but shrinking margins and negative ROIC trends reveal weakening competitive strength. Unlike KLA, IPG faces revenue declines and profitability erosion, signaling urgent need for market or product pivots to regain footing.
Verdict: Precision Process Control vs. Declining Laser Specialization
KLA’s wide, growing moat outclasses IPG’s shrinking value creation capabilities. KLA’s robust financials and expanding global footprint position it far better to protect market share and sustain profits amid semiconductor industry cycles.
Which stock offers better returns?
The past year reveals stark contrasts in price momentum and trading volumes between KLA Corporation and IPG Photonics Corporation, highlighting divergent investor sentiment and market dynamics.
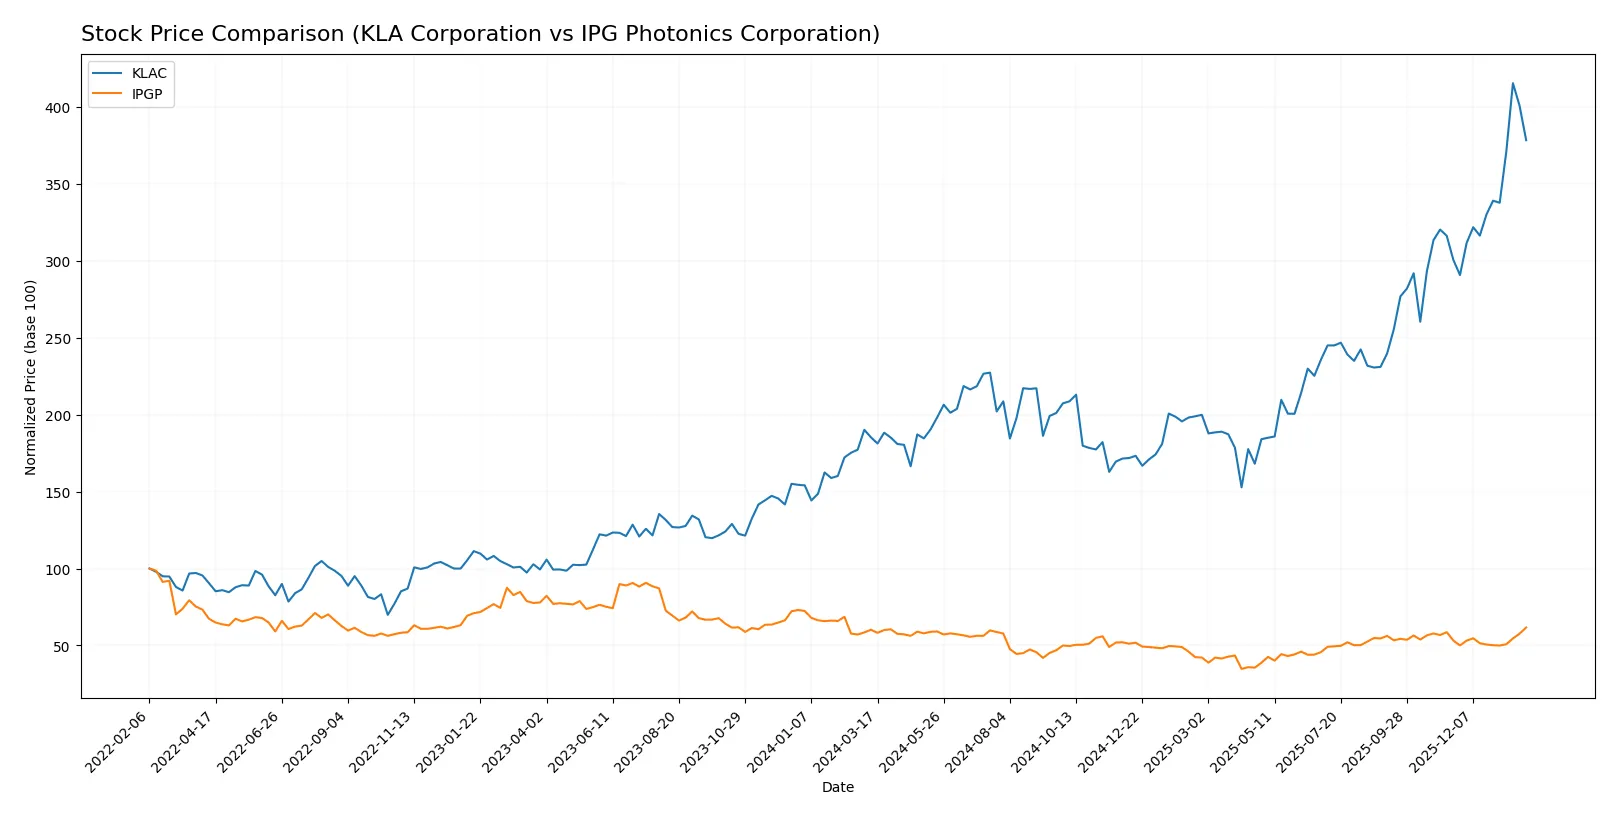
Trend Comparison
KLA Corporation’s stock surged 104.22% over the past 12 months, signaling a strong bullish trend with accelerating gains and notable volatility reflected in a 213.25 standard deviation. The price ranged from 576.53 to 1567.82, peaking sharply.
IPG Photonics Corporation posted a modest 2.4% gain over the same period, also bullish but with much lower volatility at 9.36 standard deviation. Its price fluctuated between 52.12 and 92.41, showing steady acceleration but limited upside.
KLA’s stock vastly outperformed IPG, delivering higher returns and greater price momentum, despite elevated volatility, confirming its dominant market performance over the last year.
Target Prices
Analysts present a clear consensus on target prices for KLA Corporation and IPG Photonics Corporation.
| Company | Target Low | Target High | Consensus |
|---|---|---|---|
| KLA Corporation | 1400 | 1900 | 1672.25 |
| IPG Photonics Corporation | 92 | 96 | 94 |
The consensus target for KLA suggests a 17% upside versus its current 1428 price, signaling moderate confidence in growth. IPG’s consensus aligns tightly with its current 92.41 price, indicating limited near-term price movement expectations.

Don’t Let Luck Decide Your Entry Point
Optimize your entry points with our advanced ProRealTime indicators. You’ll get efficient buy signals with precise price targets for maximum performance. Start outperforming now!
How do institutions grade them?
The following presents the latest institutional grades for KLA Corporation and IPG Photonics Corporation:
KLA Corporation Grades
This table summarizes recent grades from leading financial institutions for KLA Corporation.
| Grading Company | Action | New Grade | Date |
|---|---|---|---|
| Oppenheimer | Maintain | Outperform | 2026-01-30 |
| Barclays | Maintain | Overweight | 2026-01-30 |
| Cantor Fitzgerald | Maintain | Overweight | 2026-01-30 |
| Jefferies | Maintain | Buy | 2026-01-30 |
| Stifel | Maintain | Buy | 2026-01-30 |
| Wells Fargo | Maintain | Overweight | 2026-01-30 |
| Needham | Maintain | Buy | 2026-01-30 |
| RBC Capital | Maintain | Sector Perform | 2026-01-30 |
| Deutsche Bank | Maintain | Hold | 2026-01-21 |
| Needham | Maintain | Buy | 2026-01-20 |
IPG Photonics Corporation Grades
Below is a summary of recent institutional grades for IPG Photonics Corporation.
| Grading Company | Action | New Grade | Date |
|---|---|---|---|
| Citigroup | Upgrade | Buy | 2025-11-05 |
| Bernstein | Upgrade | Outperform | 2025-08-07 |
| Raymond James | Maintain | Strong Buy | 2025-05-07 |
| CL King | Upgrade | Buy | 2025-03-18 |
| Citigroup | Maintain | Sell | 2025-02-18 |
| Stifel | Maintain | Buy | 2025-02-12 |
| Needham | Maintain | Hold | 2025-02-12 |
| Seaport Global | Downgrade | Neutral | 2024-08-01 |
| Stifel | Maintain | Buy | 2024-07-31 |
| Raymond James | Maintain | Strong Buy | 2024-07-31 |
Which company has the best grades?
KLA Corporation consistently receives buy or overweight ratings, indicating broad institutional confidence. IPG Photonics grades are more mixed, including upgrades but also a notable sell rating. Investors may interpret KLA’s steadier positive consensus as a sign of stronger market endorsement.
Risks specific to each company
The following categories identify the critical pressure points and systemic threats facing both firms in the 2026 market environment:
1. Market & Competition
KLA Corporation
- Operates in highly competitive semiconductor process control sector with strong incumbents and cyclical demand.
IPG Photonics Corporation
- Faces niche competition in fiber lasers and amplifiers, with technology innovation critical to maintain edge.
2. Capital Structure & Debt
KLA Corporation
- High debt-to-equity (1.3) is a red flag; leverage raises financial risk despite strong interest coverage.
IPG Photonics Corporation
- Extremely low debt levels (D/E 0.01) indicate conservative capital structure and low financial risk.
3. Stock Volatility
KLA Corporation
- Beta 1.44 signals higher-than-market volatility, exposing investors to bigger swings.
IPG Photonics Corporation
- Beta near 1.02 implies volatility close to market average, offering more stable price behavior.
4. Regulatory & Legal
KLA Corporation
- Semiconductor industry faces export controls and IP protection challenges that could disrupt operations.
IPG Photonics Corporation
- Laser manufacturing is subject to export regulations and safety standards; compliance costs remain elevated.
5. Supply Chain & Operations
KLA Corporation
- Complex global supply chain vulnerable to semiconductor supply shocks and geopolitical tensions.
IPG Photonics Corporation
- Specialized component sourcing risks exist but smaller scale may allow greater operational flexibility.
6. ESG & Climate Transition
KLA Corporation
- Pressure to reduce carbon footprint and improve resource efficiency amid tightening regulations.
IPG Photonics Corporation
- Emerging ESG demands may impact manufacturing costs but also create innovation opportunities.
7. Geopolitical Exposure
KLA Corporation
- Significant exposure to US-China tech rivalry risks supply disruptions and market access limits.
IPG Photonics Corporation
- Moderate geopolitical risk due to global sales but less dependency on China than peers.
Which company shows a better risk-adjusted profile?
KLA Corporation’s greatest risk lies in its leveraged capital structure amid volatile market conditions. IPG Photonics struggles with negative profitability and operational inefficiencies but benefits from a conservative balance sheet and lower volatility. Given the data, IPG offers a better risk-adjusted profile supported by minimal debt and stable stock volatility, despite current profitability challenges. KLA’s high debt and beta raise concerns, especially in the uncertain semiconductor cycle of 2026.
Final Verdict: Which stock to choose?
KLA Corporation’s superpower lies in its durable competitive advantage, backed by a robust and growing ROIC well above its cost of capital. It excels in generating strong cash flows and operational efficiency. A point of vigilance is its relatively high leverage, which could amplify risks in volatile markets. It fits well within an Aggressive Growth portfolio seeking durable value creation.
IPG Photonics stands out for its strong balance sheet and minimal debt, offering a strategic moat in cutting-edge photonics technology. Despite recent profitability challenges, its solid liquidity cushions downside risks, providing better safety relative to KLA. It suits a GARP investor profile looking for potential turnaround stories with reasonable financial stability.
If you prioritize consistent value creation and operational excellence, KLA Corporation outshines as the compelling choice due to its strong moat and growth trajectory. However, if you seek a safer balance sheet combined with strategic niche exposure, IPG Photonics offers better stability and a potentially undervalued entry point. Both cases warrant careful risk consideration aligned with your investment goals.
Disclaimer: Investment carries a risk of loss of initial capital. The past performance is not a reliable indicator of future results. Be sure to understand risks before making an investment decision.
Go Further
I encourage you to read the complete analyses of KLA Corporation and IPG Photonics Corporation to enhance your investment decisions: