Home > Comparison > Technology > WDC vs IONQ
The strategic rivalry between Western Digital Corporation and IonQ, Inc. shapes the evolution of the technology sector. Western Digital operates as a capital-intensive computer hardware powerhouse specializing in data storage devices. In contrast, IonQ pioneers quantum computing systems with a lean, innovation-driven model. This analysis pits established scale against disruptive potential to identify which trajectory offers superior risk-adjusted returns for a diversified portfolio.
Table of contents
Companies Overview
Western Digital and IonQ represent two distinct technology frontiers shaping data storage and computing markets.
Western Digital Corporation: Data Storage Powerhouse
Western Digital dominates the data storage industry with a vast portfolio of HDDs, SSDs, and flash memory products. It generates revenue by selling storage devices for PCs, mobile, enterprise servers, and IoT applications worldwide. In 2026, Western Digital emphasizes expanding its enterprise data center solutions and tiered storage platforms to strengthen its competitive edge.
IonQ, Inc.: Quantum Computing Pioneer
IonQ leads in general-purpose quantum computing systems, providing cloud-based access to its 20-qubit quantum computers. Its core revenue comes from partnerships with major cloud platforms like AWS, Microsoft Azure, and Google Cloud. IonQ’s 2026 strategy focuses on scaling quantum accessibility and increasing integration within commercial cloud ecosystems.
Strategic Collision: Similarities & Divergences
Western Digital and IonQ both push technological boundaries but differ fundamentally in approach. Western Digital relies on mature, physical hardware with a broad, diversified customer base. IonQ pursues a cutting-edge, cloud-centric model targeting nascent quantum markets. Their primary battleground is the future of data processing and storage innovation. Investors will find sharply contrasting risk and growth profiles in these tech pioneers.
Income Statement Comparison
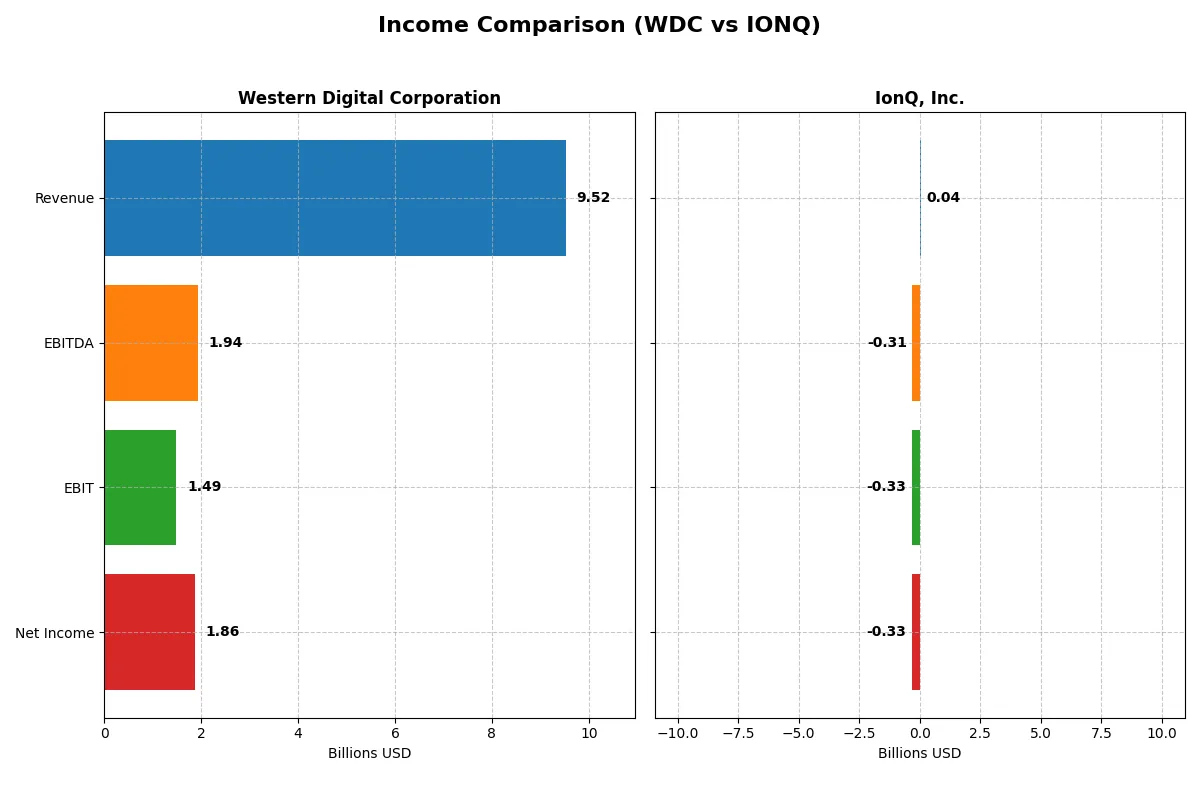
This data dissects the core profitability and scalability of both corporate engines to reveal who dominates the bottom line:
| Metric | Western Digital Corporation (WDC) | IonQ, Inc. (IONQ) |
|---|---|---|
| Revenue | 9.52B | 43.1M |
| Cost of Revenue | 5.83B | 39.3M |
| Operating Expenses | 1.36B | 235M |
| Gross Profit | 3.69B | 3.82M |
| EBITDA | 1.94B | -313M |
| EBIT | 1.49B | -332M |
| Interest Expense | 357M | 0 |
| Net Income | 1.86B | -332M |
| EPS | 5.31 | -1.56 |
| Fiscal Year | 2025 | 2024 |
Income Statement Analysis: The Bottom-Line Duel
This income statement comparison reveals which company operates with superior efficiency and sustainable profitability.
Western Digital Corporation Analysis
Western Digital’s revenue surged from 6.3B in 2024 to 9.5B in 2025, reversing a prior decline. Its net income turned positive at 1.86B, driven by a robust 38.8% gross margin and a 19.6% net margin, reflecting strong operational recovery and margin expansion. The 2025 figures highlight effective cost control and significant profit momentum.
IonQ, Inc. Analysis
IonQ doubled its revenue from 22M in 2023 to 43M in 2024 but remains deeply unprofitable with a net loss of 332M. The gross margin is a modest 8.9%, while the net margin plunges near -770%, indicating high costs and weak scalability. Despite impressive revenue growth, its losses and negative margins reveal ongoing operational challenges.
Margin Strength vs. Growth Struggles
Western Digital delivers clear fundamental strength with expanding margins and solid net profit, outperforming IonQ’s high-growth but persistently unprofitable profile. Western Digital’s consistent profitability appeals to investors prioritizing efficiency, while IonQ’s profile suits those accepting high risk for potential innovation gains.
Financial Ratios Comparison
These vital ratios act as a diagnostic tool to expose the underlying fiscal health, valuation premiums, and capital efficiency of the companies compared below:
| Ratios | Western Digital Corporation (WDC) | IonQ, Inc. (IONQ) |
|---|---|---|
| ROE | 35.0% | -86.4% |
| ROIC | 21.5% | -48.6% |
| P/E | 11.8 | -26.8 |
| P/B | 4.14 | 23.18 |
| Current Ratio | 1.08 | 10.50 |
| Quick Ratio | 0.84 | 9.98 |
| D/E | 0.96 | 0.05 |
| Debt-to-Assets | 36.3% | 3.5% |
| Interest Coverage | 6.54 | 0 |
| Asset Turnover | 0.68 | 0.08 |
| Fixed Asset Turnover | 4.06 | 0.69 |
| Payout ratio | 2.36% | 0 |
| Dividend yield | 0.20% | 0 |
| Fiscal Year | 2025 | 2024 |
Efficiency & Valuation Duel: The Vital Signs
Financial ratios serve as a company’s DNA, uncovering hidden risks and operational strengths that raw numbers alone cannot reveal.
Western Digital Corporation
Western Digital reports a strong 35% ROE and healthy 19.55% net margin, signaling robust profitability. Its P/E ratio of 11.8 suggests the stock trades at a reasonable valuation. The company maintains modest shareholder returns via a low 0.2% dividend yield, focusing on reinvestment in R&D and operational efficiency, reflected in favorable fixed asset turnover.
IonQ, Inc.
IonQ exhibits deeply negative profitability metrics, with an ROE of -86.4% and a staggering -770% net margin, indicating severe operational losses. Despite a negative P/E, valuation metrics appear stretched, with a high price-to-book at 23.18. IonQ invests heavily in R&D (over 300% of revenue), foregoing dividends and accepting elevated risks for growth potential.
Profitability Strength vs. Growth Gambit
Western Digital offers a far superior balance of profitability and valuation discipline. IonQ’s profile suits investors seeking high-risk, high-growth opportunities but carries significant operational losses. Conservative investors benefit from Western Digital’s stable returns, while growth-oriented investors may tolerate IonQ’s volatility.
Which one offers the Superior Shareholder Reward?
Western Digital Corporation (WDC) offers a modest dividend yield of 0.20% with a very low payout ratio of 2.4%, reflecting strong free cash flow coverage at 76%. Its buyback program is active, supporting shareholder returns sustainably. IonQ, Inc. (IONQ) pays no dividends and invests heavily in growth and R&D, but posts persistent losses and negative free cash flow. Its share buybacks are negligible. Given WDC’s positive cash flow, disciplined capital allocation, and shareholder-friendly distribution, I judge WDC provides a superior total return profile in 2026 compared to IonQ’s growth-at-losses model.
Comparative Score Analysis: The Strategic Profile
The radar chart reveals the fundamental DNA and trade-offs of Western Digital Corporation and IonQ, Inc., highlighting their financial strengths and vulnerabilities:
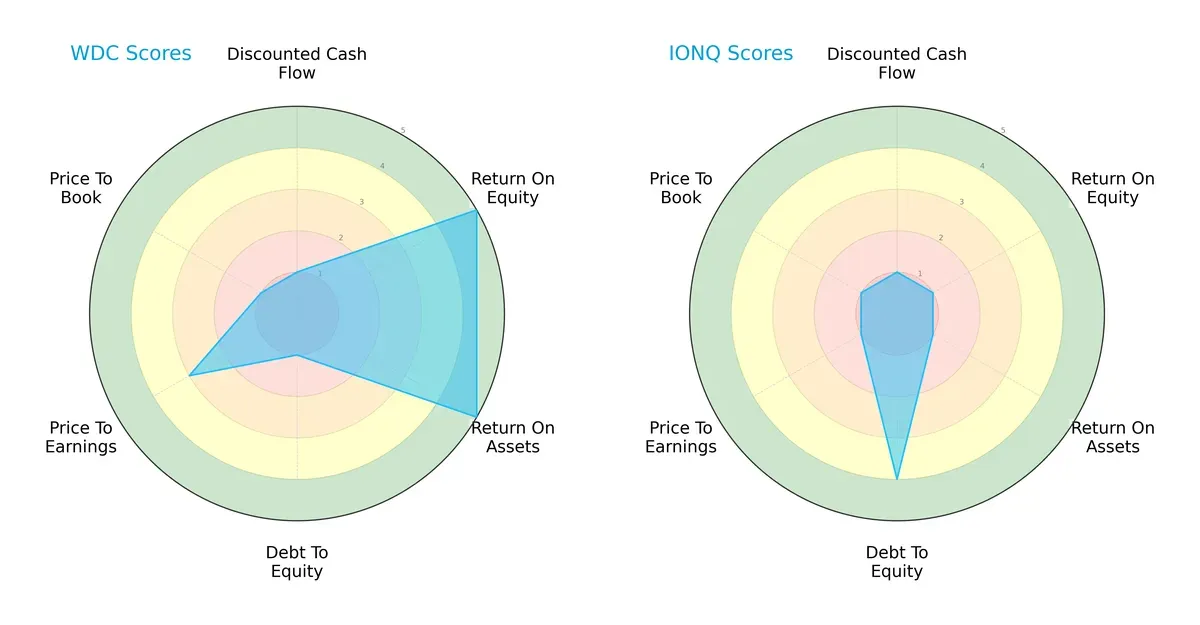
Western Digital dominates in profitability metrics with high ROE and ROA scores of 5 each, signaling efficient asset utilization and shareholder returns. However, its debt-to-equity and price-to-book scores score very low at 1, indicating financial leverage risks and potential overvaluation on book value. IonQ, conversely, shows a favorable debt-to-equity score of 4, reflecting a stronger balance sheet with lower financial risk. Yet, IonQ lags significantly in profitability and valuation metrics, displaying an unbalanced profile reliant on capital structure advantages rather than operational efficiency. Western Digital presents the more balanced profile overall.
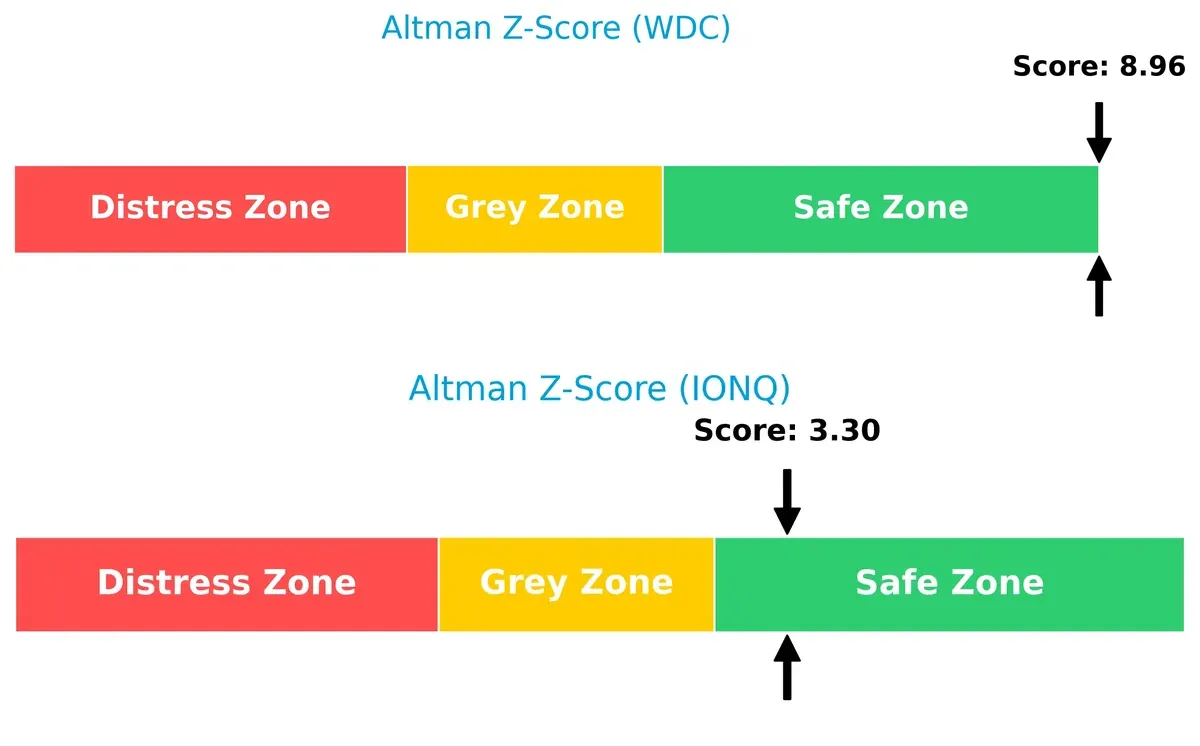
Bankruptcy Risk: Solvency Showdown
Western Digital’s Altman Z-Score at 8.96 vastly exceeds IonQ’s 3.30, signaling a far stronger buffer against bankruptcy risk in this market cycle:
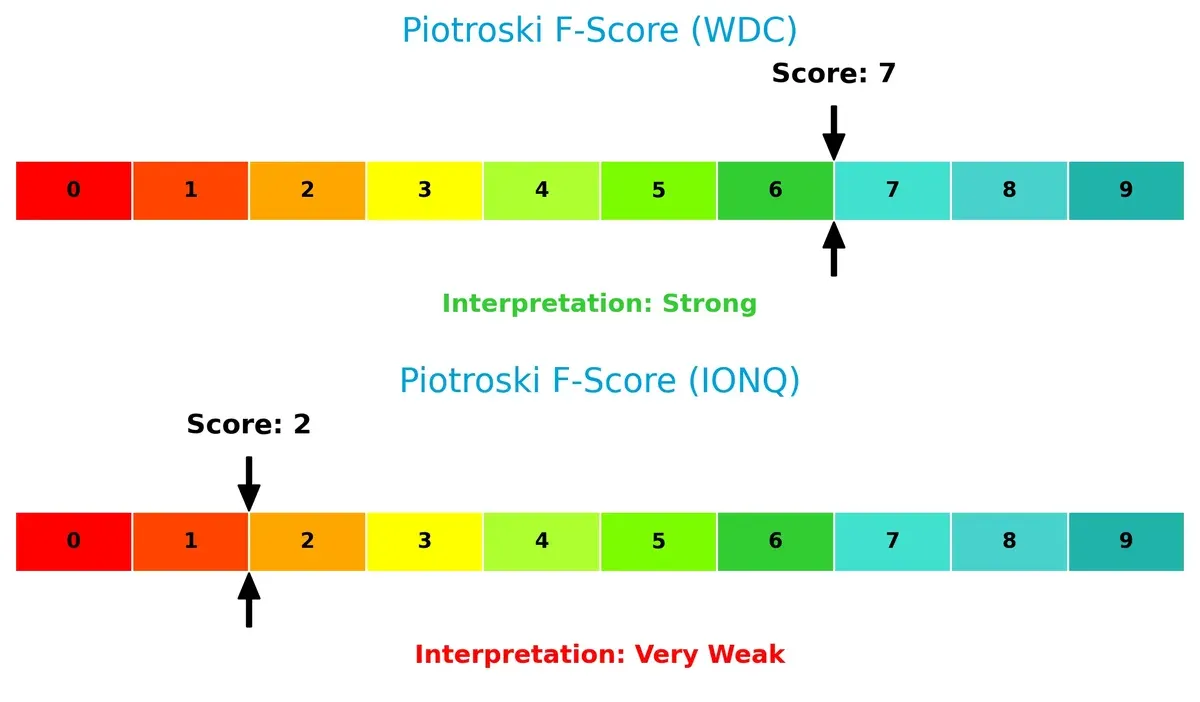
Financial Health: Quality of Operations
Western Digital’s Piotroski F-Score of 7 indicates robust financial health and operational quality, while IonQ’s score of 2 raises red flags about internal financial weaknesses and sustainability:
How are the two companies positioned?
This section dissects the operational DNA of WDC and IONQ by comparing their revenue distribution and internal dynamics. The goal is to confront their economic moats to identify which model offers the most resilient, sustainable advantage today.
Revenue Segmentation: The Strategic Mix
The following comparison dissects how Western Digital Corporation and IonQ, Inc. diversify their income streams and where their primary sector bets lie:
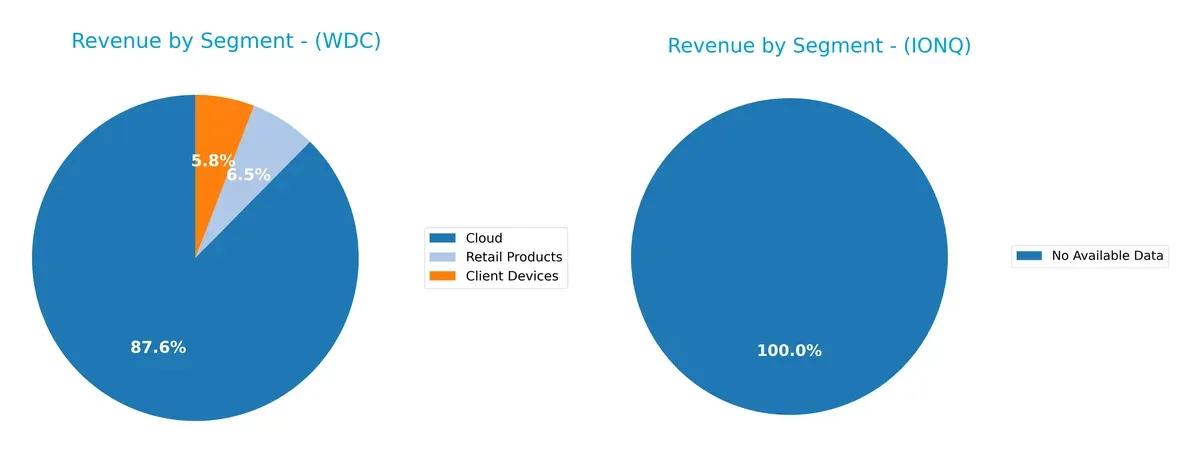
Western Digital relies heavily on a few core segments, with Cloud revenue at $8.34B dominating its $9.63B total in 2025, while Client Devices and Retail Products lag far behind. IonQ lacks available data, preventing comparison. Western Digital’s concentration in Cloud signals infrastructure dominance but also exposes it to sector cyclicality. Its less diversified mix contrasts with IonQ’s unknown segmentation, highlighting Western Digital’s clear strategic focus.
Strengths and Weaknesses Comparison
This table compares the Strengths and Weaknesses of Western Digital Corporation and IonQ, Inc.:
Western Digital Corporation Strengths
- Strong profitability with net margin 19.55% and ROE 35.04%
- Favorable ROIC at 21.53% above WACC
- Diverse revenue streams across Cloud, Client Devices, Retail Products
- Established global presence with significant revenue from Asia, Americas, EMEA
- Efficient fixed asset turnover at 4.06
IonQ, Inc. Strengths
- Low debt-to-equity at 0.05 and debt-to-assets 3.49% implies low leverage
- High current and quick ratios indicate strong short-term liquidity
- Favorable price-to-earnings despite negative net margin, suggesting growth expectations
Western Digital Corporation Weaknesses
- WACC at 12.18% exceeds ROIC, indicating capital cost concerns
- Price-to-book ratio at 4.14 suggests potential overvaluation
- Neutral liquidity ratios with current ratio 1.08 and quick ratio 0.84
- Low dividend yield at 0.2% may deter income investors
IonQ, Inc. Weaknesses
- Negative net margin -769.96%, ROE -86.4%, and ROIC -48.55% indicate sustained losses
- High WACC at 16.18% raises capital cost issues
- Weak asset turnover metrics with 0.08 overall and 0.69 fixed asset turnover
- Zero interest coverage and dividend yield highlight financial strain
Western Digital shows solid profitability and a broad global footprint, but faces capital cost and valuation challenges. IonQ struggles with profitability and efficiency despite strong liquidity and low leverage, reflecting early-stage or high-risk characteristics. These factors will critically shape each company’s strategic priorities moving forward.
The Moat Duel: Analyzing Competitive Defensibility
A structural moat shields long-term profits from relentless competitive pressures. Without it, market share and margins erode swiftly:
Western Digital Corporation: Cost Advantage and Scale Moat
Western Digital leverages economies of scale and cost efficiency, reflected in its strong 38.8% gross margin and 15.6% EBIT margin. Its durable moat grows as it expands advanced storage solutions globally in 2026.
IonQ, Inc.: Innovation-Driven Moat with Uncertain Profitability
IonQ’s competitive edge stems from cutting-edge quantum computing technology, but its negative ROIC and steep margin losses highlight a fragile moat. Expansion hinges on commercializing quantum access effectively in 2026.
Scale Efficiency vs. Quantum Innovation: The Moat Showdown
Western Digital’s wide, expanding moat benefits from proven cost advantages and rising ROIC. IonQ’s narrow moat relies on nascent tech with declining ROIC. Western Digital is far better equipped to defend and grow market share.
Which stock offers better returns?
Over the past year, Western Digital surged sharply with accelerating gains, while IonQ showed a strong overall rise but recent decline, reflecting divergent momentum and trading dynamics.
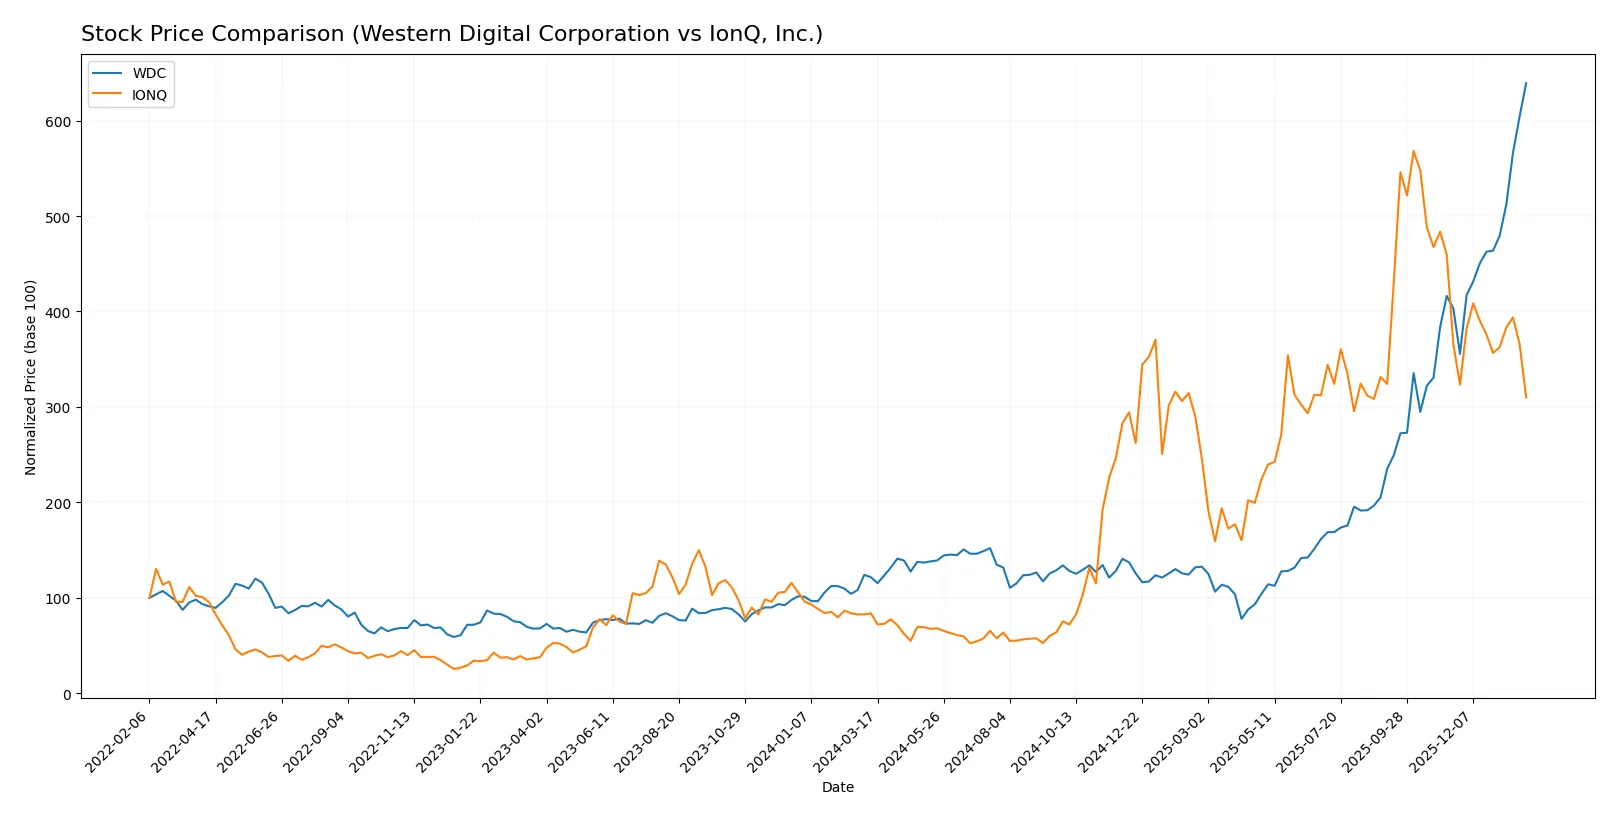
Trend Comparison
Western Digital’s stock price increased 426% over the past 12 months, marking a bullish trend with acceleration and high volatility between $30.54 and $250.23. Recent gains remain strong at +58.54%.
IonQ’s stock rose 270% over the same period, confirming a bullish trend but with deceleration. Recent months show a -15.26% decline, indicating short-term weakness amid lower volatility.
Western Digital outperformed IonQ by a wide margin, delivering higher total returns and demonstrating stronger recent momentum despite greater price swings.
Target Prices
Analysts present a mixed but optimistic consensus for Western Digital Corporation and IonQ, Inc.
| Company | Target Low | Target High | Consensus |
|---|---|---|---|
| Western Digital Corporation | 180 | 325 | 268.2 |
| IonQ, Inc. | 55 | 100 | 72.57 |
Western Digital’s target consensus exceeds its current price of 250.23, signaling upside potential. IonQ’s consensus target price is nearly double its current 39.98, reflecting high growth expectations.

Don’t Let Luck Decide Your Entry Point
Optimize your entry points with our advanced ProRealTime indicators. You’ll get efficient buy signals with precise price targets for maximum performance. Start outperforming now!
How do institutions grade them?
This section presents the latest institutional grades for Western Digital Corporation and IonQ, Inc.:
Western Digital Corporation Grades
The table below summarizes recent grades from reputable financial institutions for Western Digital Corporation.
| Grading Company | Action | New Grade | Date |
|---|---|---|---|
| TD Cowen | Maintain | Buy | 2026-01-30 |
| Goldman Sachs | Maintain | Neutral | 2026-01-30 |
| Cantor Fitzgerald | Maintain | Overweight | 2026-01-30 |
| Morgan Stanley | Maintain | Overweight | 2026-01-30 |
| Wedbush | Maintain | Outperform | 2026-01-30 |
| Wells Fargo | Maintain | Overweight | 2026-01-30 |
| Mizuho | Maintain | Outperform | 2026-01-27 |
| Morgan Stanley | Maintain | Overweight | 2026-01-22 |
| Citigroup | Maintain | Buy | 2026-01-20 |
| B of A Securities | Maintain | Buy | 2026-01-20 |
IonQ, Inc. Grades
The table below presents recent grades from recognized financial firms for IonQ, Inc.
| Grading Company | Action | New Grade | Date |
|---|---|---|---|
| Benchmark | Maintain | Buy | 2024-08-12 |
| Goldman Sachs | Maintain | Neutral | 2024-08-09 |
| Craig-Hallum | Maintain | Buy | 2024-08-08 |
| Needham | Maintain | Buy | 2024-05-16 |
| Needham | Maintain | Buy | 2024-05-09 |
| Goldman Sachs | Maintain | Neutral | 2024-02-29 |
| Needham | Maintain | Buy | 2024-02-29 |
| Morgan Stanley | Maintain | Equal Weight | 2023-10-30 |
| Needham | Maintain | Buy | 2023-09-20 |
| Needham | Maintain | Buy | 2023-09-19 |
Which company has the best grades?
Western Digital consistently receives positive ratings, mainly “Buy,” “Overweight,” and “Outperform,” from top analysts. IonQ’s grades, while also positive, include more “Neutral” and “Equal Weight” assessments. Investors might interpret Western Digital’s stronger consensus as greater institutional confidence.
Risks specific to each company
The following categories identify the critical pressure points and systemic threats facing both firms in the 2026 market environment:
1. Market & Competition
Western Digital Corporation
- Established player with strong market presence in data storage but faces intense competition from SSD and cloud storage providers.
IonQ, Inc.
- Emerging quantum computing firm operating in a nascent market with few direct competitors but high technological uncertainty.
2. Capital Structure & Debt
Western Digital Corporation
- Moderate leverage with debt-to-assets at 36.3% and interest coverage around 4.2x, indicating manageable debt risk.
IonQ, Inc.
- Minimal debt load (3.5% debt-to-assets), but zero interest coverage reflects no earnings to service debt.
3. Stock Volatility
Western Digital Corporation
- Beta of 1.85 suggests above-market volatility but still within technology sector norms.
IonQ, Inc.
- Very high beta of 2.63 indicates significant stock price swings and elevated risk.
4. Regulatory & Legal
Western Digital Corporation
- Potential risks from data privacy and international trade regulations affecting hardware manufacturing.
IonQ, Inc.
- Faces evolving regulatory landscape for quantum tech and data security, with possible compliance costs.
5. Supply Chain & Operations
Western Digital Corporation
- Complex global supply chain subject to semiconductor shortages and geopolitical tensions.
IonQ, Inc.
- Smaller scale operations with limited supply chain exposure but reliant on specialized quantum components.
6. ESG & Climate Transition
Western Digital Corporation
- Pressure to reduce carbon footprint in manufacturing; ESG scores increasingly influence investor sentiment.
IonQ, Inc.
- Early-stage company with potential to integrate sustainable practices but limited ESG track record.
7. Geopolitical Exposure
Western Digital Corporation
- Significant exposure to US-China trade tensions, impacting supply chain and sales in Asia.
IonQ, Inc.
- Primarily US-based with less direct geopolitical risk but dependent on global cloud platforms.
Which company shows a better risk-adjusted profile?
Western Digital’s most impactful risk is geopolitical exposure, notably US-China tensions disrupting supply chains. IonQ’s key risk is extreme stock volatility fueled by unproven technology and negative profitability. Western Digital shows a better risk-adjusted profile, supported by a strong Altman Z-score of 8.96 and robust operational metrics. IonQ’s negative margins and very weak Piotroski score (2) raise red flags. The stark contrast in financial health and market maturity justifies caution on IonQ despite its innovative potential.
Final Verdict: Which stock to choose?
Western Digital Corporation’s superpower lies in its durable competitive advantage and robust capital efficiency. It consistently delivers strong returns on invested capital well above its cost of capital, signaling value creation. A point of vigilance is its modest liquidity ratios, which suggest cautious monitoring of short-term obligations. This stock suits an Aggressive Growth portfolio seeking proven profitability in a cyclical industry.
IonQ, Inc. offers a strategic moat in emerging quantum computing technology with potential for disruptive growth. Its balance sheet shows low leverage, providing a safety cushion relative to Western Digital. However, it is still shedding value and faces profitability challenges, marking it as a speculative long-term play. It fits best in a GARP portfolio focused on innovation with an appetite for risk.
If you prioritize stable value creation and proven operational efficiency, Western Digital outshines IonQ due to its strong moat and favorable financial metrics. However, if you seek exposure to cutting-edge technology and can tolerate volatility, IonQ offers better stability in capital structure and growth potential, albeit with significant execution risk.
Disclaimer: Investment carries a risk of loss of initial capital. The past performance is not a reliable indicator of future results. Be sure to understand risks before making an investment decision.
Go Further
I encourage you to read the complete analyses of Western Digital Corporation and IonQ, Inc. to enhance your investment decisions: