In the rapidly evolving technology sector, Super Micro Computer, Inc. (SMCI) and IonQ, Inc. (IONQ) represent two distinct yet overlapping frontiers of innovation in computer hardware. SMCI focuses on high-performance servers and storage solutions, while IonQ pioneers quantum computing systems with cloud-based access. This comparison explores their market positions and growth potential to help you determine which company presents the most compelling investment opportunity in 2026.

Table of contents
Companies Overview
I will begin the comparison between Super Micro Computer, Inc. and IonQ, Inc. by providing an overview of these two companies and their main differences.
Super Micro Computer, Inc. Overview
Super Micro Computer, Inc. develops and manufactures high performance server and storage solutions based on modular and open architecture. Operating internationally, it serves enterprise data centers, cloud computing, AI, 5G, and edge computing markets. Its product range includes servers, storage systems, server management software, and technical support services, positioning it as a comprehensive hardware provider in the technology sector.
IonQ, Inc. Overview
IonQ, Inc. specializes in developing general-purpose quantum computing systems, providing access to quantum computers with 20 qubits. It delivers its technology via cloud platforms such as AWS, Microsoft Azure, and Google Cloud Marketplace, alongside its own cloud service. Founded in 2015, IonQ operates in the emerging quantum computing hardware market, focusing on innovative computing solutions.
Key similarities and differences
Both companies operate in the technology sector within the computer hardware industry, but Super Micro Computer focuses on traditional high-performance server and storage solutions, while IonQ develops cutting-edge quantum computing systems. Super Micro targets established markets like data centers and 5G, whereas IonQ is positioned in the nascent quantum computing cloud service market. Additionally, Super Micro employs over 5,600 people, compared to IonQ’s 407, reflecting different scales and stages of development.
Income Statement Comparison
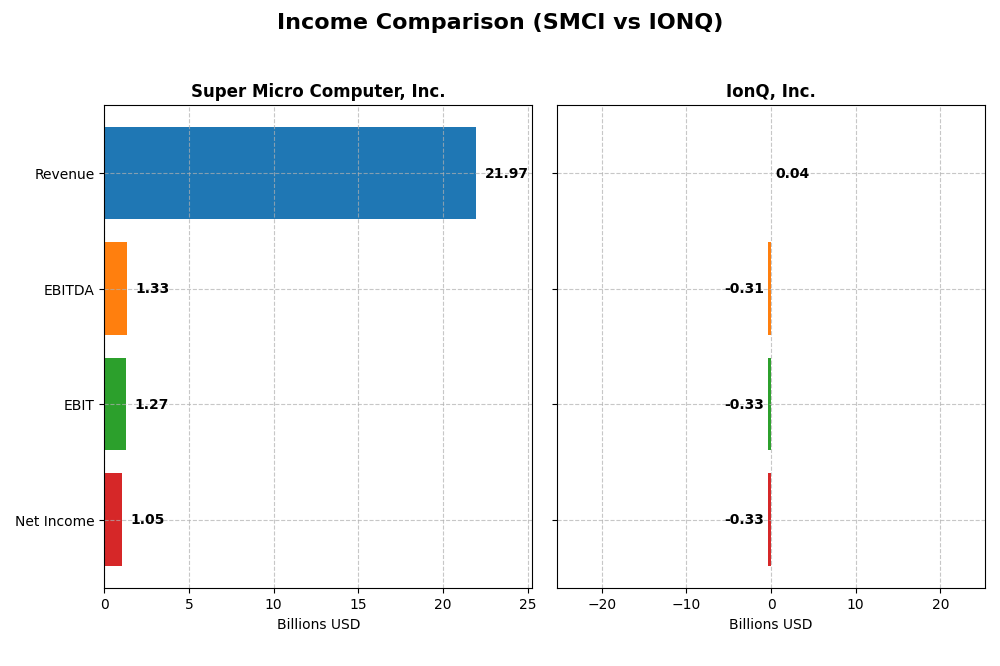
Below is the latest fiscal year income statement comparison between Super Micro Computer, Inc. and IonQ, Inc., highlighting key financial metrics for 2025 and 2024 respectively.
| Metric | Super Micro Computer, Inc. (SMCI) | IonQ, Inc. (IONQ) |
|---|---|---|
| Market Cap | 17.0B | 17.3B |
| Revenue | 21.97B (2025) | 43.1M (2024) |
| EBITDA | 1.33B (2025) | -313M (2024) |
| EBIT | 1.27B (2025) | -332M (2024) |
| Net Income | 1.05B (2025) | -332M (2024) |
| EPS | 1.77 (2025) | -1.56 (2024) |
| Fiscal Year | 2025 | 2024 |
Income Statement Interpretations
Super Micro Computer, Inc.
From 2021 to 2025, Super Micro Computer, Inc. exhibited strong revenue growth, surging from $3.6B to $21.97B, alongside a net income increase from $112M to $1.05B. Margins showed relative stability, with a gross margin around 11% and a net margin near 4.8%. The 2025 fiscal year saw a 46.6% revenue jump, while net margin declined by 38%, indicating some margin pressure despite solid top-line growth.
IonQ, Inc.
IonQ, Inc.’s revenue doubled from $22M in 2023 to $43M in 2024, but it remains unprofitable with a net loss increasing to $332M in 2024. Gross margins stayed low near 8.9%, and EBIT and net margins were deeply negative at around -770%. The most recent year showed revenue acceleration but worsening profitability and negative EPS, highlighting persistent losses despite sales growth.
Which one has the stronger fundamentals?
Super Micro Computer, Inc. displays stronger fundamentals with robust revenue and net income growth, stable margins, and mostly favorable income statement metrics. IonQ, Inc. faces significant profitability challenges, with large net losses and unfavorable margin trends despite revenue gains. The contrast in profitability and margin stability favors Super Micro Computer on fundamental grounds.
Financial Ratios Comparison
The following table presents a side-by-side comparison of key financial ratios for Super Micro Computer, Inc. (SMCI) and IonQ, Inc. (IONQ) for their most recent fiscal years, providing insights into profitability, liquidity, valuation, leverage, and operational efficiency.
| Ratios | Super Micro Computer, Inc. (2025) | IonQ, Inc. (2024) |
|---|---|---|
| ROE | 16.6% | -86.4% |
| ROIC | 9.3% | -48.6% |
| P/E | 27.7 | -26.8 |
| P/B | 4.62 | 23.18 |
| Current Ratio | 5.25 | 10.50 |
| Quick Ratio | 3.25 | 9.98 |
| D/E | 0.76 | 0.05 |
| Debt-to-Assets | 34.1% | 3.5% |
| Interest Coverage | 21.0 | 0 |
| Asset Turnover | 1.57 | 0.085 |
| Fixed Asset Turnover | 27.53 | 0.69 |
| Payout ratio | 0 | 0 |
| Dividend yield | 0% | 0% |
Interpretation of the Ratios
Super Micro Computer, Inc.
Super Micro Computer, Inc. shows a mixed ratio profile with favorable returns on equity (16.64%) and strong asset turnover metrics, but concerns arise from its high price-to-earnings (27.74) and price-to-book (4.62) ratios, alongside an elevated current ratio of 5.25. The company does not pay dividends, which may reflect a strategy focused on reinvestment or other corporate priorities.
IonQ, Inc.
IonQ, Inc. presents mostly unfavorable ratios, including a deeply negative net margin (-769.96%) and return on equity (-86.4%), coupled with weak asset turnover. However, IonQ benefits from a low debt-to-equity ratio (0.05) and high quick ratio (9.98). It also does not pay dividends, likely due to ongoing losses and a focus on growth and R&D investment.
Which one has the best ratios?
Comparing the two, Super Micro Computer, Inc. exhibits more favorable and balanced financial ratios, especially in profitability and operational efficiency. IonQ, Inc.’s ratios indicate significant financial challenges and negative returns, with a predominance of unfavorable metrics suggesting higher risk. Thus, Super Micro holds the stronger ratio position overall.
Strategic Positioning
This section compares the strategic positioning of Super Micro Computer, Inc. (SMCI) and IonQ, Inc. (IONQ) in terms of market position, key segments, and exposure to technological disruption:
Super Micro Computer, Inc. (SMCI)
- Established player in computer hardware with broad competitive pressure.
- Focuses on server and storage systems; drives revenue from modular hardware.
- Faces disruption risks typical of hardware sector but leverages modularity.
IonQ, Inc. (IONQ)
- Emerging quantum computing company with niche market and high volatility.
- Develops quantum computers accessed via cloud platforms like AWS and Azure.
- Operates in a highly innovative field with significant technological risks.
SMCI vs IONQ Positioning
SMCI adopts a diversified, hardware-centric approach serving multiple enterprise markets, benefiting from scale but facing intense competition. IONQ concentrates on quantum computing, with a specialized product and cloud-based delivery, exposing it to higher innovation risks and market uncertainty.
Which has the best competitive advantage?
SMCI shows a slightly unfavorable moat with growing profitability, indicating some value destruction but improving returns. IONQ has a very unfavorable moat with declining profitability, suggesting significant value destruction and weaker capital efficiency.
Stock Comparison
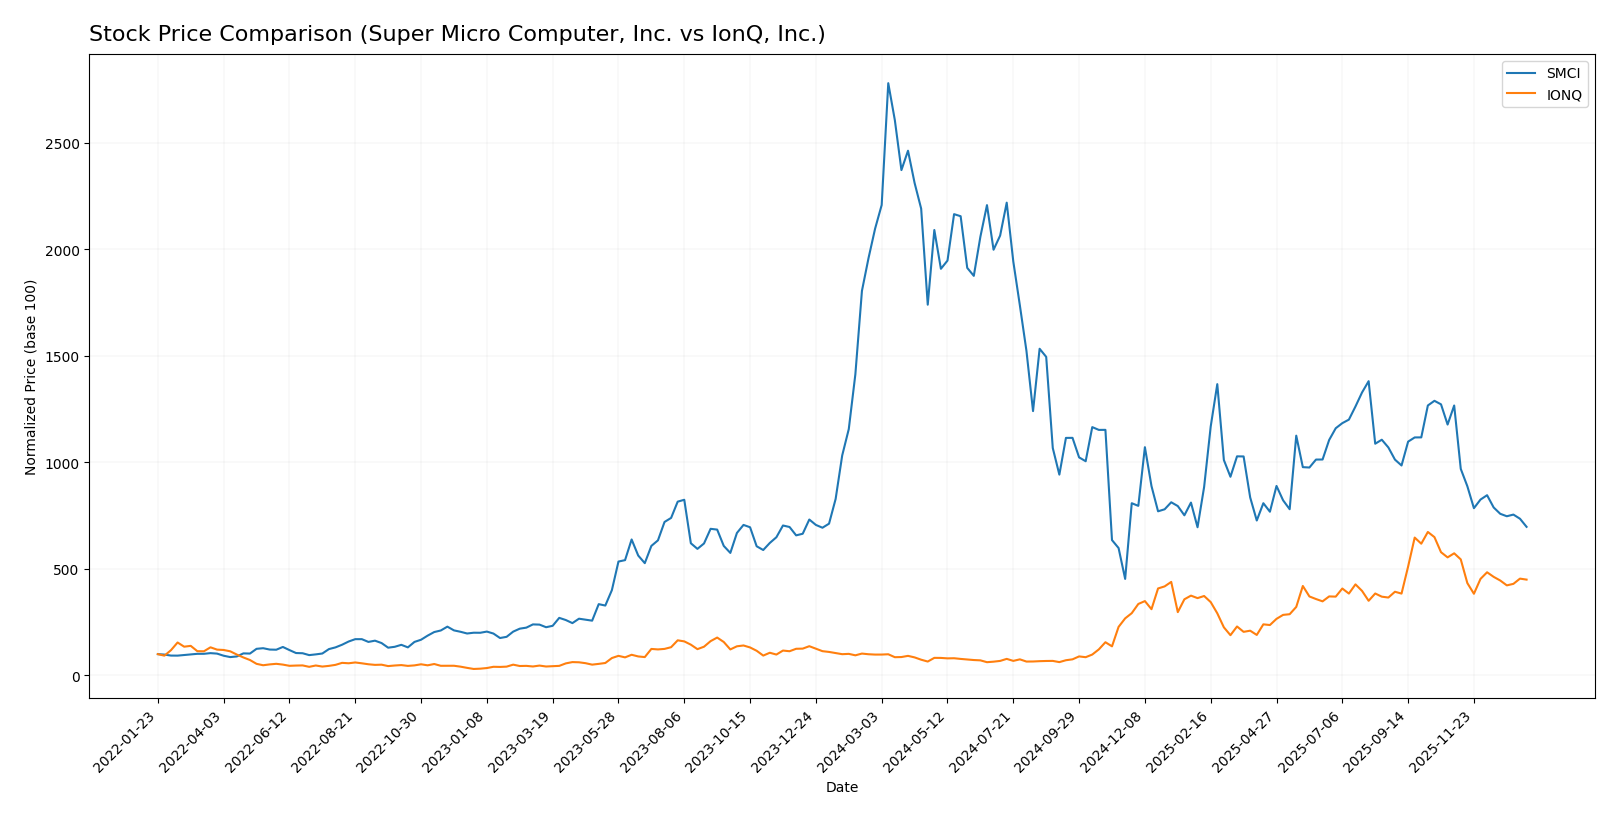
The stock price movements over the past 12 months reveal contrasting dynamics: Super Micro Computer, Inc. (SMCI) experienced a significant bearish trend with sharp declines and high volatility, while IonQ, Inc. (IONQ) showed a strong bullish trend despite recent deceleration and a pullback in the last two months.
Trend Analysis
Super Micro Computer, Inc. (SMCI) displayed a pronounced bearish trend over the past year with a price decline of -66.74%, accompanied by deceleration and high volatility measured by a 21.77 std deviation. The stock peaked at 114.0 and bottomed at 18.58.
IonQ, Inc. (IONQ) recorded a bullish trend with a remarkable +359.53% price increase over the same period, although the trend decelerated recently. Volatility was moderate at 18.7 std deviation, and the price ranged between 6.76 and 73.28.
Comparing both, IONQ delivered substantially higher market performance than SMCI over the past year, despite both stocks facing recent downward pressure in the latest two-month window.
Target Prices
The consensus target prices for Super Micro Computer, Inc. and IonQ, Inc. reflect a broad range of analyst expectations.
| Company | Target High | Target Low | Consensus |
|---|---|---|---|
| Super Micro Computer, Inc. | 64 | 26 | 49.71 |
| IonQ, Inc. | 100 | 55 | 72.57 |
Analysts see significant upside for both stocks relative to current prices: Super Micro trades well below consensus, while IonQ’s current price is also below its target consensus, suggesting bullish sentiment.
Analyst Opinions Comparison
This section compares analysts’ ratings and grades for Super Micro Computer, Inc. (SMCI) and IonQ, Inc. (IONQ):
Rating Comparison
SMCI Rating
- Rating: B-, considered very favorable overall.
- Discounted Cash Flow Score: 1, indicating very unfavorable valuation outlook.
- ROE Score: 4, showing favorable efficiency in generating profit from equity.
- ROA Score: 4, favorable in asset utilization for earnings generation.
- Debt To Equity Score: 1, very unfavorable, implying higher financial risk.
- Overall Score: 2, moderate overall financial standing.
IONQ Rating
- Rating: C-, also considered very favorable overall.
- Discounted Cash Flow Score: 1, indicating very unfavorable valuation outlook.
- ROE Score: 1, indicating very unfavorable efficiency in generating profit.
- ROA Score: 1, very unfavorable in asset utilization for earnings generation.
- Debt To Equity Score: 4, favorable, suggesting stronger balance sheet.
- Overall Score: 1, very unfavorable overall financial standing.
Which one is the best rated?
Based strictly on the provided data, SMCI is better rated than IONQ, with higher overall, ROE, and ROA scores. However, IONQ shows a stronger debt-to-equity position, indicating lower financial risk in that aspect.
Scores Comparison
Here is a comparison of the Altman Z-Score and Piotroski Score for Super Micro Computer, Inc. (SMCI) and IonQ, Inc. (IONQ):
SMCI Scores
- Altman Z-Score: 4.70, indicating a safe zone status
- Piotroski Score: 4, categorized as average
IONQ Scores
- Altman Z-Score: 3.67, also in the safe zone
- Piotroski Score: 2, classified as very weak
Which company has the best scores?
Based on the provided data, SMCI has a higher Altman Z-Score and a stronger Piotroski Score compared to IONQ, which shows a lower Piotroski Score despite both being in the safe zone for bankruptcy risk.
Grades Comparison
The following section presents an overview of the recent grades assigned to Super Micro Computer, Inc. and IonQ, Inc. by recognized grading companies:
Super Micro Computer, Inc. Grades
This table summarizes the latest grades and rating actions from established financial institutions for SMCI.
| Grading Company | Action | New Grade | Date |
|---|---|---|---|
| Barclays | Maintain | Equal Weight | 2024-10-02 |
| Loop Capital | Maintain | Buy | 2024-09-23 |
| JP Morgan | Downgrade | Neutral | 2024-09-06 |
| Barclays | Downgrade | Equal Weight | 2024-09-04 |
| Wells Fargo | Maintain | Equal Weight | 2024-08-28 |
| CFRA | Downgrade | Hold | 2024-08-28 |
| Barclays | Maintain | Overweight | 2024-08-28 |
| Goldman Sachs | Maintain | Neutral | 2024-08-08 |
| Rosenblatt | Maintain | Buy | 2024-08-07 |
| B of A Securities | Downgrade | Neutral | 2024-08-07 |
Overall, SMCI’s grades show a mixed trend with several downgrades from Buy/Overweight to Neutral/Hold and a consensus rating of Hold.
IonQ, Inc. Grades
Below is a summary of recent grades assigned by reputable firms for IONQ.
| Grading Company | Action | New Grade | Date |
|---|---|---|---|
| Benchmark | Maintain | Buy | 2024-08-12 |
| Goldman Sachs | Maintain | Neutral | 2024-08-09 |
| Craig-Hallum | Maintain | Buy | 2024-08-08 |
| Needham | Maintain | Buy | 2024-05-16 |
| Needham | Maintain | Buy | 2024-05-09 |
| Goldman Sachs | Maintain | Neutral | 2024-02-29 |
| Needham | Maintain | Buy | 2024-02-29 |
| Morgan Stanley | Maintain | Equal Weight | 2023-10-30 |
| Needham | Maintain | Buy | 2023-09-20 |
| Needham | Maintain | Buy | 2023-09-19 |
IONQ’s grades are consistently Buy or Neutral, with a consensus rating of Buy, indicating a generally positive outlook.
Which company has the best grades?
IonQ, Inc. has received stronger and more consistent Buy ratings compared to Super Micro Computer, Inc., which exhibits a more cautious Hold consensus with multiple downgrades. This difference may influence investors’ perception of growth potential and risk.
Strengths and Weaknesses
Below is a comparison of key strengths and weaknesses of Super Micro Computer, Inc. (SMCI) and IonQ, Inc. (IONQ) based on recent financial and operational data.
| Criterion | Super Micro Computer, Inc. (SMCI) | IonQ, Inc. (IONQ) |
|---|---|---|
| Diversification | Focused on server and storage systems with growing revenues; limited product range | Narrow focus on quantum computing, limiting current revenue streams |
| Profitability | Moderate profitability with ROIC near cost of capital; favorable ROE (16.64%) | Negative profitability; steep losses and declining ROIC and ROE |
| Innovation | Established in traditional server tech; innovation steady but incremental | High innovation potential in quantum computing but no proven profitability |
| Global presence | Global sales and growing market penetration in data center equipment | Emerging global presence but still limited market reach |
| Market Share | Growing market share in server and storage systems segment | Very small market share in quantum computing with high competition |
Key takeaways: SMCI shows steady growth and improving profitability despite value shedding, supported by a solid position in server hardware. IONQ faces significant challenges with negative returns and declining profitability despite its innovative quantum computing niche. Investors should weigh SMCI’s stability against IONQ’s high risk and potential reward.
Risk Analysis
Below is a comparative table summarizing key risks for Super Micro Computer, Inc. (SMCI) and IonQ, Inc. (IONQ) based on the most recent data:
| Metric | Super Micro Computer, Inc. (SMCI) | IonQ, Inc. (IONQ) |
|---|---|---|
| Market Risk | Moderate (Beta 1.53) | High (Beta 2.63) |
| Debt level | Moderate leverage (D/E 0.76) | Very low leverage (D/E 0.05) |
| Regulatory Risk | Moderate (Tech industry) | Moderate to High (Quantum tech regulation evolving) |
| Operational Risk | Moderate (5.3K employees, global ops) | High (Small team, emerging tech) |
| Environmental Risk | Low (Hardware manufacturing) | Low (Cloud-based quantum services) |
| Geopolitical Risk | Moderate (Global supply chain exposure) | Moderate (US-based, cloud reliance) |
The most impactful risk for IonQ is its high market volatility and unfavorable profitability metrics, reflecting the uncertainty in quantum computing commercialization. Super Micro Computer shows moderate market and operational risks but benefits from stronger financial stability and profitability, with moderate debt levels and a safe bankruptcy risk profile. Investors should weigh IonQ’s innovation potential against its financial and operational vulnerabilities.
Which Stock to Choose?
Super Micro Computer, Inc. (SMCI) shows a favorable income statement with strong revenue growth of 46.59% in the last year and an overall net income growth of 837.61% over five years. Its financial ratios present a balanced profile with a favorable 16.64% ROE but some unfavorable metrics like net margin and valuation multiples. The company demonstrates slightly unfavorable MOAT due to ROIC below WACC despite a growing trend. SMCI’s rating is very favorable at B-, supported by safe Altman Z-Score and average Piotroski score, though its stock price trend is bearish.
IonQ, Inc. (IONQ) exhibits an unfavorable income statement marked by a net margin of -769.96% and negative profitability metrics, despite strong revenue growth of 95.41% last year. Its financial ratios are mostly unfavorable, including negative ROE and ROIC, but it maintains low debt levels with favorable debt-to-equity scores. The company’s MOAT is very unfavorable with declining ROIC well below WACC. IonQ holds a very favorable rating at C- but shows a very weak Piotroski score, and its stock has experienced a strong overall bullish run recently despite recent price declines.
Investors focused on growth might find IonQ appealing due to its high revenue expansion and low leverage, though its profitability and financial stability metrics remain weak. Conversely, those prioritizing established profitability and financial health may perceive SMCI’s improving income and balanced ratios as more favorable, despite its recent stock price weakness and mixed valuation signals.
Disclaimer: Investment carries a risk of loss of initial capital. The past performance is not a reliable indicator of future results. Be sure to understand risks before making an investment decision.
Go Further
I encourage you to read the complete analyses of Super Micro Computer, Inc. and IonQ, Inc. to enhance your investment decisions: