Home > Comparison > Technology > STX vs IONQ
The strategic rivalry between Seagate Technology Holdings plc and IonQ, Inc. shapes the evolving landscape of the technology sector. Seagate operates as a capital-intensive leader in computer hardware, specializing in mass storage solutions. In contrast, IonQ pioneers quantum computing with a nimble, high-growth model. This analysis will assess which trajectory—established infrastructure versus cutting-edge innovation—offers a superior risk-adjusted return for diversified portfolios in 2026.
Table of contents
Companies Overview
Seagate Technology Holdings plc and IonQ, Inc. represent two distinct forces within the evolving computer hardware market.
Seagate Technology Holdings plc: Veteran Data Storage Leader
Seagate dominates mass capacity storage products, from enterprise HDDs and SSDs to network-attached storage drives. Its core revenue stems from selling to OEMs, distributors, and retailers worldwide. In 2026, Seagate sharpens its focus on the Lyve edge-to-cloud platform, aiming to integrate traditional storage with scalable cloud solutions.
IonQ, Inc.: Quantum Computing Pioneer
IonQ leads in general-purpose quantum computing systems, offering access to 20-qubit quantum machines via major cloud platforms like AWS and Azure. Its revenue model revolves around cloud-based quantum computing services. In 2026, IonQ accelerates its strategy to expand cloud partnerships to commercialize quantum computing more broadly.
Strategic Collision: Similarities & Divergences
Seagate’s business centers on physical data storage hardware, while IonQ pursues a software-driven quantum computing ecosystem. Both compete in the broader technology hardware space but target fundamentally different market needs. Seagate offers scale and legacy strength; IonQ presents innovation potential but with higher volatility and emerging risks. Their investment profiles reflect this contrast: established resilience versus disruptive growth.
Income Statement Comparison
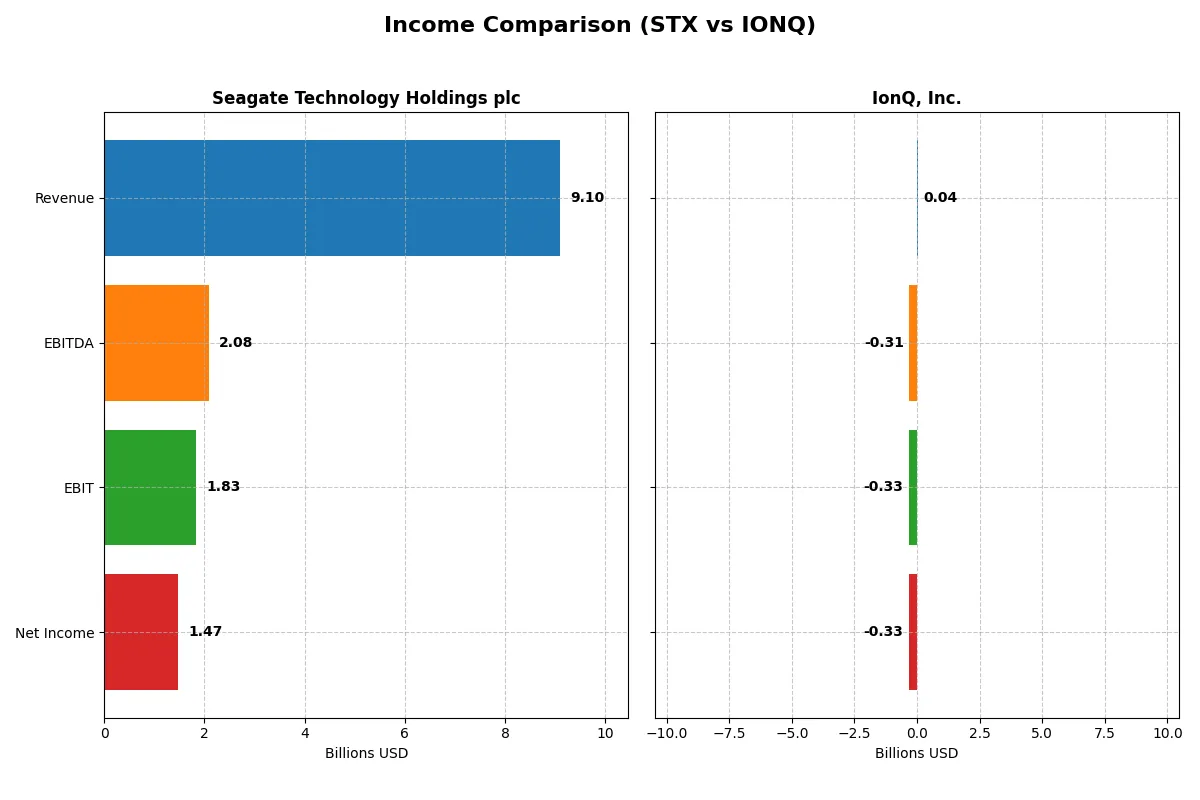
This data dissects the core profitability and scalability of both corporate engines to reveal who dominates the bottom line:
| Metric | Seagate Technology Holdings plc (STX) | IonQ, Inc. (IONQ) |
|---|---|---|
| Revenue | 9.1B | 43M |
| Cost of Revenue | 5.9B | 39M |
| Operating Expenses | 1.3B | 235M |
| Gross Profit | 3.2B | 4M |
| EBITDA | 2.1B | -313M |
| EBIT | 1.8B | -332M |
| Interest Expense | 321M | 0 |
| Net Income | 1.47B | -332M |
| EPS | 6.93 | -1.56 |
| Fiscal Year | 2025 | 2024 |
Income Statement Analysis: The Bottom-Line Duel
The income statement comparison reveals which company efficiently converts revenue into profit despite industry volatility and operational challenges.
Seagate Technology Holdings plc Analysis
Seagate’s revenue grew from 6.55B in 2024 to 9.1B in 2025, with net income surging from 335M to 1.47B. Gross margin climbed to a robust 35.18%, while net margin improved to 16.15%, signaling strong cost control and operational leverage. The 2025 figures highlight a powerful rebound and momentum in profitability.
IonQ, Inc. Analysis
IonQ’s revenue nearly doubled from 22M in 2023 to 43M in 2024, yet net income remained deeply negative at -332M. Its gross margin stands at a weak 8.87%, with a net margin of -770%, reflecting ongoing heavy R&D and operational costs. Despite revenue growth, losses indicate persistent inefficiencies and negative operating leverage.
Margin Mastery vs. Growth Struggles
Seagate dominates with solid margins and a 1.47B net income profit in 2025, while IonQ’s losses persist despite revenue gains. Seagate’s margin health and earnings momentum mark it as the fundamentally stronger engine. Investors seeking profitability will find Seagate’s profile more attractive than IonQ’s high-growth, high-burn trajectory.
Financial Ratios Comparison
These vital ratios act as a diagnostic tool to expose the underlying fiscal health, valuation premiums, and capital efficiency of the companies compared below:
| Ratios | Seagate Technology Holdings plc (STX) | IonQ, Inc. (IONQ) |
|---|---|---|
| ROE | -3.24% (2025) | -86.40% (2024) |
| ROIC | 33.76% (2025) | -48.55% (2024) |
| P/E | 20.41 (2025) | -26.83 (2024) |
| P/B | -66.19 (2025) | 23.18 (2024) |
| Current Ratio | 1.38 (2025) | 10.50 (2024) |
| Quick Ratio | 0.84 (2025) | 9.98 (2024) |
| D/E | -11.86 (2025) | 0.05 (2024) |
| Debt-to-Assets | 66.97% (2025) | 3.49% (2024) |
| Interest Coverage | 5.89 (2025) | 0 (2024) |
| Asset Turnover | 1.13 (2025) | 0.08 (2024) |
| Fixed Asset Turnover | 5.49 (2025) | 0.69 (2024) |
| Payout Ratio | 40.84% (2025) | 0% (2024) |
| Dividend Yield | 2.00% (2025) | 0% (2024) |
| Fiscal Year | 2025 | 2024 |
Efficiency & Valuation Duel: The Vital Signs
Financial ratios act as a company’s DNA, exposing hidden risks and operational strengths critical for sound investment decisions.
Seagate Technology Holdings plc
Seagate demonstrates a mixed profitability profile with a negative ROE of -324% but a strong ROIC at 33.8%, indicating efficient capital use despite shareholder equity erosion. The P/E ratio of 20.4 suggests a fairly valued stock. A 2% dividend yield reflects steady shareholder returns amid reinvestment in R&D, supporting future growth.
IonQ, Inc.
IonQ’s financial health reveals severe operational challenges, marked by a negative ROE of -86.4% and a deeply negative net margin near -770%. Despite a favorable negative P/E ratio, its high P/B of 23.2 and poor asset turnover highlight inefficiency. No dividends are paid; heavy R&D spending dominates capital allocation, reflecting growth-stage reinvestment.
Operational Efficiency vs. Growth Risk
Seagate balances operational efficiency and shareholder returns better than IonQ, whose financials signal high risk and low current profitability. Investors seeking stability may prefer Seagate’s mixed but more grounded profile, while those targeting speculative growth might consider IonQ’s aggressive reinvestment strategy.
Which one offers the Superior Shareholder Reward?
I observe Seagate Technology (STX) pays a consistent dividend yield around 2-3%, with a moderate payout ratio near 40%. It couples dividends with steady buybacks, supported by strong free cash flow (3.8B FCF per share in 2025). IonQ (IONQ) pays no dividend and burns cash, investing heavily in R&D for growth. Its buyback program is nonexistent, reflecting its early-stage status and negative margins. Historically, Seagate’s balanced distribution mix offers sustainable shareholder returns. IONQ’s reinvestment strategy suits growth investors but carries higher risk. For 2026, I judge Seagate’s total return profile superior due to dependable cash returns and disciplined capital allocation.
Comparative Score Analysis: The Strategic Profile
The radar chart reveals the fundamental DNA and trade-offs of Seagate Technology and IonQ, highlighting their unique financial strengths and vulnerabilities:
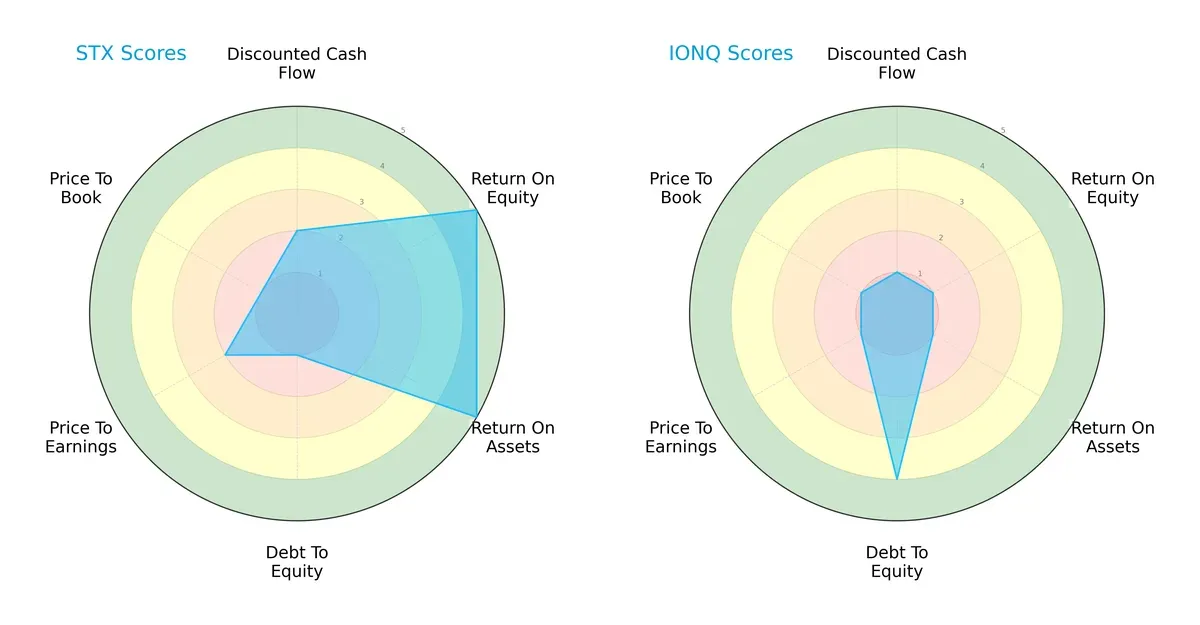
Seagate Technology (STX) presents a more balanced profile with high ROE and ROA scores (5 each), indicating efficient profit generation and asset utilization. However, it carries significant financial risk with a very unfavorable debt-to-equity score (1). IonQ (IONQ) relies on a stronger balance sheet, reflected by its favorable debt-to-equity score (4), but struggles across profitability and valuation metrics, scoring very low on ROE, ROA, and DCF. STX’s profile suggests operational strength with leverage concerns, while IONQ’s edge lies in financial stability but suffers from weak profitability and valuation.
Bankruptcy Risk: Solvency Showdown
The Altman Z-Score difference clearly favors Seagate Technology’s robust solvency, securing its long-term survival in this cycle:
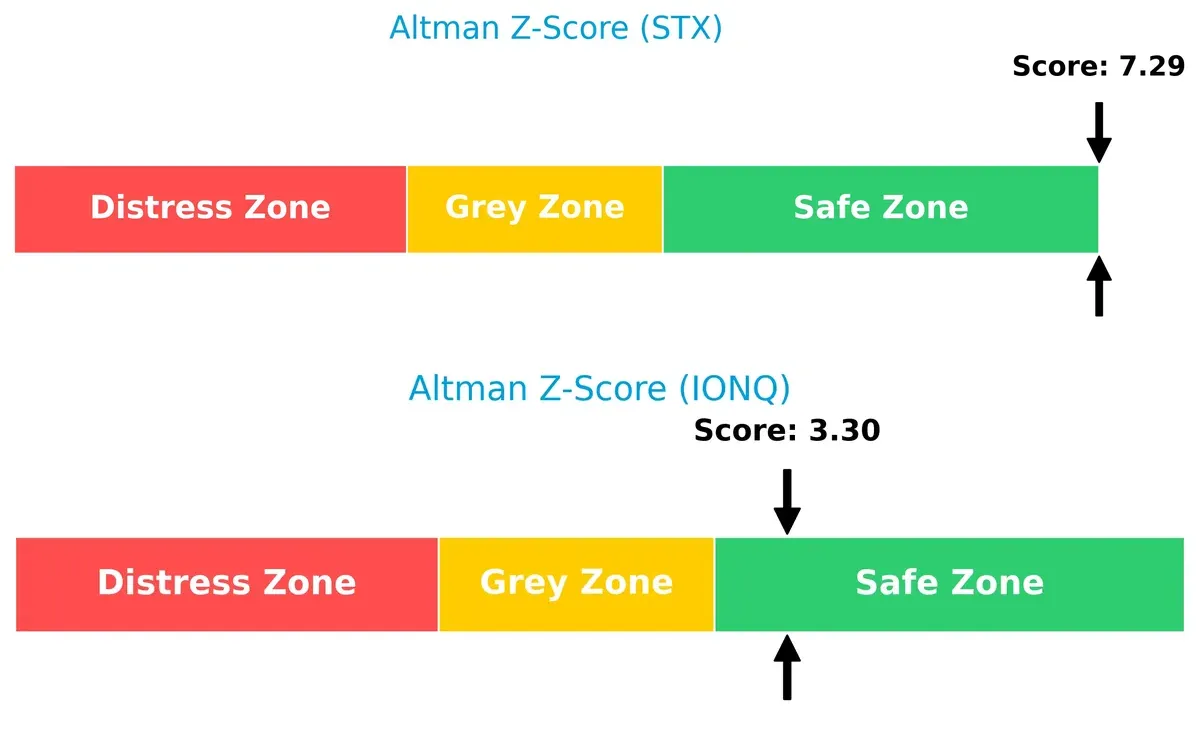
Seagate scores 7.3, well into the safe zone, signaling strong financial health and low bankruptcy risk. IonQ’s score of 3.3 also places it in the safe zone but much closer to the grey area, implying moderate vulnerability. This gap underscores STX’s superior ability to withstand economic stress compared to IONQ.
Financial Health: Quality of Operations
Piotroski F-Scores highlight Seagate’s peak financial health versus IonQ’s internal red flags:
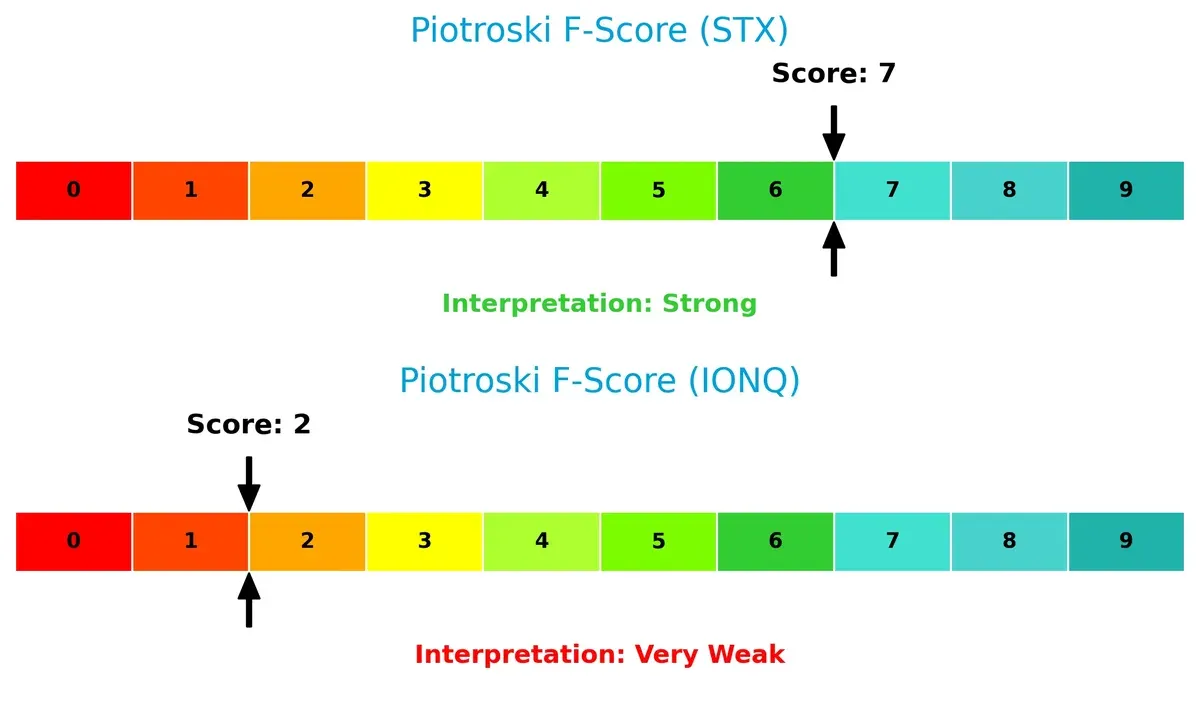
Seagate’s score of 7 reflects strong operational quality, signaling efficient profitability, liquidity, and leverage management. IonQ’s score of 2 raises caution, indicating weak fundamentals and potential financial distress. Investors should weigh STX’s robust internal metrics against IONQ’s fragile financial condition before committing capital.
How are the two companies positioned?
This section dissects the operational DNA of STX and IONQ by comparing their revenue distribution and internal dynamics. The goal is to confront their economic moats to reveal which business model offers the most resilient, sustainable advantage today.
Strengths and Weaknesses Comparison
This table compares the Strengths and Weaknesses of Seagate Technology Holdings plc and IonQ, Inc.:
Seagate Technology Holdings plc Strengths
- Favorable net margin at 16.15%
- High ROIC of 33.76% indicating strong capital efficiency
- Solid global presence with multi-billion revenues in US, Singapore, Netherlands
- Favorable asset and fixed asset turnover ratios
- Positive dividend yield of 2.0%
IonQ, Inc. Strengths
- Favorable quick ratio at 9.98 indicating liquidity
- Very low debt to assets ratio at 3.49% reduces financial risk
- Favorable debt to equity ratio near zero
- Favorable PE ratio despite negative earnings
Seagate Technology Holdings plc Weaknesses
- Negative ROE at -324.28% signals poor equity profitability
- High debt to assets ratio at 66.97% increases leverage risk
- WACC at 11.1% unfavorable relative to capital returns
- Neutral current and quick ratios suggest moderate liquidity concerns
IonQ, Inc. Weaknesses
- Large negative net margin of -769.96% indicates heavy losses
- Negative ROE and ROIC reflect poor profitability and capital use
- High WACC at 16.18% increases cost of capital
- Unfavorable interest coverage at zero and low asset turnover ratios
- No dividend yield and unfavorable PB ratio
Seagate demonstrates strong profitability and global revenue diversification but carries significant leverage risks. IonQ shows strong liquidity and low leverage but faces severe profitability challenges and high capital costs. These contrasting profiles highlight differing strategic priorities and financial health.
The Moat Duel: Analyzing Competitive Defensibility
A structural moat is the only shield protecting long-term profits from relentless competition and market disruption. Let’s dissect two rivals’ moats:
Seagate Technology Holdings plc: Durable Cost Advantage
Seagate’s moat stems from a cost advantage in mass data storage, reflected in a robust 22.7% ROIC above WACC. Its stable 35% gross margin and expanding cloud storage platforms deepen this moat in 2026.
IonQ, Inc.: Emerging Technological Innovation
IonQ’s moat relies on quantum computing innovation, a nascent and fragile moat unlike Seagate’s cost leadership. Its negative ROIC and margin volatility highlight weak competitive positioning, though quantum breakthroughs could disrupt markets long-term.
Cost Efficiency vs. Quantum Pioneering: The Moat Verdict
Seagate’s wider, proven moat with strong profitability outmatches IonQ’s early-stage technological moat, which currently destroys value. Seagate stands far better equipped to defend and grow market share in 2026.
Which stock offers better returns?
The past year saw Seagate Technology Holdings plc’s stock surge sharply, while IonQ, Inc. showed strong gains before recent declines and eased momentum.
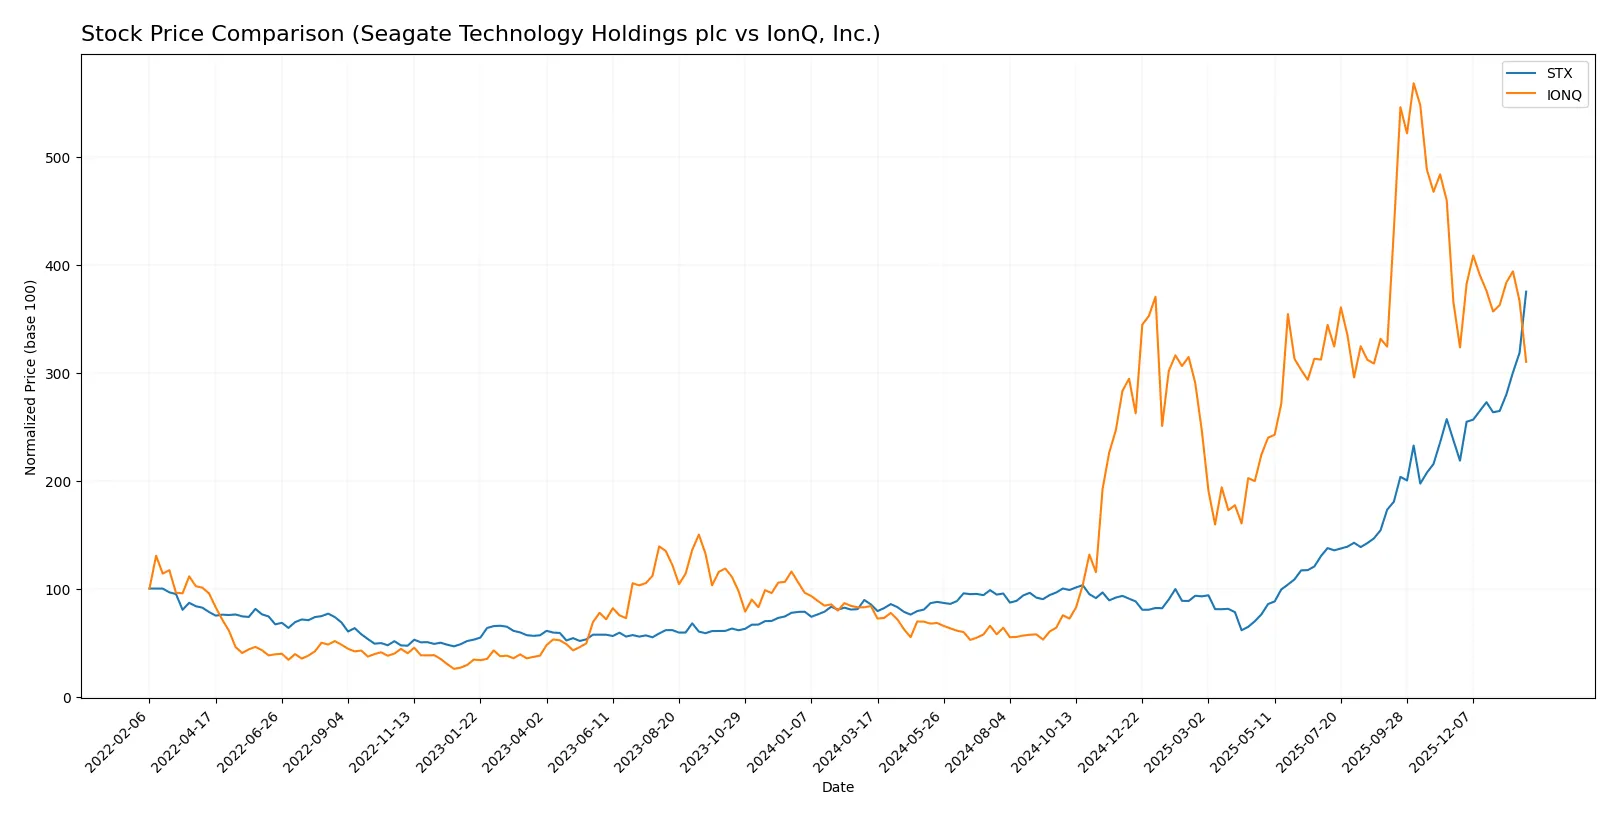
Trend Comparison
Seagate Technology’s stock rose 340% over the last 12 months, showing a bullish trend with acceleration. It reached a high of 407.69 and a low of 66.73, reflecting notable volatility.
IonQ’s stock increased 270% over the same period but shows a decelerating bullish trend. The price peaked at 73.28 and bottomed at 6.76, with recent decline of 15% indicating short-term weakness.
Seagate outperformed IonQ with a higher overall return and accelerating momentum, while IonQ’s recent negative trend and seller dominance suggest weaker near-term performance.
Target Prices
Analysts present a clear target price consensus for both Seagate Technology and IonQ, reflecting their growth expectations.
| Company | Target Low | Target High | Consensus |
|---|---|---|---|
| Seagate Technology Holdings plc | 270 | 505 | 407.2 |
| IonQ, Inc. | 55 | 100 | 72.57 |
Seagate’s consensus target price aligns closely with its current price near 408, suggesting limited upside. IonQ’s target consensus of 72.57 significantly exceeds its current 40 price, indicating bullish analyst sentiment.
How do institutions grade them?
Seagate Technology Holdings plc Grades
The following table summarizes recent grades issued by major financial institutions for Seagate Technology Holdings plc:
| Grading Company | Action | New Grade | Date |
|---|---|---|---|
| Citigroup | Maintain | Buy | 2026-01-29 |
| Baird | Maintain | Outperform | 2026-01-29 |
| Rosenblatt | Maintain | Buy | 2026-01-28 |
| Wells Fargo | Maintain | Equal Weight | 2026-01-28 |
| Cantor Fitzgerald | Maintain | Overweight | 2026-01-28 |
| Mizuho | Maintain | Outperform | 2026-01-28 |
| UBS | Maintain | Neutral | 2026-01-28 |
| Goldman Sachs | Maintain | Buy | 2026-01-28 |
| Barclays | Maintain | Equal Weight | 2026-01-28 |
| Mizuho | Maintain | Outperform | 2026-01-27 |
IonQ, Inc. Grades
This table presents recent grades for IonQ, Inc. from recognized grading firms:
| Grading Company | Action | New Grade | Date |
|---|---|---|---|
| Benchmark | Maintain | Buy | 2024-08-12 |
| Goldman Sachs | Maintain | Neutral | 2024-08-09 |
| Craig-Hallum | Maintain | Buy | 2024-08-08 |
| Needham | Maintain | Buy | 2024-05-16 |
| Needham | Maintain | Buy | 2024-05-09 |
| Goldman Sachs | Maintain | Neutral | 2024-02-29 |
| Needham | Maintain | Buy | 2024-02-29 |
| Morgan Stanley | Maintain | Equal Weight | 2023-10-30 |
| Needham | Maintain | Buy | 2023-09-20 |
| Needham | Maintain | Buy | 2023-09-19 |
Which company has the best grades?
Seagate Technology consistently receives strong buy and outperform ratings from multiple top-tier firms. IonQ shows a solid buy trend but also includes several neutral and equal weight ratings. Seagate’s higher frequency of bullish grades may suggest greater institutional confidence and potentially more favorable investor sentiment.

Don’t Let Luck Decide Your Entry Point
Optimize your entry points with our advanced ProRealTime indicators. You’ll get efficient buy signals with precise price targets for maximum performance. Start outperforming now!
Risks specific to each company
The following categories identify the critical pressure points and systemic threats facing both firms in the 2026 market environment:
1. Market & Competition
Seagate Technology Holdings plc
- Well-established in data storage with strong market presence and diversified product lines.
IonQ, Inc.
- Emerging quantum computing player facing intense competition and uncertain market demand.
2. Capital Structure & Debt
Seagate Technology Holdings plc
- High debt-to-assets ratio (67%) signals leverage risk despite favorable interest coverage.
IonQ, Inc.
- Very low debt levels with strong liquidity but zero interest coverage indicates no current earnings to service debt.
3. Stock Volatility
Seagate Technology Holdings plc
- Beta at 1.62 shows above-average volatility relative to the market but within tech sector norms.
IonQ, Inc.
- Beta at 2.63 reflects very high volatility, amplifying investment risk.
4. Regulatory & Legal
Seagate Technology Holdings plc
- Operates globally with exposure to data privacy and trade regulations.
IonQ, Inc.
- Faces emerging regulatory scrutiny typical for quantum tech and cloud service providers.
5. Supply Chain & Operations
Seagate Technology Holdings plc
- Large global operations may face supply chain bottlenecks but benefits from scale.
IonQ, Inc.
- Smaller scale and reliance on cloud platforms increases operational dependency risks.
6. ESG & Climate Transition
Seagate Technology Holdings plc
- Established ESG practices in manufacturing but heavy industrial footprint poses challenges.
IonQ, Inc.
- Early-stage company with potential to embed sustainability but limited current disclosures.
7. Geopolitical Exposure
Seagate Technology Holdings plc
- Significant international footprint exposes it to trade tensions and geopolitical risks.
IonQ, Inc.
- Primarily US-based, reducing direct geopolitical risks but still exposed via global cloud partnerships.
Which company shows a better risk-adjusted profile?
Seagate’s main risk is its elevated leverage, which could pressure cash flow in tighter credit markets. IonQ’s key risk is its weak profitability and high volatility, reflecting early-stage operational and market challenges. I see Seagate as having a better risk-adjusted profile due to its stable earnings, strong Altman Z-score (7.3), and robust Piotroski score (7). IonQ’s low Piotroski score (2) and unfavorable profitability ratios signal higher financial distress risk despite low debt. The recent steep stock price drops confirm investor concerns about IonQ’s ability to scale profitably.
Final Verdict: Which stock to choose?
Seagate Technology Holdings plc (STX) stands out as a cash-generating powerhouse with a proven ability to create value through superior capital efficiency. Its robust operating metrics and accelerating bullish price trend highlight growth potential. The key point of vigilance remains its elevated debt level, which could pressure financial flexibility. STX suits investors seeking aggressive growth with a tolerance for leverage risk.
IonQ, Inc. (IONQ) offers a compelling strategic moat in quantum computing innovation, backed by a strong balance sheet with minimal debt. While it lacks profitability and shows declining returns, its cutting-edge technology and safety profile make it attractive for those favoring longer-term, high-risk growth themes. I see IonQ fitting well within GARP (Growth at a Reasonable Price) or speculative growth portfolios.
If you prioritize durable value creation and operational strength, Seagate outshines with its ability to sustain returns above cost of capital. However, if you seek exposure to pioneering technology with better financial safety but accept ongoing losses, IonQ offers superior downside protection despite its unsettled profitability. Both present distinct analytical scenarios aligned with divergent investor risk appetites and time horizons.
Disclaimer: Investment carries a risk of loss of initial capital. The past performance is not a reliable indicator of future results. Be sure to understand risks before making an investment decision.
Go Further
I encourage you to read the complete analyses of Seagate Technology Holdings plc and IonQ, Inc. to enhance your investment decisions: